Smart Rings Market Size 2025-2029
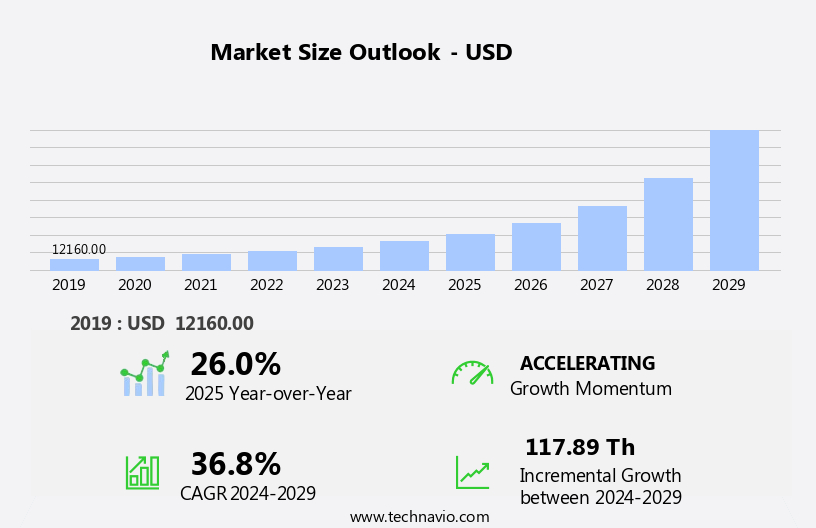
The smart rings market size is forecast to increase by USD 117.89 th, at a CAGR of 36.8% between 2024 and 2029.
- The market is poised for significant growth, driven by the increasing digitization of the global economy and the popularity of wearable devices as payment methods. This trend is fueled by the convenience and discreetness that smart rings offer, allowing users to make transactions without the need for a physical wallet or smartphone. However, the market faces challenges, including the presence of alternatives for smart rings such as smartwatches and fitness bands, which may offer more features and functionalities. Another obstacle is the relatively high cost of smart rings compared to these alternatives, which may limit their appeal to price-sensitive consumers.
- To capitalize on market opportunities, companies must focus on developing innovative features and functionalities that differentiate their smart rings from competitors. Additionally, offering competitive pricing and partnerships with financial institutions and payment providers can help expand the market reach and appeal to a wider audience. Overall, the market presents significant potential for growth, but companies must navigate challenges effectively to succeed in this competitive landscape.
What will be the Size of the Smart Rings Market during the forecast period?
Explore in-depth regional segment analysis with market size data - historical 2019-2023 and forecasts 2025-2029 - in the full report.
Request Free Sample
The market continues to evolve, driven by advancements in technology and shifting consumer preferences. These wearable devices offer a blend of functionality and style, integrating seamlessly with smartphones and other connected devices. Notification alerts, remote control capabilities, and third-party app support are just a few features that enhance the user experience (UX). Firmware updates ensure the rings remain current, while wearable sensors enable activity monitoring, sleep tracking, and heart rate measurement. Payment processing and contactless payments add convenience, while smart home integration allows for hands-free control of various appliances. Customer loyalty is fostered through personalized recommendations and customization options, as brands differentiate themselves through pricing strategies, brand awareness, and biometric authentication.
OLED displays and touchscreen interfaces offer sleek designs, while manufacturing processes ensure durability with features like water resistance, dust resistance, scratch resistance, and GPS tracking. Regulation and standards play a crucial role in market development, shaping compatibility standards, distribution channels, and intellectual property considerations. Consumer adoption is influenced by lifestyle trends, user interface (UI), and mobile app integration. Stay tuned for ongoing market activities and evolving patterns in this dynamic and innovative sector.
How is this Smart Rings Industry segmented?
The smart rings industry research report provides comprehensive data (region-wise segment analysis), with forecasts and estimates in "USD thousand" for the period 2025-2029, as well as historical data from 2019-2023 for the following segments.
- Technology
- Bluetooth-enabled smart rings
- NFC-enabled smart rings
- Application
- Notifications
- Security
- Payment
- Health and wellness
- Data transfer
- Type
- Android
- IOS
- Windows phone
- Compatible systems
- Geography
- North America
- US
- Canada
- Europe
- France
- Germany
- Italy
- The Netherlands
- UK
- APAC
- China
- India
- Japan
- Rest of World (ROW)
- North America
.
By Technology Insights
The bluetooth-enabled smart rings segment is estimated to witness significant growth during the forecast period.
The market is experiencing significant growth, driven by the integration of advanced technologies such as Bluetooth, NFC, and biometric authentication. These features enable health tracking, software updates, wireless charging, smartphone connectivity, notification alerts, remote control, and customization options. Fashion trends and brand awareness are also key factors driving demand, with many manufacturers offering stainless steel, water-resistant, and dust-resistant designs. Manufacturers prioritize user experience (UX) through OLED displays, personalized recommendations, and mobile app integration. Wearable sensors and third-party app support further expand functionality, enabling activity monitoring, sleep tracking, and fitness training. Smart home integration, firmware updates, and smartwatch compatibility are additional features attracting consumers.
Supply chain management and distribution channels ensure a steady flow of these devices to retail sales outlets and online platforms. Pricing strategies and customer loyalty programs are essential for market penetration and consumer acquisition. Regulation and standards, such as contactless payments and security features, further enhance the market's appeal. Product differentiation is crucial, with manufacturers focusing on battery life, scratch resistance, and gps tracking to stand out. Manufacturing processes are optimized to meet compatibility standards and ensure user-friendly interfaces. Lifestyle trends and consumer adoption continue to shape the market, with a focus on heart rate monitoring and payment processing.
In conclusion, the market is evolving rapidly, with Bluetooth-enabled devices leading the way due to their integration with smartphones and the convenience of notification alerts. The compact size of smart rings necessitates efficient battery usage, with an average battery life of 2-7 days from a single charge. The market's future growth will be influenced by ongoing advancements in technology, user experience, and consumer preferences.
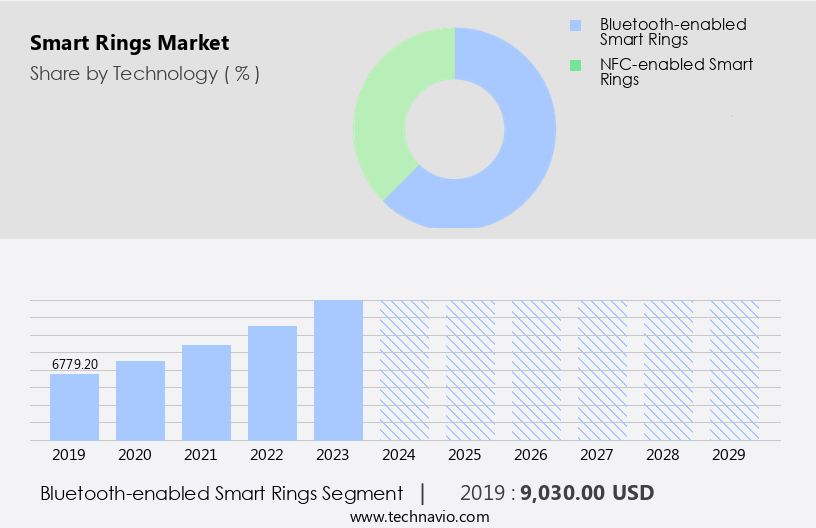
The Bluetooth-enabled smart rings segment was valued at USD 9,030.00 th in 2019 and showed a gradual increase during the forecast period.
Regional Analysis
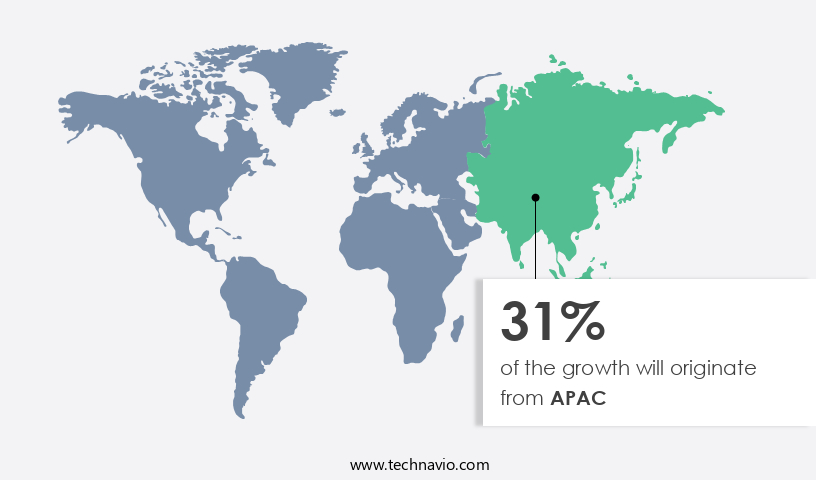
APAC is estimated to contribute 31% to the growth of the global market during the forecast period. Technavio's analysts have elaborately explained the regional trends and drivers that shape the market during the forecast period.
The market is witnessing significant growth, driven by advancements in health tracking, software updates, wireless charging, and smartphone connectivity. Notification alerts, remote control, and smartphone compatibility are key features attracting consumers. Supply chain management and fashion trends are also influencing market dynamics. Data analytics and NFC technology enable personalized recommendations and contactless payments. Water resistance and dust resistance enhance the durability of these devices, while brand awareness and pricing strategies shape consumer perception. Biometric authentication and touchscreen interfaces offer enhanced security and convenience. Marketing campaigns and customization options cater to diverse user preferences. Stainless steel and product differentiation set smart rings apart from other wearables.
Smartwatch compatibility, scratch resistance, and GPS tracking are additional features gaining traction. Manufacturing processes prioritize user experience (UX), with OLED displays and personalized recommendations enhancing the user interface (UI). Online sales and third-party app support expand distribution channels. Customer loyalty and smart home integration offer long-term benefits. Firmware updates and activity monitoring ensure continuous improvement. Payment processing and user interface (UI) integration streamline transactions. Lifestyle trends, regulation and standards, and battery life are crucial factors shaping the market. Targeting fitness enthusiasts, tech-savvy consumers, and those seeking minimalist wearables, companies are focusing on consumer adoption and compatibility standards. Retail sales and heart rate monitoring are essential revenue streams.
Security features and retail partnerships are essential for market penetration.
Market Dynamics
Our researchers analyzed the data with 2024 as the base year, along with the key drivers, trends, and challenges. A holistic analysis of drivers will help companies refine their marketing strategies to gain a competitive advantage.
What are the key market drivers leading to the rise in the adoption of Smart Rings Industry?
- The growing digitization of the global economy serves as the primary catalyst for market expansion.
- The market is experiencing significant growth due to the digitalization of the economy and the integration of IoT technologies. Enhanced internet accessibility and the widespread adoption of mobile devices are driving this transformation. Smart rings offer a new level of connectivity and convenience by seamlessly integrating with smartphones and other IoT devices. This integration enhances the user experience by enabling features such as notifications, health monitoring, and contactless payments directly from the ring. Pricing strategies and brand awareness play a crucial role in the market. Customization options, including stainless steel materials and OLED displays, contribute to product differentiation.
- Biometric authentication and touchscreen interfaces add to the functionality and user experience. Smartwatch compatibility and scratch resistance are also essential considerations for consumers. GPS tracking and manufacturing processes ensure the production of high-quality, durable smart rings. The market is expected to continue growing as technology advances and consumers seek more immersive and harmonious wearable experiences. The user experience (UX) is a key focus for manufacturers, emphasizing ease of use, seamless integration, and intuitive design. Overall, the market offers a promising future for innovative wearable technology that enhances daily life.
What are the market trends shaping the Smart Rings Industry?
- Wearable devices are gaining popularity as viable payment methods, representing an emerging market trend. This shift towards contactless and convenient payment solutions is expected to significantly impact the financial technology industry.
- The market for smart rings is experiencing growth due to the integration of wearable sensors and NFC technology, enabling contactless payment through a tap and pay function. This innovation offers several advantages, including faster transaction times and the elimination of the need to carry cash or cards. While the adoption of smart rings for contactless payment is still in its infancy, various industries are embracing this technology. Wearable devices, including smart rings, are equipped with third-party app support, allowing users to receive personalized recommendations based on their activity monitoring and lifestyle trends. Moreover, smart rings can be integrated with mobile apps and smart home systems, enhancing user experience and promoting customer loyalty.
- Firmware updates ensure the devices remain up-to-date with the latest features and security measures. The market dynamics are driven by the convenience and security of contactless payment processing, as well as the increasing popularity of wearable technology. Regulation and standards play a crucial role in the market's growth, ensuring the security and interoperability of these devices. In conclusion, the integration of NFC technology and contactless payment processing in smart rings is revolutionizing the way we make transactions, offering a seamless and immersive user experience.
What challenges does the Smart Rings Industry face during its growth?
- The emergence of competing alternatives poses a significant challenge to the expansion of the market.
- Smart rings, an alternative to smartwatches, offer similar functionalities such as sleep monitoring, heart rate tracking, and fitness tracking in a more discreet and stylish form factor. With extended battery life, these rings cater to a tech-savvy and fashion-conscious audience. Intellectual property protection and compatibility with various devices are essential considerations for market participants. The market is gaining traction due to consumer adoption and the integration of advanced features like security and retail sales. Strategic partnerships and collaborations between companies are crucial for customer acquisition and the development of new technologies.
- Distribution channels and compatibility standards play a significant role in market expansion. Security features, including biometric authentication and data encryption, are essential for user privacy and data protection. Retail sales and collaborations with major retailers contribute to market growth. With continuous innovation and advancements, smart rings are expected to become an integral part of everyday life.
Exclusive Customer Landscape
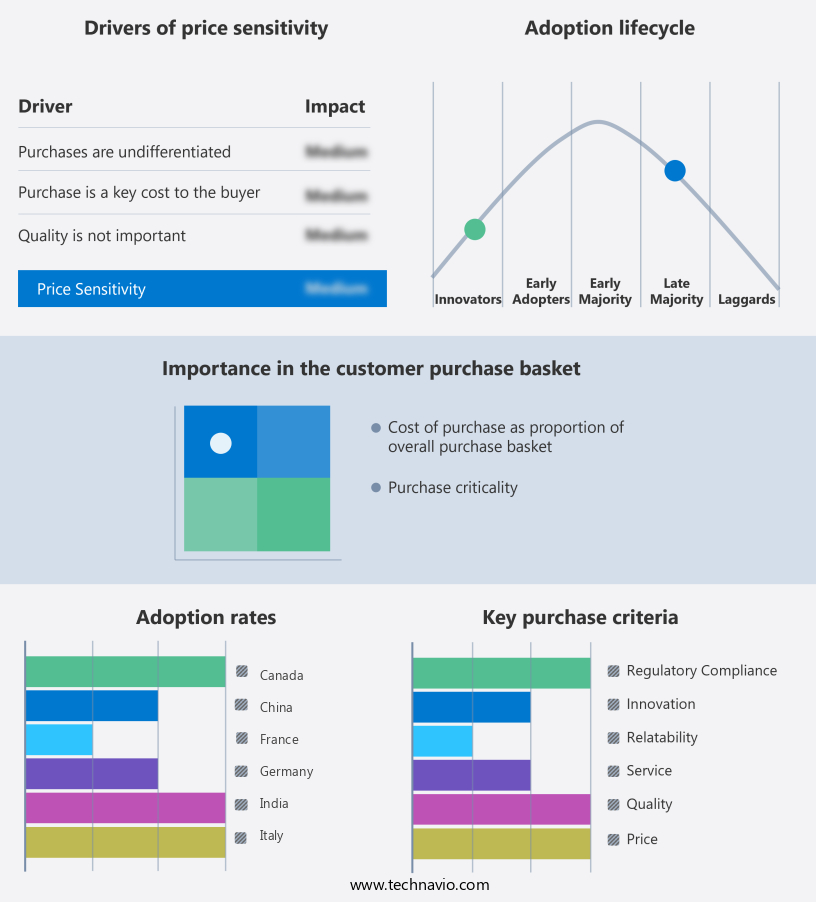
The smart rings market forecasting report includes the adoption lifecycle of the market, covering from the innovator's stage to the laggard's stage. It focuses on adoption rates in different regions based on penetration. Furthermore, the smart rings market report also includes key purchase criteria and drivers of price sensitivity to help companies evaluate and develop their market growth analysis strategies.
Customer Landscape
Key Companies & Market Insights
Companies are implementing various strategies, such as strategic alliances, smart rings market forecast, partnerships, mergers and acquisitions, geographical expansion, and product/service launches, to enhance their presence in the industry.
Circular - This company specializes in innovative wearable technology, introducing smart rings like the Helios model.
The industry research and growth report includes detailed analyses of the competitive landscape of the market and information about key companies, including:
- Circular
- Contecto
- E SENSES
- Fujitsu Ltd.
- Guangdong Jiu Zhi Technology Co.Ltd
- Haltian Oy
- iQibla LLC
- Jakcom Technology Co. Ltd.
- MTG Co. Ltd.
- Nimb Inc.
- Nuanic Oy
- Origami Group Ltd.
- Oura Health Oy
- Rajmall Inventives Pvt. Ltd.
- Ringly Inc.
- SLEEPON
- Smart Siren Technology Inc.
- TheTouch X s.r.o.
- Tokenize Inc.
- Ultrahuman Healthcare Pvt Ltd
Qualitative and quantitative analysis of companies has been conducted to help clients understand the wider business environment as well as the strengths and weaknesses of key industry players. Data is qualitatively analyzed to categorize companies as pure play, category-focused, industry-focused, and diversified; it is quantitatively analyzed to categorize companies as dominant, leading, strong, tentative, and weak.
Recent Development and News in Smart Rings Market
- In February 2024, Apple Inc. unveiled the Apple Watch Series 8 with a new feature, the Body Temperature Sensor, transforming it into a potential smart ring competitor. This development signifies a significant shift in the wearable technology landscape, blurring the lines between smart rings and smartwatches (Apple Press Info).
- In March 2025, Google and Samsung announced a strategic partnership to integrate Google's Fitbit health data platform into Samsung Health. This collaboration could pave the way for potential smart ring integrations, expanding the reach of health monitoring features beyond traditional wearables (Samsung Newsroom).
- In May 2024, Oura Health, a leading smart ring manufacturer, secured a USD 110 million funding round, fueling its growth and innovation in the health and wellness sector. This investment underscores the increasing investor interest in smart rings as a valuable health and wellness tool (Oura Health Press Release).
Research Analyst Overview
- The market is experiencing significant advancements, integrating various features to enhance the user experience. Voice assistants enable hands-free interaction, while personalized alerts keep users informed of important notifications. Sensors such as proximity, ambient light, and accelerometers monitor the environment and user activity. Data security is a priority, with virtual assistant integration ensuring biometric data protection through cloud storage. Fall detection, calendar reminders, and media controls offer convenience, while electrocardiogram (ECG) and skin temperature monitoring provide health insights. Haptic feedback and gesture control add a touch of sophistication.
- Voice control simplifies usage, and features like emergency SOS, location services, and blood oxygen monitoring offer peace of mind. Data visualization tools help users understand their health and activity trends, and rewards programs incentivize healthy habits. With virtual assistant integration, digital compass, stress monitoring, text messaging, social media notifications, and email notifications, smart rings are transforming daily life.
Dive into Technavio's robust research methodology, blending expert interviews, extensive data synthesis, and validated models for unparalleled Smart Rings Market insights. See full methodology.
|
Market Scope |
|
|
Report Coverage |
Details |
|
Page number |
224 |
|
Base year |
2024 |
|
Historic period |
2019-2023 |
|
Forecast period |
2025-2029 |
|
Growth momentum & CAGR |
Accelerate at a CAGR of 36.8% |
|
Market growth 2025-2029 |
USD 117.89 thousand |
|
Market structure |
Fragmented |
|
YoY growth 2024-2025(%) |
26.0 |
|
Key countries |
US, Canada, UK, Germany, France, Italy, The Netherlands, China, India, and Japan |
|
Competitive landscape |
Leading Companies, Market Positioning of Companies, Competitive Strategies, and Industry Risks |
What are the Key Data Covered in this Smart Rings Market Research and Growth Report?
- CAGR of the Smart Rings industry during the forecast period
- Detailed information on factors that will drive the growth and forecasting between 2025 and 2029
- Precise estimation of the size of the market and its contribution of the industry in focus to the parent market
- Accurate predictions about upcoming growth and trends and changes in consumer behaviour
- Growth of the market across North America, Europe, APAC, Middle East and Africa, and South America
- Thorough analysis of the market's competitive landscape and detailed information about companies
- Comprehensive analysis of factors that will challenge the smart rings market growth of industry companies
We can help! Our analysts can customize this smart rings market research report to meet your requirements.
 RIA -
RIA - 
