Smart TV Sticks Market Analysis, Size, and Forecast 2025-2029: North America (US and Canada), Europe (France, Germany, Italy, UK), APAC (China, India, Japan, South Korea), South America (Brazil), and Middle East and Africa (UAE)

Smart TV Sticks Market Analysis, Size, and Forecast 2025-2029:
North America (US and Canada), Europe (France, Germany, Italy, UK), APAC (China, India, Japan, South Korea), South America (Brazil), and Middle East and Africa (UAE)

Published: Mar 2025 243 Pages SKU: IRTNTR72438

Market Overview at a Glance

$962.7 Mn
Market Opportunity
9%
CAGR
8.0
YoY growth 2024-2025(%)

Smart TV Sticks Market Size 2025-2029

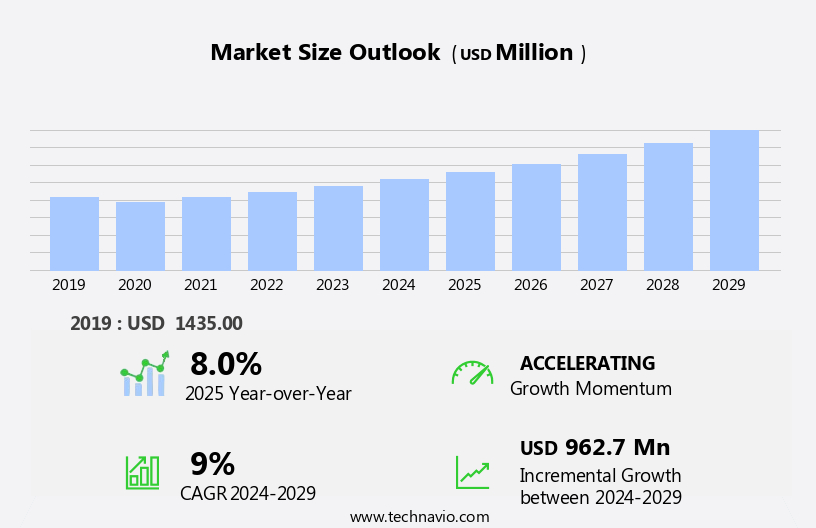
The smart tv sticks market size is forecast to increase by USD 962.7 million at a CAGR of 9% between 2024 and 2029.

  • The market is experiencing significant growth, driven by the expanding smart home ecosystem and the increasing penetration of smart TVs worldwide. With the rise of IoT technology and the integration of voice assistants into daily life, the demand for convenient and affordable streaming solutions has d. The market is further fueled by the increasing use of mobile electronic devices, enabling seamless content streaming between devices. However, challenges such as privacy concerns, intense competition, and the need for continuous innovation to keep up with consumer demands persist.
  • Companies seeking to capitalize on this market opportunity must focus on developing user-friendly interfaces, ensuring compatibility with various devices and platforms, and addressing privacy concerns through security measures. By staying abreast of market trends and consumer preferences, players can effectively navigate challenges and establish a strong market presence.

What will be the Size of the Smart TV Sticks Market during the forecast period?

Smart TV Sticks Market Size

 Request Free Sample

  • The smart TV stick market in the US is experiencing significant growth as consumers seek cost-effective solutions to access online content on their standard televisions. These compact devices enable users to transform their regular TVs into smart televisions, granting access to multiple apps, online streaming channels, and web information. The market's expansion is driven by increasing consumer preferences for seamless streaming of media content, including live sporting events and voice control capabilities.
  • As leading brands continue to innovate and improve the user experience, the smart TV stick market is poised for continued growth in the US, offering viewers an affordable and convenient alternative to traditional smart TVs.

How is this Smart TV Sticks Industry segmented?

The smart tv sticks industry research report provides comprehensive data (region-wise segment analysis), with forecasts and estimates in "USD million" for the period 2025-2029, as well as historical data from 2019-2023 for the following segments.

  • Type
    • Non-4K
    • 4K and above
    • 1080p and below
    • 4K
    • 8K
    • HDR Support
  • Distribution Channel
    • Offline
    • Online
    • Direct-to-Consumer
    • Subscription Bundles
  • Connectivity
    • Wi-Fi
    • Bluetooth
  • OS
    • Android TV OS
    • Roku OS
    • Amazon fire TV OS
    • Linux-based OS
    • Google TV
  • Geography
    • North America
      • US
      • Canada
    • Europe
      • France
      • Germany
      • Italy
      • UK
    • APAC
      • China
      • India
      • Japan
      • South Korea
    • South America
      • Brazil
    • Middle East and Africa
      • UAE

By Type Insights

The non-4k segment is estimated to witness significant growth during the forecast period.

Non-4K smart TV sticks remain popular choices for American homes due to their cost-effectiveness and wide content reach. These devices offer high dynamic range (HDR) content, which enhances the viewing experience. The lower cost of non-4K TV sticks compared to their 4K counterparts drives demand. CloudWalker's HALFTICKET TV Smart Stick, for instance, offers 8GB internal storage, expandable up to 32GB, enabling users to search for online content on their TVs. Voice control is another attractive feature, allowing users to access online content hands-free. Improved performance, powerful speakers, and bundling options further add value. With the rise of connected homes, live streaming services, and high-definition content, smart TV sticks have become essential streaming gadgets for internet users.

Consumers prefer these CTV-focused devices for their versatility, seamless streaming, and user-friendly interfaces. Strategic alliances with leading brands, improved performance, and advanced features cater to consumer preferences. E-commerce platforms offer various bundle packages, making it convenient for users to purchase these devices. The entertainment industry's technological developments cater to the fast-paced lifestyle, providing viewers with enhanced viewing experiences and entertainment options on official websites, mobile devices, and even offline.

Smart TV Sticks Market Size

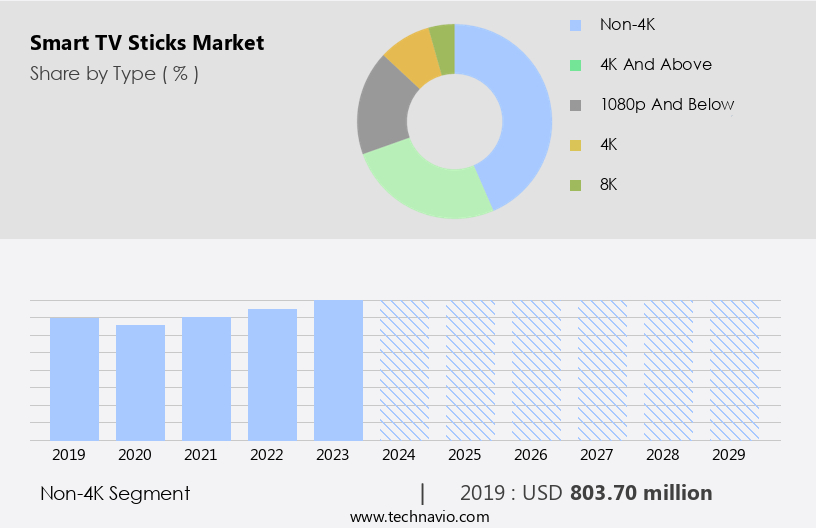
Get a glance at the market report of share of various segments Request Free Sample

The Non-4K segment was valued at USD 803.70 million in 2019 and showed a gradual increase during the forecast period.

Regional Analysis

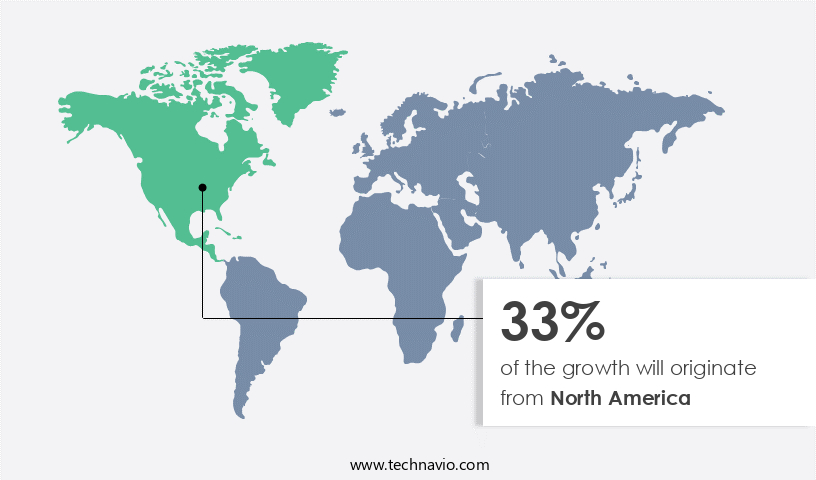
North America is estimated to contribute 33% to the growth of the global market during the forecast period.Technavio's analysts have elaborately explained the regional trends and drivers that shape the market during the forecast period.

Smart TV Sticks Market Share by Geography

For more insights on the market size of various regions, Request Free Sample

The North American market for smart TV sticks is experiencing significant growth due to the region's high online content consumption and technologically advanced entertainment sector. With popular web series, movies, and animated shows readily accessible through digital content providers, the demand for these streaming gadgets is increasing. Furthermore, strategic alliances and improved performance features, such as voice control and powerful speakers, are key factors driving the market. Consumers in American homes are increasingly seeking cost-effective solutions for accessing their favorite content, including music, TV shows, and movies, on their big displays. Smart TV sticks offer versatility, seamless integration with multiple apps, and compatibility with various channels, making them a popular choice for internet users.

Additionally, the e-commerce ecosystem and online retailers are offering bundling options and post-purchase support experiences to enhance the consumer experience. The market is expected to continue growing as technological developments cater to the fast-paced lifestyle of consumers, providing enhanced viewing experiences and entertainment options on both standard TVs and connected homes.

Market Dynamics

Our researchers analyzed the data with 2024 as the base year, along with the key drivers, trends, and challenges. A holistic analysis of drivers will help companies refine their marketing strategies to gain a competitive advantage.

What are the key market drivers leading to the rise in the adoption of Smart TV Sticks Industry?

  • Growing smart home ecosystem is the key driver of the market. 
  • Smart TV sticks have emerged as integral components of modern smart home ecosystems, enabling users to manage their TV and streaming experiences through voice commands and automation routines. The integration of these devices with other smart home technologies, such as smart speakers, displays, and other connected devices, fosters seamless interoperability and enhances the overall user experience. This interconnectivity allows users to control their smart TV sticks alongside other smart home devices via unified control interfaces offered by virtual assistants like Amazon Alexa, Google Assistant, and Apple Siri.
  • As a result, users can effortlessly adjust lighting, temperature, and other home settings while watching TV, thereby enhancing convenience and accessibility.

What are the market trends shaping the Smart TV Sticks Industry?

  • Increasing penetration of smart TVs worldwide is the upcoming market trend. 
  • The expanding adoption of smart TVs is projected to negatively impact the demand for smart TV sticks. Smart TVs, equipped with built-in capabilities to stream applications like Netflix and Amazon Prime, render smart TV sticks obsolete as they only stream content from local networks or the internet to the TV. The proliferation of smart technologies globally fuels the growth of the smart TV market.
  • With advanced consumer electronics and the increasing popularity of smart TVs, the need for separate devices like smart TV sticks may diminish during the forecast period.

What challenges does the Smart TV Sticks Industry face during its growth?

  • Rising use of mobile electronic devices is a key challenge affecting the industry growth. 
  • The global market for smart TV sticks has been experiencing notable influences from the widespread adoption of portable electronic devices such as smartphones, tablets, and laptops. With increasing economic growth, rising literacy rates, and escalating purchasing power in developing regions like APAC, MEA, and South America, the demand for these multimedia devices has d. This trend is expected to impact the demand for traditional TVs negatively, potentially hindering the growth of the market.
  • Despite this challenge, the market continues to exhibit significant potential due to the convenience and affordability of smart TV sticks as an alternative to purchasing a new smart TV.

Exclusive Customer Landscape

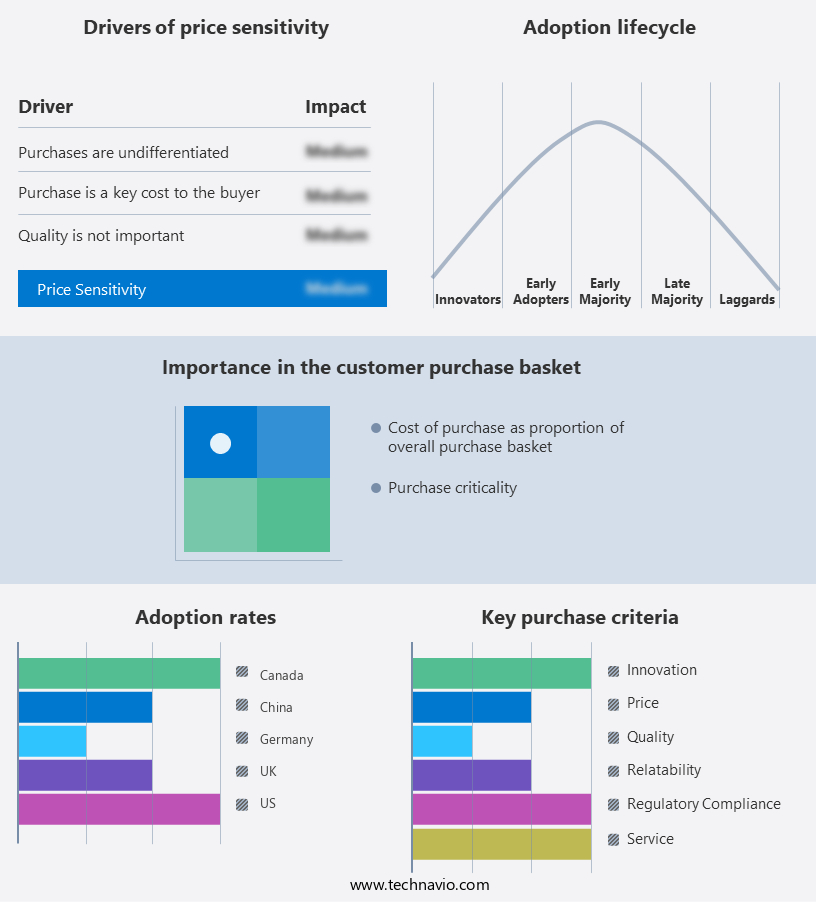
The smart tv sticks market forecasting report includes the adoption lifecycle of the market, covering from the innovator's stage to the laggard's stage. It focuses on adoption rates in different regions based on penetration. Furthermore, the smart tv sticks market report also includes key purchase criteria and drivers of price sensitivity to help companies evaluate and develop their market growth analysis strategies.

Smart TV Sticks Market Share by Geography

 Customer Landscape

Key Companies & Market Insights

Companies are implementing various strategies, such as strategic alliances, smart tv sticks market forecast, partnerships, mergers and acquisitions, geographical expansion, and product/service launches, to enhance their presence in the industry.

Actions Microelectronics Co. Ltd. (Taiwan) - The company provides smart TV solutions through devices like the EZCast Dongle, compatible with Android, iOS, Windows, Mac, and Chrome OS systems. This innovative technology enables seamless streaming and mirroring of content from various devices to a larger screen, enhancing user experience.

The industry research and growth report includes detailed analyses of the competitive landscape of the market and information about key companies, including:

  • Actions Microelectronics Co. Ltd. (Taiwan)
  • Airtame (Denmark)
  • Amazon.com Inc. (United States)
  • Apple Inc. (United States)
  • ASUSTeK Computer Inc. (Taiwan)
  • Bharti Airtel Ltd. (India)
  • CloudWalker Streaming Technologies Pvt. Ltd. (India)
  • Dish TV India Ltd. (India)
  • Geniatech Inc. (China)
  • Google LLC (United States)
  • Matricom (United States)
  • MECOOL (China)
  • NVIDIA Corp. (United States)
  • Roku Inc. (United States)
  • Shenzhen Rikomagic Tech Corp. Ltd. (China)
  • Shenzhen Tomato Technology Co. Ltd. (China)
  • Topleo Technology Ltd. (China)
  • Xiaomi Inc. (China)

Qualitative and quantitative analysis of companies has been conducted to help clients understand the wider business environment as well as the strengths and weaknesses of key industry players. Data is qualitatively analyzed to categorize companies as pure play, category-focused, industry-focused, and diversified; it is quantitatively analyzed to categorize companies as dominant, leading, strong, tentative, and weak.

Research Analyst Overview

The smart TV stick market has witnessed significant growth in recent years, driven by the increasing demand for cost-effective solutions that enable users to access online content on their television screens. These devices, also known as streaming gadgets or CTV-focused devices, offer voice control functionality, allowing viewers to easily navigate and search for their favorite content. The user experience is a key factor in the adoption of smart TV sticks. High-definition content and improved performance are essential features that consumers look for in these devices. Powerful speakers and seamless integration with home entertainment systems are also important considerations.

Strategic alliances between streaming services and smart TV stick manufacturers have played a crucial role in the growth of this market. These partnerships provide users with access to a wide range of apps and channels, enhancing the overall entertainment experience. The proliferation of live streaming services and the availability of a vast amount of web information have led to a shift in consumer preferences towards OTT (over-the-top) viewing. Smart TV sticks offer a convenient and portable solution for consumers who want to access their favorite content on the go. The technological developments in the field of smart TV sticks have been rapid, with devices offering advanced features such as compatibility with multiple apps, user-friendly interfaces, and seamless integration with other smart home devices.

The entertainment industry has been significantly impacted by the rise of smart TV sticks. Consumers now have access to a vast array of entertainment options, including movies, TV shows, web series, and live sporting events, all at their fingertips. The convenience and versatility of smart TV sticks have made them a popular choice among internet users, particularly those who have broadband connections. These devices offer a post-purchase support experience that is unmatched by traditional cable services. The e-commerce ecosystem has also played a role in the growth of the smart TV stick market. Online retailers offer a wide range of devices at competitive prices, making it easy for consumers to purchase and have them delivered to their doorstep.

The compact designs of smart TV sticks make them an attractive option for consumers who want to upgrade their television viewing experience without having to invest in a new TV set. The absence of advertisement interruptions is another advantage that these devices offer over traditional TV. The entertainment experience offered by smart TV sticks is not limited to just streaming movies and TV shows. Many devices offer cloud gaming services, enabling users to play games on their big displays. The future of the smart TV stick market looks promising, with technological advancements such as 8k resolution and advanced voice assistants expected to drive growth.

Consumer preferences for enhanced viewing experiences and the fast-paced lifestyle of modern consumers are also expected to fuel demand for these devices. The smart TV stick market is a dynamic and rapidly growing industry that offers consumers a cost-effective and convenient solution for accessing online content on their television screens. The devices offer advanced features, seamless integration, and a user-friendly experience that is unmatched by traditional TV. The future of this market looks bright, with technological advancements and changing consumer preferences expected to drive growth.

Market Scope

Report Coverage

Details

Page number

243

Base year

2024

Historic period

2019-2023

Forecast period

2025-2029

Growth momentum & CAGR

Accelerate at a CAGR of 9%

Market growth 2025-2029

USD 962.7 million

Market structure

Fragmented

YoY growth 2024-2025(%)

8.0

Key countries

US, Canada, Germany, UK, China, France, India, Japan, Italy, South Korea, UAE, and Brazil

Competitive landscape

Leading Companies, Market Positioning of Companies, Competitive Strategies, and Industry Risks

Request Free Sample

What are the Key Data Covered in this Smart TV Sticks Market Research and Growth Report?

  • CAGR of the Smart TV Sticks industry during the forecast period
  • Detailed information on factors that will drive the growth and forecasting between 2025 and 2029
  • Precise estimation of the size of the market and its contribution of the industry in focus to the parent market
  • Accurate predictions about upcoming growth and trends and changes in consumer behaviour
  • Growth of the market across North America, Europe, APAC, South America, and Middle East and Africa
  • Thorough analysis of the market's competitive landscape and detailed information about companies
  • Comprehensive analysis of factors that will challenge the smart tv sticks market growth of industry companies

We can help! Our analysts can customize this smart tv sticks market research report to meet your requirements.

Get in touch

1 Executive Summary

  • 1.1 Market overview
    • Executive Summary - Chart on Market Overview
    • Executive Summary - Data Table on Market Overview
    • Executive Summary - Chart on Global Market Characteristics
    • Executive Summary - Chart on Market by Geography
    • Executive Summary - Chart on Market Segmentation by Type
    • Executive Summary - Chart on Market Segmentation by Distribution Channel
    • Executive Summary - Chart on Market Segmentation by Connectivity
    • Executive Summary - Chart on Market Segmentation by OS
    • Executive Summary - Chart on Incremental Growth
    • Executive Summary - Data Table on Incremental Growth
    • Executive Summary - Chart on Company Market Positioning

2 Technavio Analysis

  • 2.1 Analysis of price sensitivity, lifecycle, customer purchase basket, adoption rates, and purchase criteria
    • Analysis of price sensitivity, lifecycle, customer purchase basket, adoption rates, and purchase criteria
  • 2.2 Criticality of inputs and Factors of differentiation
    • Overview on criticality of inputs and factors of differentiation
  • 2.3 Factors of disruption
    • Overview on factors of disruption
  • 2.4 Impact of drivers and challenges
    • Impact of drivers and challenges in 2024 and 2029

3 Market Landscape

  • 3.1 Market ecosystem
    • Parent Market
    • Data Table on - Parent Market
  • 3.2 Market characteristics
    • Market characteristics analysis
  • 3.3 Value chain analysis
    • Value chain analysis

4 Market Sizing

  • 4.1 Market definition
    • Offerings of companies included in the market definition
  • 4.2 Market segment analysis
    • Market segments
  • 4.3 Market size 2024
    • 4.4 Market outlook: Forecast for 2024-2029
      • Chart on Global - Market size and forecast 2024-2029 ($ million)
      • Data Table on Global - Market size and forecast 2024-2029 ($ million)
      • Chart on Global Market: Year-over-year growth 2024-2029 (%)
      • Data Table on Global Market: Year-over-year growth 2024-2029 (%)

    5 Historic Market Size

    • 5.1 Global Smart TV Sticks Market 2019 - 2023
      • Historic Market Size - Data Table on Global Smart TV Sticks Market 2019 - 2023 ($ million)
    • 5.2 Type segment analysis 2019 - 2023
      • Historic Market Size - Type Segment 2019 - 2023 ($ million)
    • 5.3 Distribution Channel segment analysis 2019 - 2023
      • Historic Market Size - Distribution Channel Segment 2019 - 2023 ($ million)
    • 5.4 Connectivity segment analysis 2019 - 2023
      • Historic Market Size - Connectivity Segment 2019 - 2023 ($ million)
    • 5.5 OS segment analysis 2019 - 2023
      • Historic Market Size - OS Segment 2019 - 2023 ($ million)
    • 5.6 Geography segment analysis 2019 - 2023
      • Historic Market Size - Geography Segment 2019 - 2023 ($ million)
    • 5.7 Country segment analysis 2019 - 2023
      • Historic Market Size - Country Segment 2019 - 2023 ($ million)

    6 Qualitative Analysis

    • 6.1 Impact of AI on Global Smart TV Sticks Market

      7 Five Forces Analysis

      • 7.1 Five forces summary
        • Five forces analysis - Comparison between 2024 and 2029
      • 7.2 Bargaining power of buyers
        • Bargaining power of buyers - Impact of key factors 2024 and 2029
      • 7.3 Bargaining power of suppliers
        • Bargaining power of suppliers - Impact of key factors in 2024 and 2029
      • 7.4 Threat of new entrants
        • Threat of new entrants - Impact of key factors in 2024 and 2029
      • 7.5 Threat of substitutes
        • Threat of substitutes - Impact of key factors in 2024 and 2029
      • 7.6 Threat of rivalry
        • Threat of rivalry - Impact of key factors in 2024 and 2029
      • 7.7 Market condition
        • Chart on Market condition - Five forces 2024 and 2029

      8 Market Segmentation by Type

      • 8.1 Market segments
        • Chart on Type - Market share (2024-2029) (%)
        • Data Table on Type - Market share (2024-2029) (%)
      • 8.2 Comparison by Type
        • Chart on Comparison by Type
        • Data Table on Comparison by Type
      • 8.3 Non-4K - Market size and forecast (2024-2029)
        • Chart on Non-4K - Market size and forecast (2024-2029) ($ million)
        • Data Table on Non-4K - Market size and forecast (2024-2029) ($ million)
        • Chart on Non-4K - Year-over-year growth (2024-2029) (%)
        • Data Table on Non-4K - Year-over-year growth (2024-2029) (%)
      • 4K and above - Market size and forecast (2024-2029)
        • Chart on 4K and above - Market size and forecast (2024-2029) ($ million)
        • Data Table on 4K and above - Market size and forecast (2024-2029) ($ million)
        • Chart on 4K and above - Year-over-year growth (2024-2029) (%)
        • Data Table on 4K and above - Year-over-year growth (2024-2029) (%)
      • 1080p and below - Market size and forecast (2024-2029)
        • Chart on 1080p and below - Market size and forecast (2024-2029) ($ million)
        • Data Table on 1080p and below - Market size and forecast (2024-2029) ($ million)
        • Chart on 1080p and below - Year-over-year growth (2024-2029) (%)
        • Data Table on 1080p and below - Year-over-year growth (2024-2029) (%)
      • 4K - Market size and forecast (2024-2029)
        • Chart on 4K - Market size and forecast (2024-2029) ($ million)
        • Data Table on 4K - Market size and forecast (2024-2029) ($ million)
        • Chart on 4K - Year-over-year growth (2024-2029) (%)
        • Data Table on 4K - Year-over-year growth (2024-2029) (%)
      • 8K - Market size and forecast (2024-2029)
        • Chart on 8K - Market size and forecast (2024-2029) ($ million)
        • Data Table on 8K - Market size and forecast (2024-2029) ($ million)
        • Chart on 8K - Year-over-year growth (2024-2029) (%)
        • Data Table on 8K - Year-over-year growth (2024-2029) (%)
      • 8.8 HDR Support - Market size and forecast (2024-2029)
        • Chart on HDR Support - Market size and forecast (2024-2029) ($ million)
        • Data Table on HDR Support - Market size and forecast (2024-2029) ($ million)
        • Chart on HDR Support - Year-over-year growth (2024-2029) (%)
        • Data Table on HDR Support - Year-over-year growth (2024-2029) (%)
      • 8.9 Market opportunity by Type
        • Market opportunity by Type ($ million)
        • Data Table on Market opportunity by Type ($ million)

      9 Market Segmentation by Distribution Channel

      • 9.1 Market segments
        • Chart on Distribution Channel - Market share (2024-2029) (%)
        • Data Table on Distribution Channel - Market share (2024-2029) (%)
      • 9.2 Comparison by Distribution Channel
        • Chart on Comparison by Distribution Channel
        • Data Table on Comparison by Distribution Channel
      • 9.3 Offline - Market size and forecast (2024-2029)
        • Chart on Offline - Market size and forecast (2024-2029) ($ million)
        • Data Table on Offline - Market size and forecast (2024-2029) ($ million)
        • Chart on Offline - Year-over-year growth (2024-2029) (%)
        • Data Table on Offline - Year-over-year growth (2024-2029) (%)
      • 9.4 Online - Market size and forecast (2024-2029)
        • Chart on Online - Market size and forecast (2024-2029) ($ million)
        • Data Table on Online - Market size and forecast (2024-2029) ($ million)
        • Chart on Online - Year-over-year growth (2024-2029) (%)
        • Data Table on Online - Year-over-year growth (2024-2029) (%)
      • 9.5 Direct-to-Consumer - Market size and forecast (2024-2029)
        • Chart on Direct-to-Consumer - Market size and forecast (2024-2029) ($ million)
        • Data Table on Direct-to-Consumer - Market size and forecast (2024-2029) ($ million)
        • Chart on Direct-to-Consumer - Year-over-year growth (2024-2029) (%)
        • Data Table on Direct-to-Consumer - Year-over-year growth (2024-2029) (%)
      • 9.6 Subscription Bundles - Market size and forecast (2024-2029)
        • Chart on Subscription Bundles - Market size and forecast (2024-2029) ($ million)
        • Data Table on Subscription Bundles - Market size and forecast (2024-2029) ($ million)
        • Chart on Subscription Bundles - Year-over-year growth (2024-2029) (%)
        • Data Table on Subscription Bundles - Year-over-year growth (2024-2029) (%)
      • 9.7 Market opportunity by Distribution Channel
        • Market opportunity by Distribution Channel ($ million)
        • Data Table on Market opportunity by Distribution Channel ($ million)

      10 Market Segmentation by Connectivity

      • 10.1 Market segments
        • Chart on Connectivity - Market share (2024-2029) (%)
        • Data Table on Connectivity - Market share (2024-2029) (%)
      • 10.2 Comparison by Connectivity
        • Chart on Comparison by Connectivity
        • Data Table on Comparison by Connectivity
      • 10.3 Wi-Fi - Market size and forecast (2024-2029)
        • Chart on Wi-Fi - Market size and forecast (2024-2029) ($ million)
        • Data Table on Wi-Fi - Market size and forecast (2024-2029) ($ million)
        • Chart on Wi-Fi - Year-over-year growth (2024-2029) (%)
        • Data Table on Wi-Fi - Year-over-year growth (2024-2029) (%)
      • 10.4 Bluetooth - Market size and forecast (2024-2029)
        • Chart on Bluetooth - Market size and forecast (2024-2029) ($ million)
        • Data Table on Bluetooth - Market size and forecast (2024-2029) ($ million)
        • Chart on Bluetooth - Year-over-year growth (2024-2029) (%)
        • Data Table on Bluetooth - Year-over-year growth (2024-2029) (%)
      • 10.5 Market opportunity by Connectivity
        • Market opportunity by Connectivity ($ million)
        • Data Table on Market opportunity by Connectivity ($ million)

      11 Market Segmentation by OS

      • 11.1 Market segments
        • Chart on OS - Market share (2024-2029) (%)
        • Data Table on OS - Market share (2024-2029) (%)
      • 11.2 Comparison by OS
        • Chart on Comparison by OS
        • Data Table on Comparison by OS
      • 11.3 Android TV OS - Market size and forecast (2024-2029)
        • Chart on Android TV OS - Market size and forecast (2024-2029) ($ million)
        • Data Table on Android TV OS - Market size and forecast (2024-2029) ($ million)
        • Chart on Android TV OS - Year-over-year growth (2024-2029) (%)
        • Data Table on Android TV OS - Year-over-year growth (2024-2029) (%)
      • 11.4 Roku OS - Market size and forecast (2024-2029)
        • Chart on Roku OS - Market size and forecast (2024-2029) ($ million)
        • Data Table on Roku OS - Market size and forecast (2024-2029) ($ million)
        • Chart on Roku OS - Year-over-year growth (2024-2029) (%)
        • Data Table on Roku OS - Year-over-year growth (2024-2029) (%)
      • 11.5 Amazon fire TV OS - Market size and forecast (2024-2029)
        • Chart on Amazon fire TV OS - Market size and forecast (2024-2029) ($ million)
        • Data Table on Amazon fire TV OS - Market size and forecast (2024-2029) ($ million)
        • Chart on Amazon fire TV OS - Year-over-year growth (2024-2029) (%)
        • Data Table on Amazon fire TV OS - Year-over-year growth (2024-2029) (%)
      • 11.6 Linux-based OS - Market size and forecast (2024-2029)
        • Chart on Linux-based OS - Market size and forecast (2024-2029) ($ million)
        • Data Table on Linux-based OS - Market size and forecast (2024-2029) ($ million)
        • Chart on Linux-based OS - Year-over-year growth (2024-2029) (%)
        • Data Table on Linux-based OS - Year-over-year growth (2024-2029) (%)
      • 11.7 Google TV - Market size and forecast (2024-2029)
        • Chart on Google TV - Market size and forecast (2024-2029) ($ million)
        • Data Table on Google TV - Market size and forecast (2024-2029) ($ million)
        • Chart on Google TV - Year-over-year growth (2024-2029) (%)
        • Data Table on Google TV - Year-over-year growth (2024-2029) (%)
      • 11.8 Market opportunity by OS
        • Market opportunity by OS ($ million)
        • Data Table on Market opportunity by OS ($ million)

      12 Customer Landscape

      • 12.1 Customer landscape overview
        • Analysis of price sensitivity, lifecycle, customer purchase basket, adoption rates, and purchase criteria

      13 Geographic Landscape

      • 13.1 Geographic segmentation
        • Chart on Market share by geography 2024-2029 (%)
        • Data Table on Market share by geography 2024-2029 (%)
      • 13.2 Geographic comparison
        • Chart on Geographic comparison
        • Data Table on Geographic comparison
      • 13.3 North America - Market size and forecast 2024-2029
        • Chart on North America - Market size and forecast 2024-2029 ($ million)
        • Data Table on North America - Market size and forecast 2024-2029 ($ million)
        • Chart on North America - Year-over-year growth 2024-2029 (%)
        • Data Table on North America - Year-over-year growth 2024-2029 (%)
      • 13.4 Europe - Market size and forecast 2024-2029
        • Chart on Europe - Market size and forecast 2024-2029 ($ million)
        • Data Table on Europe - Market size and forecast 2024-2029 ($ million)
        • Chart on Europe - Year-over-year growth 2024-2029 (%)
        • Data Table on Europe - Year-over-year growth 2024-2029 (%)
      • 13.5 APAC - Market size and forecast 2024-2029
        • Chart on APAC - Market size and forecast 2024-2029 ($ million)
        • Data Table on APAC - Market size and forecast 2024-2029 ($ million)
        • Chart on APAC - Year-over-year growth 2024-2029 (%)
        • Data Table on APAC - Year-over-year growth 2024-2029 (%)
      • 13.6 South America - Market size and forecast 2024-2029
        • Chart on South America - Market size and forecast 2024-2029 ($ million)
        • Data Table on South America - Market size and forecast 2024-2029 ($ million)
        • Chart on South America - Year-over-year growth 2024-2029 (%)
        • Data Table on South America - Year-over-year growth 2024-2029 (%)
      • 13.7 Middle East and Africa - Market size and forecast 2024-2029
        • Chart on Middle East and Africa - Market size and forecast 2024-2029 ($ million)
        • Data Table on Middle East and Africa - Market size and forecast 2024-2029 ($ million)
        • Chart on Middle East and Africa - Year-over-year growth 2024-2029 (%)
        • Data Table on Middle East and Africa - Year-over-year growth 2024-2029 (%)
      • 13.8 US - Market size and forecast 2024-2029
        • Chart on US - Market size and forecast 2024-2029 ($ million)
        • Data Table on US - Market size and forecast 2024-2029 ($ million)
        • Chart on US - Year-over-year growth 2024-2029 (%)
        • Data Table on US - Year-over-year growth 2024-2029 (%)
      • 13.9 Canada - Market size and forecast 2024-2029
        • Chart on Canada - Market size and forecast 2024-2029 ($ million)
        • Data Table on Canada - Market size and forecast 2024-2029 ($ million)
        • Chart on Canada - Year-over-year growth 2024-2029 (%)
        • Data Table on Canada - Year-over-year growth 2024-2029 (%)
      • 13.10 Germany - Market size and forecast 2024-2029
        • Chart on Germany - Market size and forecast 2024-2029 ($ million)
        • Data Table on Germany - Market size and forecast 2024-2029 ($ million)
        • Chart on Germany - Year-over-year growth 2024-2029 (%)
        • Data Table on Germany - Year-over-year growth 2024-2029 (%)
      • 13.11 UK - Market size and forecast 2024-2029
        • Chart on UK - Market size and forecast 2024-2029 ($ million)
        • Data Table on UK - Market size and forecast 2024-2029 ($ million)
        • Chart on UK - Year-over-year growth 2024-2029 (%)
        • Data Table on UK - Year-over-year growth 2024-2029 (%)
      • 13.12 China - Market size and forecast 2024-2029
        • Chart on China - Market size and forecast 2024-2029 ($ million)
        • Data Table on China - Market size and forecast 2024-2029 ($ million)
        • Chart on China - Year-over-year growth 2024-2029 (%)
        • Data Table on China - Year-over-year growth 2024-2029 (%)
      • 13.13 Japan - Market size and forecast 2024-2029
        • Chart on Japan - Market size and forecast 2024-2029 ($ million)
        • Data Table on Japan - Market size and forecast 2024-2029 ($ million)
        • Chart on Japan - Year-over-year growth 2024-2029 (%)
        • Data Table on Japan - Year-over-year growth 2024-2029 (%)
      • 13.14 India - Market size and forecast 2024-2029
        • Chart on India - Market size and forecast 2024-2029 ($ million)
        • Data Table on India - Market size and forecast 2024-2029 ($ million)
        • Chart on India - Year-over-year growth 2024-2029 (%)
        • Data Table on India - Year-over-year growth 2024-2029 (%)
      • 13.15 France - Market size and forecast 2024-2029
        • Chart on France - Market size and forecast 2024-2029 ($ million)
        • Data Table on France - Market size and forecast 2024-2029 ($ million)
        • Chart on France - Year-over-year growth 2024-2029 (%)
        • Data Table on France - Year-over-year growth 2024-2029 (%)
      • 13.16 Italy - Market size and forecast 2024-2029
        • Chart on Italy - Market size and forecast 2024-2029 ($ million)
        • Data Table on Italy - Market size and forecast 2024-2029 ($ million)
        • Chart on Italy - Year-over-year growth 2024-2029 (%)
        • Data Table on Italy - Year-over-year growth 2024-2029 (%)
      • 13.17 South Korea - Market size and forecast 2024-2029
        • Chart on South Korea - Market size and forecast 2024-2029 ($ million)
        • Data Table on South Korea - Market size and forecast 2024-2029 ($ million)
        • Chart on South Korea - Year-over-year growth 2024-2029 (%)
        • Data Table on South Korea - Year-over-year growth 2024-2029 (%)
      • 13.18 Market opportunity by geography
        • Market opportunity by geography ($ million)
        • Data Tables on Market opportunity by geography ($ million)
      • 13.19 UAE - Market size and forecast (2024-2029)
        • Chart on UAE - Market size and forecast (2024-2029) ($ million)
        • Data Table on UAE - Market size and forecast (2024-2029) ($ million)
        • Chart on UAE - Year-over-year growth (2024-2029) (%)
        • Data Table on UAE - Year-over-year growth (2024-2029) (%)
      • 13.20 Brazil - Market size and forecast (2024-2029)
        • Chart on Brazil - Market size and forecast (2024-2029) ($ million)
        • Data Table on Brazil - Market size and forecast (2024-2029) ($ million)
        • Chart on Brazil - Year-over-year growth (2024-2029) (%)
        • Data Table on Brazil - Year-over-year growth (2024-2029) (%)
      • 13.21 Rest of World (ROW) - Market size and forecast (2024-2029)
        • Chart on Rest of World (ROW) - Market size and forecast (2024-2029) ($ million)
        • Data Table on Rest of World (ROW) - Market size and forecast (2024-2029) ($ million)
        • Chart on Rest of World (ROW) - Year-over-year growth (2024-2029) (%)
        • Data Table on Rest of World (ROW) - Year-over-year growth (2024-2029) (%)

      14 Drivers, Challenges, and Opportunity/Restraints

      • 14.1 Market drivers
        • 14.2 Market challenges
          • 14.3 Impact of drivers and challenges
            • Impact of drivers and challenges in 2024 and 2029
          • 14.4 Market opportunities/restraints

            15 Competitive Landscape

            • 15.1 Overview
              • 15.2 Competitive Landscape
                • Overview on criticality of inputs and factors of differentiation
              • 15.3 Landscape disruption
                • Overview on factors of disruption
              • 15.4 Industry risks
                • Impact of key risks on business

              16 Competitive Analysis

              • 16.1 Companies profiled
                • Companies covered
              • 16.2 Market positioning of companies
                • Matrix on companies position and classification
              • 16.3 Actions Microelectronics Co. Ltd. (Taiwan)
                • Actions Microelectronics Co. Ltd. (Taiwan) - Overview
                • Actions Microelectronics Co. Ltd. (Taiwan) - Product / Service
                • Actions Microelectronics Co. Ltd. (Taiwan) - Key offerings
              • 16.4 Airtame (Denmark)
                • Airtame (Denmark) - Overview
                • Airtame (Denmark) - Product / Service
                • Airtame (Denmark) - Key offerings
              • 16.5 Amazon.com Inc. (United States)
                • Amazon.com Inc. (United States) - Overview
                • Amazon.com Inc. (United States) - Product / Service
                • Amazon.com Inc. (United States) - Key offerings
              • 16.6 Apple Inc. (United States)
                • Apple Inc. (United States) - Overview
                • Apple Inc. (United States) - Product / Service
                • Apple Inc. (United States) - Key offerings
              • 16.7 ASUSTeK Computer Inc. (Taiwan)
                • ASUSTeK Computer Inc. (Taiwan) - Overview
                • ASUSTeK Computer Inc. (Taiwan) - Product / Service
                • ASUSTeK Computer Inc. (Taiwan) - Key offerings
              • 16.8 Bharti Airtel Ltd. (India)
                • Bharti Airtel Ltd. (India) - Overview
                • Bharti Airtel Ltd. (India) - Product / Service
                • Bharti Airtel Ltd. (India) - Key offerings
              • 16.9 CloudWalker Streaming Technologies Pvt. Ltd. (India)
                • CloudWalker Streaming Technologies Pvt. Ltd. (India) - Overview
                • CloudWalker Streaming Technologies Pvt. Ltd. (India) - Product / Service
                • CloudWalker Streaming Technologies Pvt. Ltd. (India) - Key offerings
              • 16.10 Dish TV India Ltd. (India)
                • Dish TV India Ltd. (India) - Overview
                • Dish TV India Ltd. (India) - Product / Service
                • Dish TV India Ltd. (India) - Key offerings
              • 16.11 Geniatech Inc. (China)
                • Geniatech Inc. (China) - Overview
                • Geniatech Inc. (China) - Product / Service
                • Geniatech Inc. (China) - Key offerings
              • 16.12 Google LLC (United States)
                • Google LLC (United States) - Overview
                • Google LLC (United States) - Product / Service
                • Google LLC (United States) - Key offerings
              • 16.13 Matricom (United States)
                • Matricom (United States) - Overview
                • Matricom (United States) - Product / Service
                • Matricom (United States) - Key offerings
              • 16.14 MECOOL (China)
                • MECOOL (China) - Overview
                • MECOOL (China) - Product / Service
                • MECOOL (China) - Key offerings
              • 16.15 NVIDIA Corp. (United States)
                • NVIDIA Corp. (United States) - Overview
                • NVIDIA Corp. (United States) - Product / Service
                • NVIDIA Corp. (United States) - Key offerings
              • 16.16 Roku Inc. (United States)
                • Roku Inc. (United States) - Overview
                • Roku Inc. (United States) - Product / Service
                • Roku Inc. (United States) - Key offerings
              • 16.17 Shenzhen Rikomagic Tech Corp. Ltd. (China)
                • Shenzhen Rikomagic Tech Corp. Ltd. (China) - Overview
                • Shenzhen Rikomagic Tech Corp. Ltd. (China) - Product / Service
                • Shenzhen Rikomagic Tech Corp. Ltd. (China) - Key offerings
              • 16.18 Shenzhen Tomato Technology Co. Ltd. (China)
                • Shenzhen Tomato Technology Co. Ltd. (China) - Overview
                • Shenzhen Tomato Technology Co. Ltd. (China) - Product / Service
                • Shenzhen Tomato Technology Co. Ltd. (China) - Key offerings
              • 16.19 Topleo Technology Ltd. (China)
                • Topleo Technology Ltd. (China) - Overview
                • Topleo Technology Ltd. (China) - Product / Service
                • Topleo Technology Ltd. (China) - Key offerings
              • 16.20 Xiaomi Inc. (China)
                • Xiaomi Inc. (China) - Overview
                • Xiaomi Inc. (China) - Product / Service
                • Xiaomi Inc. (China) - Key offerings
              • 16.21 Actions Microelectronics Co. Ltd.
                • Actions Microelectronics Co. Ltd. - Overview
                • Actions Microelectronics Co. Ltd. - Product / Service
                • Actions Microelectronics Co. Ltd. - Key offerings
              • 16.22 Airtame
                • Airtame - Overview
                • Airtame - Product / Service
                • Airtame - Key offerings
              • 16.23 Amazon.com Inc.
                • Amazon.com Inc. - Overview
                • Amazon.com Inc. - Product / Service
                • Amazon.com Inc. - Key offerings
              • 16.24 Apple Inc.
                • Apple Inc. - Overview
                • Apple Inc. - Product / Service
                • Apple Inc. - Key offerings
              • 16.25 ASUSTeK Computer Inc.
                • ASUSTeK Computer Inc. - Overview
                • ASUSTeK Computer Inc. - Product / Service
                • ASUSTeK Computer Inc. - Key offerings
              • 16.26 Bharti Airtel Ltd.
                • Bharti Airtel Ltd. - Overview
                • Bharti Airtel Ltd. - Product / Service
                • Bharti Airtel Ltd. - Key offerings
              • 16.27 CloudWalker Streaming Technologies Pvt. Ltd.
                • CloudWalker Streaming Technologies Pvt. Ltd. - Overview
                • CloudWalker Streaming Technologies Pvt. Ltd. - Product / Service
                • CloudWalker Streaming Technologies Pvt. Ltd. - Key offerings
              • 16.28 Dish TV India Ltd.
                • Dish TV India Ltd. - Overview
                • Dish TV India Ltd. - Product / Service
                • Dish TV India Ltd. - Key offerings
              • 16.29 Geniatech Inc.
                • Geniatech Inc. - Overview
                • Geniatech Inc. - Product / Service
                • Geniatech Inc. - Key offerings
              • 16.30 Google LLC
                • Google LLC - Overview
                • Google LLC - Product / Service
                • Google LLC - Key offerings
              • 16.31 Matricom
                • Matricom - Overview
                • Matricom - Product / Service
                • Matricom - Key offerings
              • 16.32 MECOOL
                • MECOOL - Overview
                • MECOOL - Product / Service
                • MECOOL - Key offerings
              • 16.33 NVIDIA Corp.
                • NVIDIA Corp. - Overview
                • NVIDIA Corp. - Product / Service
                • NVIDIA Corp. - Key offerings
              • 16.34 Roku Inc.
                • Roku Inc. - Overview
                • Roku Inc. - Product / Service
                • Roku Inc. - Key offerings
              • 16.35 Shenzhen Rikomagic Tech Corp. Ltd.
                • Shenzhen Rikomagic Tech Corp. Ltd. - Overview
                • Shenzhen Rikomagic Tech Corp. Ltd. - Product / Service
                • Shenzhen Rikomagic Tech Corp. Ltd. - Key offerings
              • 16.36 Shenzhen Tomato Technology Co. Ltd.
                • Shenzhen Tomato Technology Co. Ltd. - Overview
                • Shenzhen Tomato Technology Co. Ltd. - Product / Service
                • Shenzhen Tomato Technology Co. Ltd. - Key offerings
              • 16.37 Topleo Technology Ltd.
                • Topleo Technology Ltd. - Overview
                • Topleo Technology Ltd. - Product / Service
                • Topleo Technology Ltd. - Key offerings
              • 16.38 Xiaomi Inc.
                • Xiaomi Inc. - Overview
                • Xiaomi Inc. - Product / Service
                • Xiaomi Inc. - Key offerings

              17 Appendix

              • 17.1 Scope of the report
                • 17.2 Inclusions and exclusions checklist
                  • Inclusions checklist
                  • Exclusions checklist
                • 17.3 Currency conversion rates for US$
                  • Currency conversion rates for US$
                • 17.4 Research methodology
                  • Research methodology
                • 17.5 Data procurement
                  • Information sources
                • 17.6 Data validation
                  • Data validation
                • 17.7 Validation techniques employed for market sizing
                  • Validation techniques employed for market sizing
                • 17.8 Data synthesis
                  • Data synthesis
                • 17.9 360 degree market analysis
                  • 360 degree market analysis
                • 17.10 List of abbreviations
                  • List of abbreviations

                Research Methodology

                Technavio presents a detailed picture of the market by way of study, synthesis, and summation of data from multiple sources. The analysts have presented the various facets of the market with a particular focus on identifying the key industry influencers. The data thus presented is comprehensive, reliable, and the result of extensive research, both primary and secondary.

                INFORMATION SOURCES

                Primary sources

                • Manufacturers and suppliers
                • Channel partners
                • Industry experts
                • Strategic decision makers

                Secondary sources

                • Industry journals and periodicals
                • Government data
                • Financial reports of key industry players
                • Historical data
                • Press releases

                DATA ANALYSIS

                Data Synthesis

                • Collation of data
                • Estimation of key figures
                • Analysis of derived insights

                Data Validation

                • Triangulation with data models
                • Reference against proprietary databases
                • Corroboration with industry experts

                REPORT WRITING

                Qualitative

                • Market drivers
                • Market challenges
                • Market trends
                • Five forces analysis

                Quantitative

                • Market size and forecast
                • Market segmentation
                • Geographical insights
                • Competitive landscape

                Interested in this report?

                Get your sample now to see our research methodology and insights!

                Download Now

                Frequently Asked Questions

                Smart Tv Sticks market growth will increase by $ 962.7 mn during 2025-2029 .

                The Smart Tv Sticks market is expected to grow at a CAGR of 9% during 2025-2029 .

                Smart Tv Sticks market is segmented by Type( Non-4K, 4K and above, 1080p and below, 4K, 8K) Distribution Channel( Offline, Online, Direct-to-Consumer, Subscription Bundles, Middle East and Africa) Connectivity( Wi-Fi, Bluetooth, Ethernet, HDMI, Middle East and Africa)

                Actions Microelectronics Co. Ltd. (Taiwan), Airtame (Denmark), Amazon.com Inc. (United States), Apple Inc. (United States), ASUSTeK Computer Inc. (Taiwan), Bharti Airtel Ltd. (India), CloudWalker Streaming Technologies Pvt. Ltd. (India), Dish TV India Ltd. (India), Geniatech Inc. (China), Google LLC (United States), Matricom (United States), MECOOL (China), NVIDIA Corp. (United States), Roku Inc. (United States), Shenzhen Rikomagic Tech Corp. Ltd. (China), Shenzhen Tomato Technology Co. Ltd. (China), Topleo Technology Ltd. (China), Xiaomi Inc. (China) are a few of the key vendors in the Smart Tv Sticks market.

                North America will register the highest growth rate of 33% among the other regions. Therefore, the Smart Tv Sticks market in North America is expected to garner significant business opportunities for the vendors during the forecast period.

                US, Canada, Germany, UK, China, France, India, Japan, Italy, South Korea, UAE, Brazil

                • Growing smart home ecosystemSmart TV sticks are increasingly being integrated into broader smart home ecosystems is the driving factor this market.
                • allowing users to control their TV and streaming experience through voice commands or automation routines. The integration of smart TV sticks with smart speakers is the driving factor this market.
                • smart displays is the driving factor this market.
                • and other connected devices enables seamless interoperability and enhances the overall smart home experience. Additionally is the driving factor this market.
                • users can control their smart TV sticks alongside other smart home devices that use unified control interfaces provided by virtual assistants like Amazon Alexa is the driving factor this market.
                • Google Assistant is the driving factor this market.
                • and Apple Siri. This allows users to adjust the lighting is the driving factor this market.
                • temperature is the driving factor this market.
                • and other smart home settings while watching TV is the driving factor this market.
                • enhancing convenience and accessibility. Moreover is the driving factor this market.
                • smart TV sticks can be incorporated into automation routines and scenes within smart home ecosystems. For example is the driving factor this market.
                • users can create custom scenes that dim the lights is the driving factor this market.
                • lower the blinds is the driving factor this market.
                • and turn on the TV with a single voice command or at the press of a button is the driving factor this market.
                • creating immersive entertainment experiences tailored to their preferences. Moreover is the driving factor this market.
                • smart TV sticks enable cross-device interactions within the smart home ecosystem is the driving factor this market.
                • allowing users to mirror content from their smartphones is the driving factor this market.
                • tablets is the driving factor this market.
                • or laptops to their TV screens. This seamless integration enhances connectivity and enables users to access their favorite apps is the driving factor this market.
                • games is the driving factor this market.
                • and media across multiple devices. For instance is the driving factor this market.
                • the Chromebit CS10 smart TV stick from ASUSTeK is the driving factor this market.
                • powered by the latest Chrome OS is the driving factor this market.
                • boots up in seconds and offers full HD graphics performance. The device includes 2GB of RAM is the driving factor this market.
                • 16GB of eMMC storage is the driving factor this market.
                • dual-band 802.11ac Wi-Fi is the driving factor this market.
                • Bluetooth 4.0 is the driving factor this market.
                • and USB and HDMI connections and supports Bluetooth keyboards is the driving factor this market.
                • computer mouse is the driving factor this market.
                • and USB hubs. Furthermore is the driving factor this market.
                • the integration with smart home devices such as smart lighting systems is the driving factor this market.
                • ambient lighting is the driving factor this market.
                • and smart speakers enhances entertainment experiences for consumers by creating immersive viewing environments. Users can synchronize lighting effects with on-screen content is the driving factor this market.
                • adjust audio settings is the driving factor this market.
                • and create dynamic atmospheres that complement their entertainment activities. Thus is the driving factor this market.
                • the growing smart home ecosystem will promote the growth of the global smart TV sticks market during the forecast period. is the driving factor this market.

                The Smart Tv Sticks market vendors should focus on grabbing business opportunities from the Non-4K segment as it accounted for the largest market share in the base year.