Sodium Ion Battery Market Analysis APAC, Europe, North America, South America, Middle East and Africa - US, China, Japan, Germany, UK - Size and Forecast 2024-2028

Sodium Ion Battery Market Analysis APAC, Europe, North America, South America, Middle East and Africa - US, China, Japan, Germany, UK - Size and Forecast 2024-2028

Published: Dec 2023 140 Pages SKU: IRTNTR77092

Market Overview at a Glance

$414.4 Mn
Market Opportunity
17.33%
CAGR
16.93
YoY growth 2023-2024(%)

Sodium Ion Battery Market Size 2024-2028

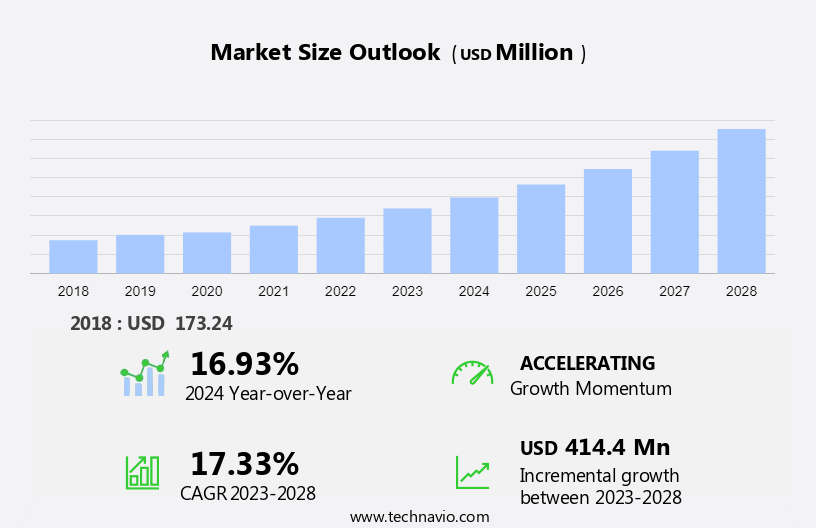
The sodium ion battery market size is forecast to increase by USD 414.4 million at a CAGR of 17.33% between 2023 and 2028.

  • The market is witnessing significant growth due to the increasing demand for advanced energy solutions in various sectors. The rising trend of using smartphones, wearable technology, laptops, tablets, and wearables is driving the need for high-capacity and lightweight batteries. Sodium-ion batteries offer an attractive alternative to lithium-ion batteries due to their lower cost and abundant availability of raw materials. Moreover, the increasing adoption of renewable energy sources and the need for energy storage solutions for power grids are also boosting the market. However, the lower life cycle of sodium-ion batteries compared to lithium-ion batteries is a major challenge that needs to be addressed to gain widespread acceptance In the market. The market is expected to grow steadily, with automation and the integration of sodium-ion batteries in consumer electronics and renewable energy applications being key trends.

What will be the Size of the Sodium Ion Battery Market During the Forecast Period?

Sodium Ion Battery Market Size

 Request Free Sample

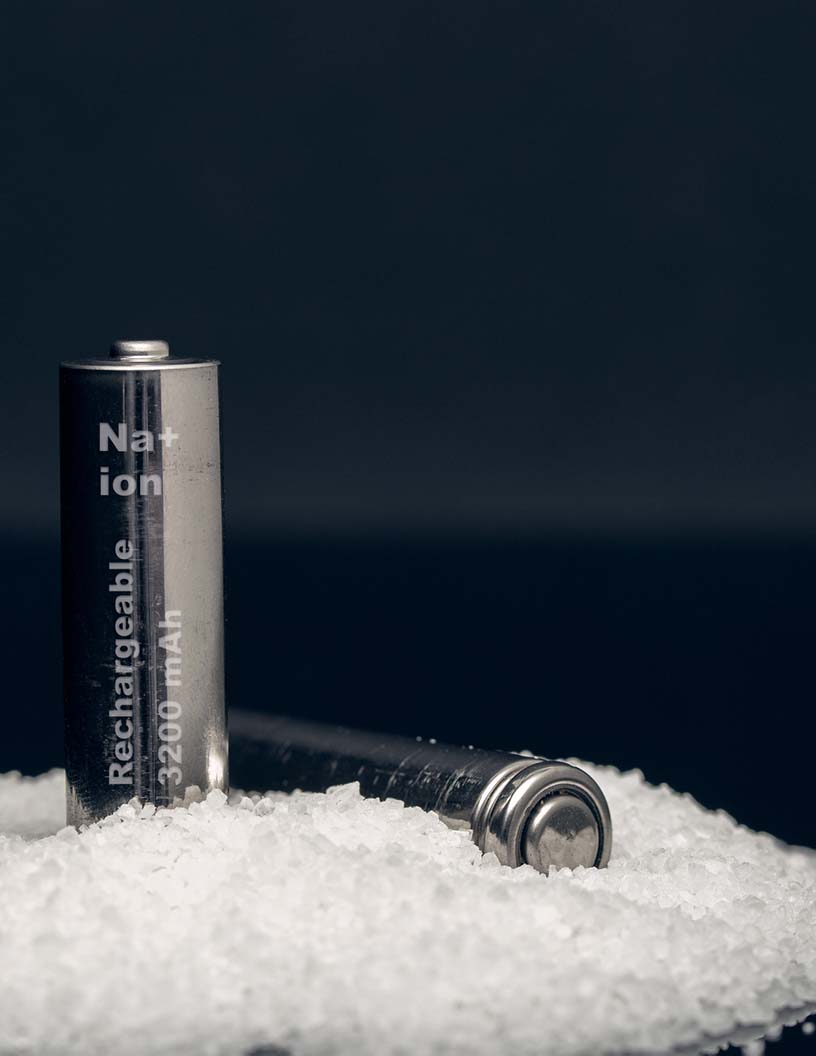
  • The market represents an emerging alternative to lithium-ion batteries, particularly In the energy storage segment for various applications, including transportation and renewable energy. Sodium ion batteries offer several advantages, such as the use of abundant and low-cost sodium resources, greater safety, and environmental friendliness. The market is experiencing significant growth due to increasing demand for sustainable energy solutions and the need for cost-effective alternatives to lithium-ion batteries. 
  • The market's size is anticipated to expand as research and development efforts continue to improve energy density, which remains a key challenge for sodium ion batteries. The transportation sector, particularly electric vehicles, is expected to be a significant contributor to the market's growth due to the potential for sodium ion batteries to offer longer range and faster charging times compared to current lithium-ion battery technology.

How is this Sodium Ion Battery Industry segmented and which is the largest segment?

The sodium ion battery industry research report provides comprehensive data (region-wise segment analysis), with forecasts and estimates in "USD million" for the period 2024-2028, as well as historical data from 2018-2022 for the following segments.

  • Application
    • Industrial
    • Commercial
    • Residential
  • End-user
    • Stationary energy storge
    • Transportation
  • Geography
    • APAC
      • China
      • Japan
    • Europe
      • Germany
      • UK
    • North America
      • US
    • South America
    • Middle East and Africa

By Application Insights

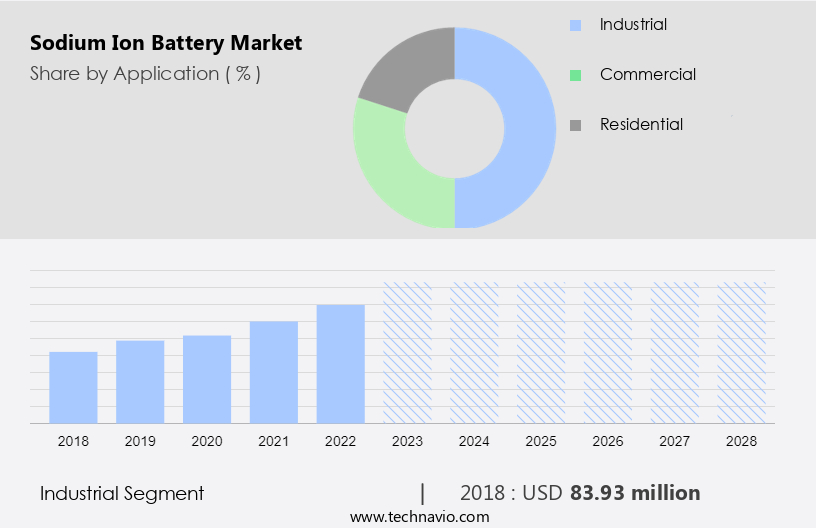
  • The industrial segment is estimated to witness significant growth during the forecast period.

Sodium-ion batteries represent an emerging alternative to lithium-ion batteries for various industrial applications, including grid energy storage and electric vehicles. These batteries can effectively store and release large quantities of energy derived from renewable sources like solar and wind, contributing to energy stability and addressing electricity demand during peak usage. In the transportation sector, sodium-ion batteries may offer a cost-effective solution for energy storage in electric cars, thereby advancing the transition to sustainable mobility. Additionally, they can be utilized in stationary energy storage applications, such as backup power systems for critical infrastructure, telecommunications, and remote locations. Sodium-ion batteries offer advantages like nonflammability and the ability to function in colder temperatures, making them a promising substitute for lithium-ion batteries In the energy storage market.

Sodium Ion Battery Market Size

Get a glance at the market report of share of various segments Request Free Sample

The industrial segment was valued at USD 83.93 million in 2018 and showed a gradual increase during the forecast period.

Regional Analysis

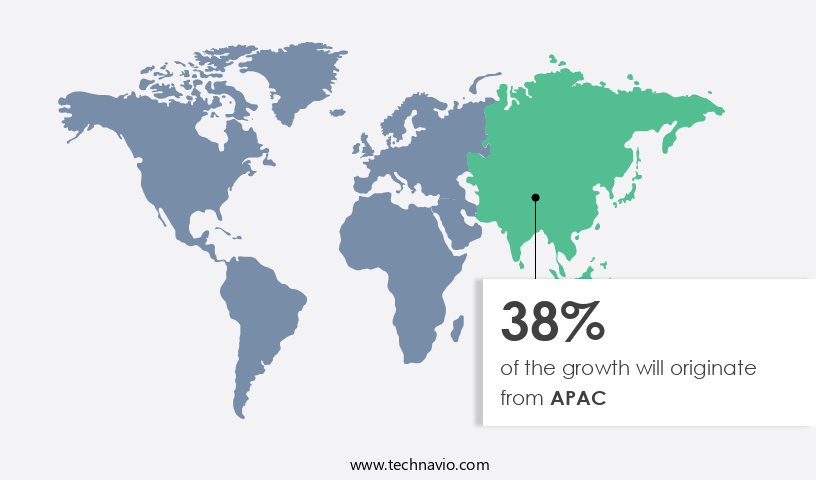
  • APAC is estimated to contribute 38% to the growth of the global market during the forecast period.

Technavio's analysts have elaborately explained the regional trends and drivers that shape the market during the forecast period.

Sodium Ion Battery Market Share by Geography

For more insights on the market size of various regions, Request Free Sample

The Sodium-ion battery market is gaining traction as a potential Lithium-ion battery substitute, particularly In the automotive and energy storage sectors. With the increasing focus on renewable energy and the shift towards electric vehicles (EVs), the demand for energy storage solutions is surging. Sodium-ion batteries offer advantages such as nonflammability, lower production cost, and the availability of raw materials like sodium from the Earth's crust and seawater. In the automotive industry, APAC is a significant manufacturing hub for EVs, with major producers like Toyota Motor, MITSUBISHI MOTORS, and Honda Motor based in South Asian countries. The region's sodium-ion battery market growth is driven by the adoption of EVs and government initiatives to reduce dependency on fossil fuel-operated vehicles.

Market Dynamics

Our researchers analyzed the data with 2023 as the base year, along with the key drivers, trends, and challenges. A holistic analysis of drivers will help companies refine their marketing strategies to gain a competitive advantage.

What are the key market drivers leading to the rise In the adoption of Sodium Ion Battery Industry?

Rising demand for smart devices is the key driver of the market.

  • Sodium-ion batteries are gaining attention as potential substitutes for lithium-ion batteries in various applications, particularly In the renewable energy sector for energy storage services and in transportation, such as electric cars. The abundance of sodium In the Earth's crust and seawater makes it an attractive alternative to lithium. Sodium-ion batteries offer advantages such as being nonflammable and performing better in colder temperatures. The increasing demand for energy storage solutions In the solar, wind, and electric vehicle sectors necessitates the development of energy-dense and cost-effective batteries. Sodium-ion batteries could address this need, providing an alternative to lithium-ion batteries in LED flashlights, consumer electronics, industrial applications, and electricity demand management for smart grids.
  • Battery OEMs are investing in research and development to improve the energy density and performance of sodium-ion batteries, making them more attractive for various end use products. Additionally, the recycling of sodium-ion batteries and their second-life applications in stationary energy storage could further reduce their overall cost. The cost-effectiveness of sodium-ion batteries is a significant factor In their potential adoption. If production costs can be minimized, sodium-ion batteries could offer a competitive advantage over lithium-ion batteries, especially in markets where cost sensitivity is high. The energy storage segment, including transportation and industrial applications, is expected to be major markets for sodium-ion batteries.

What are the market trends shaping the Sodium Ion Battery Industry?

Increasing demand for high-capacity and lightweight batteries in consumer electronics is the upcoming market trend.

  • Sodium-ion batteries are gaining attention as potential substitutes for lithium-ion batteries in various industries, particularly In the context of renewable energy and energy storage services. The increasing adoption of renewable energy sources and the growing demand for electric vehicles (EVs) have highlighted the need for reliable and cost-effective energy storage solutions. Sodium-ion batteries offer several advantages, such as being nonflammable and able to operate in colder temperatures, making them attractive alternatives to lithium-ion batteries. Moreover, sodium is abundant In the Earth's crust and can be sourced from seawater, whereas lithium is a finite resource with supply disruptions and high manufacturing costs.
  • The energy storage segment, including transportation, solar, wind, and electricity demand, is a significant market for sodium-ion batteries. Additional players In the ecosystem are exploring the potential of sodium-ion batteries for end use products such as LED flashlights, consumer electronics, industrial applications, and even second-life applications for electric vehicles. The potential for battery recycling and the ability to produce sodium-ion batteries at a lower production cost than lithium-ion batteries further strengthen the market's appeal. The energy density of sodium-ion batteries is comparable to that of lithium-ion batteries, making them suitable for various applications. The market for sodium-ion batteries is expected to grow significantly during the forecast period due to the increasing demand for energy storage solutions that are both cost-effective and environmentally friendly.

What challenges does the Sodium Ion Battery Industry face during its growth?

Lower life cycle of sodium-ion batteries is a key challenge affecting the industry growth.

  • Sodium-ion batteries present an alternative to lithium-ion batteries in various applications, including LED flashlights, renewable energy, and energy storage services. However, their lower life cycle, which is a challenge for high-cycle applications like electric vehicles (EVs) and grid energy storage, can impact their cost competitiveness. Although sodium-ion batteries may initially offer cost advantages due to the availability of raw materials like sodium from the Earth's crust and seawater, the need for more frequent battery replacements can lead to higher long-term costs. In the energy storage segment, sodium-ion batteries find applications in consumer electronics and industrial sectors. The electricity demand for smart grids and renewable energy integration necessitates stable and long-lasting battery performance.
  • Sodium-ion batteries' lower life cycle can pose challenges In these applications, limiting their suitability for energy storage services In the transportation, solar, and wind sectors. Battery recycling and second-life applications can help mitigate the environmental impact of sodium-ion batteries and reduce the demand for new batteries. Additionally, ongoing research and development efforts aim to improve the energy density and production cost of sodium-ion batteries to enhance their competitiveness with lithium-ion batteries. Battery OEMs continue to explore the potential of sodium-ion batteries as lithium-ion battery substitutes, recognizing their nonflammability and ability to perform well in colder temperatures. The energy storage market's dynamics are influenced by factors such as manufacturing cost, energy density, and market trends.

Exclusive Customer Landscape

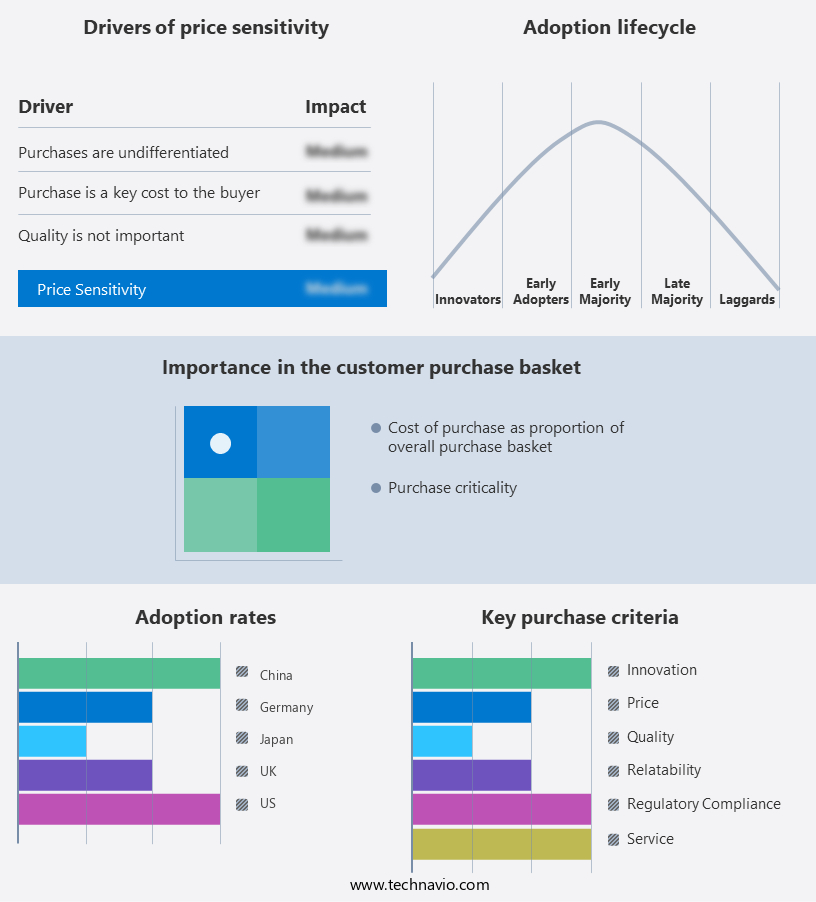
The sodium ion battery market forecasting report includes the adoption lifecycle of the market, covering from the innovator's stage to the laggard's stage. It focuses on adoption rates in different regions based on penetration. Furthermore, the sodium ion battery market report also includes key purchase criteria and drivers of price sensitivity to help companies evaluate and develop their market growth analysis strategies.

Sodium Ion Battery Market Share by Geography

 Customer Landscape

Key Companies & Market Insights

Companies are implementing various strategies, such as strategic alliances, sodium ion battery market forecast, partnerships, mergers and acquisitions, geographical expansion, and product/service launches, to enhance their presence in the industry.

The industry research and growth report includes detailed analyses of the competitive landscape of the market and information about key companies, including:

  • Altris AB
  • AMTE Power plc
  • Aquion Energy
  • Contemporary Amperex Technology Co. Ltd.
  • Faradion Ltd
  • HiNa Battery Technology Co. Ltd.
  • Natron Energy Inc.
  • NEI Corp.
  • NGK Insulators Ltd.
  • Tiamat

Qualitative and quantitative analysis of companies has been conducted to help clients understand the wider business environment as well as the strengths and weaknesses of key industry players. Data is qualitatively analyzed to categorize companies as pure play, category-focused, industry-focused, and diversified; it is quantitatively analyzed to categorize companies as dominant, leading, strong, tentative, and weak.

Research Analyst Overview

Sodium ion batteries, a promising alternative to lithium-ion batteries, have been gaining attention in various industries due to their unique advantages. These batteries utilize sodium instead of lithium as the primary electrode material, making them more abundant and environmentally friendly. The renewable energy sector is one of the primary markets for sodium ion batteries. As the world shifts towards cleaner energy sources, energy storage solutions play a crucial role in ensuring the stability and reliability of the grid. Sodium ion batteries offer several benefits in this regard. They are nonflammable, making them safer than lithium-ion batteries. Additionally, they can perform well in colder temperatures, expanding their application scope.

In addition, in the transportation sector, sodium ion batteries are being explored as substitutes for lithium-ion batteries in electric vehicles (EVs) and energy storage services. The high manufacturing cost of lithium-ion batteries has been a significant barrier to the widespread adoption of EVs. Sodium ion batteries, with their lower raw material costs, could potentially make EVs more affordable. The industrial sector is another potential market for sodium ion batteries. Energy storage is a critical component of industrial processes, and sodium ion batteries' energy density and production cost make them an attractive option. Furthermore, their nonflammability and ability to perform well in extreme temperatures make them suitable for various applications.

Furthermore, the energy storage segment, in particular, is expected to witness significant growth In the coming years. The increasing electricity demand, coupled with the integration of renewable energy sources, necessitates the need for efficient and cost-effective energy storage solutions. Sodium ion batteries, with their unique advantages, could play a significant role in meeting this demand. The consumer electronics industry is another potential market for sodium ion batteries. While lithium-ion batteries currently dominate this sector, sodium ion batteries' energy density and cost could make them a viable alternative. Additionally, their nonflammability and environmental friendliness could appeal to consumers looking for eco-friendly options.

In addition, battery recycling is another area where sodium ion batteries could make a significant impact. Lithium-ion batteries pose unique recycling challenges due to their complex chemistry and the presence of heavy metals. Sodium ion batteries, on the other hand, are made of abundant materials found In the earth's crust and seawater. Their recycling could be more straightforward and cost-effective. Second-life applications of sodium ion batteries are also being explored. As batteries reach the end of their life in one application, they can be repurposed for another. Sodium ion batteries' ability to perform well in various temperatures and their nonflammability make them suitable for second-life applications In the grid and transportation sectors.

Furthermore, additional players are entering the market, expanding the ecosystem and driving innovation. This competition could lead to advancements in technology, cost reduction, and improved performance. Their nonflammability, ability to perform well in extreme temperatures, and lower raw material costs make them suitable for the renewable energy, transportation, industrial, and consumer electronics sectors. The increasing electricity demand and the integration of renewable energy sources are expected to drive the growth of the energy storage segment, where sodium ion batteries could play a significant role. Furthermore, their recycling potential and second-life applications add to their appeal.

Market Scope

Report Coverage

Details

Page number

140

Base year

2023

Historic period

2018-2022

Forecast period

2024-2028

Growth momentum & CAGR

Accelerate at a CAGR of 17.33%

Market growth 2024-2028

USD 414.4 million

Market structure

Concentrated

YoY growth 2023-2024(%)

16.93

Key countries

US, China, Japan, Germany, and UK

Competitive landscape

Leading Companies, market growth and forecasting, Market Positioning of Companies, Competitive Strategies, and Industry Risks

Request Free Sample

What are the Key Data Covered in this Sodium Ion Battery Market Research and Growth Report?

  • CAGR of the Sodium Ion Battery industry during the forecast period
  • Detailed information on factors that will drive the growth and forecasting between 2024 and 2028
  • Precise estimation of the size of the market and its contribution of the industry in focus to the parent market
  • Accurate predictions about upcoming growth and trends and changes in consumer behaviour
  • Growth of the market across APAC, Europe, North America, South America, and Middle East and Africa
  • Thorough analysis of the market's competitive landscape and detailed information about companies
  • Comprehensive analysis of factors that will challenge the sodium ion battery market growth of industry companies

We can help! Our analysts can customize this sodium ion battery market research report to meet your requirements.

Get in touch

1 Executive Summary

  • 1.1 Market overview
    • Exhibit 01: Executive Summary – Chart on Market Overview
    • Exhibit 02: Executive Summary – Data Table on Market Overview
    • Exhibit 03: Executive Summary – Chart on Global Market Characteristics
    • Exhibit 04: Executive Summary – Chart on Market by Geography
    • Exhibit 05: Executive Summary – Chart on Market Segmentation by Application
    • Exhibit 06: Executive Summary – Chart on Market Segmentation by End-user
    • Exhibit 07: Executive Summary – Chart on Incremental Growth
    • Exhibit 08: Executive Summary – Data Table on Incremental Growth
    • Exhibit 09: Executive Summary – Chart on Vendor Market Positioning

2 Market Landscape

  • 2.1 Market ecosystem
    • Exhibit 10: Parent market
    • Exhibit 11: Market Characteristics

3 Market Sizing

  • 3.1 Market definition
    • Exhibit 12: Offerings of vendors included in the market definition
  • 3.2 Market segment analysis
    • Exhibit 13: Market segments
  • 3.3 Market size 2023
    • 3.4 Market outlook: Forecast for 2023-2028
      • Exhibit 14: Chart on Global - Market size and forecast 2023-2028 ($ million)
      • Exhibit 15: Data Table on Global - Market size and forecast 2023-2028 ($ million)
      • Exhibit 16: Chart on Global Market: Year-over-year growth 2023-2028 (%)
      • Exhibit 17: Data Table on Global Market: Year-over-year growth 2023-2028 (%)

    4 Historic Market Size

    • 4.1 Global sodium ion battery market 2018 - 2022
      • Exhibit 18: Historic Market Size – Data Table on global sodium ion battery market 2018 - 2022 ($ million)
    • 4.2 Application Segment Analysis 2018 - 2022
      • Exhibit 19: Historic Market Size – Application Segment 2018 - 2022 ($ million)
    • 4.3 End-user Segment Analysis 2018 - 2022
      • Exhibit 20: Historic Market Size – End-user Segment 2018 - 2022 ($ million)
    • 4.4 Geography Segment Analysis 2018 - 2022
      • Exhibit 21: Historic Market Size – Geography Segment 2018 - 2022 ($ million)
    • 4.5 Country Segment Analysis 2018 - 2022
      • Exhibit 22: Historic Market Size – Country Segment 2018 - 2022 ($ million)

    5 Five Forces Analysis

    • 5.1 Five forces summary
      • Exhibit 23: Five forces analysis - Comparison between 2023 and 2028
    • 5.2 Bargaining power of buyers
      • Exhibit 24: Chart on Bargaining power of buyers – Impact of key factors 2023 and 2028
    • 5.3 Bargaining power of suppliers
      • Exhibit 25: Bargaining power of suppliers – Impact of key factors in 2023 and 2028
    • 5.4 Threat of new entrants
      • Exhibit 26: Threat of new entrants – Impact of key factors in 2023 and 2028
    • 5.5 Threat of substitutes
      • Exhibit 27: Threat of substitutes – Impact of key factors in 2023 and 2028
    • 5.6 Threat of rivalry
      • Exhibit 28: Threat of rivalry – Impact of key factors in 2023 and 2028
    • 5.7 Market condition
      • Exhibit 29: Chart on Market condition - Five forces 2023 and 2028

    6 Market Segmentation by Application

    • 6.1 Market segments
      • Exhibit 30: Chart on Application - Market share 2023-2028 (%)
      • Exhibit 31: Data Table on Application - Market share 2023-2028 (%)
    • 6.2 Comparison by Application
      • Exhibit 32: Chart on Comparison by Application
      • Exhibit 33: Data Table on Comparison by Application
    • 6.3 Industrial - Market size and forecast 2023-2028
      • Exhibit 34: Chart on Industrial - Market size and forecast 2023-2028 ($ million)
      • Exhibit 35: Data Table on Industrial - Market size and forecast 2023-2028 ($ million)
      • Exhibit 36: Chart on Industrial - Year-over-year growth 2023-2028 (%)
      • Exhibit 37: Data Table on Industrial - Year-over-year growth 2023-2028 (%)
    • 6.4 Commercial - Market size and forecast 2023-2028
      • Exhibit 38: Chart on Commercial - Market size and forecast 2023-2028 ($ million)
      • Exhibit 39: Data Table on Commercial - Market size and forecast 2023-2028 ($ million)
      • Exhibit 40: Chart on Commercial - Year-over-year growth 2023-2028 (%)
      • Exhibit 41: Data Table on Commercial - Year-over-year growth 2023-2028 (%)
    • 6.5 Residential - Market size and forecast 2023-2028
      • Exhibit 42: Chart on Residential - Market size and forecast 2023-2028 ($ million)
      • Exhibit 43: Data Table on Residential - Market size and forecast 2023-2028 ($ million)
      • Exhibit 44: Chart on Residential - Year-over-year growth 2023-2028 (%)
      • Exhibit 45: Data Table on Residential - Year-over-year growth 2023-2028 (%)
    • 6.6 Market opportunity by Application
      • Exhibit 46: Market opportunity by Application ($ million)
      • Exhibit 47: Data Table on Market opportunity by Application ($ million)

    7 Market Segmentation by End-user

    • 7.1 Market segments
      • Exhibit 48: Chart on End-user - Market share 2023-2028 (%)
      • Exhibit 49: Data Table on End-user - Market share 2023-2028 (%)
    • 7.2 Comparison by End-user
      • Exhibit 50: Chart on Comparison by End-user
      • Exhibit 51: Data Table on Comparison by End-user
    • 7.3 Stationary energy storge - Market size and forecast 2023-2028
      • Exhibit 52: Chart on Stationary energy storge - Market size and forecast 2023-2028 ($ million)
      • Exhibit 53: Data Table on Stationary energy storge - Market size and forecast 2023-2028 ($ million)
      • Exhibit 54: Chart on Stationary energy storge - Year-over-year growth 2023-2028 (%)
      • Exhibit 55: Data Table on Stationary energy storge - Year-over-year growth 2023-2028 (%)
    • 7.4 Transportation - Market size and forecast 2023-2028
      • Exhibit 56: Chart on Transportation - Market size and forecast 2023-2028 ($ million)
      • Exhibit 57: Data Table on Transportation - Market size and forecast 2023-2028 ($ million)
      • Exhibit 58: Chart on Transportation - Year-over-year growth 2023-2028 (%)
      • Exhibit 59: Data Table on Transportation - Year-over-year growth 2023-2028 (%)
    • 7.5 Market opportunity by End-user
      • Exhibit 60: Market opportunity by End-user ($ million)
      • Exhibit 61: Data Table on Market opportunity by End-user ($ million)

    8 Customer Landscape

    • 8.1 Customer landscape overview
      • Exhibit 62: Analysis of price sensitivity, lifecycle, customer purchase basket, adoption rates, and purchase criteria

    9 Geographic Landscape

    • 9.1 Geographic segmentation
      • Exhibit 63: Chart on Market share by geography 2023-2028 (%)
      • Exhibit 64: Data Table on Market share by geography 2023-2028 (%)
    • 9.2 Geographic comparison
      • Exhibit 65: Chart on Geographic comparison
      • Exhibit 66: Data Table on Geographic comparison
    • 9.3 APAC - Market size and forecast 2023-2028
      • Exhibit 67: Chart on APAC - Market size and forecast 2023-2028 ($ million)
      • Exhibit 68: Data Table on APAC - Market size and forecast 2023-2028 ($ million)
      • Exhibit 69: Chart on APAC - Year-over-year growth 2023-2028 (%)
      • Exhibit 70: Data Table on APAC - Year-over-year growth 2023-2028 (%)
    • 9.4 Europe - Market size and forecast 2023-2028
      • Exhibit 71: Chart on Europe - Market size and forecast 2023-2028 ($ million)
      • Exhibit 72: Data Table on Europe - Market size and forecast 2023-2028 ($ million)
      • Exhibit 73: Chart on Europe - Year-over-year growth 2023-2028 (%)
      • Exhibit 74: Data Table on Europe - Year-over-year growth 2023-2028 (%)
    • 9.5 North America - Market size and forecast 2023-2028
      • Exhibit 75: Chart on North America - Market size and forecast 2023-2028 ($ million)
      • Exhibit 76: Data Table on North America - Market size and forecast 2023-2028 ($ million)
      • Exhibit 77: Chart on North America - Year-over-year growth 2023-2028 (%)
      • Exhibit 78: Data Table on North America - Year-over-year growth 2023-2028 (%)
    • 9.6 South America - Market size and forecast 2023-2028
      • Exhibit 79: Chart on South America - Market size and forecast 2023-2028 ($ million)
      • Exhibit 80: Data Table on South America - Market size and forecast 2023-2028 ($ million)
      • Exhibit 81: Chart on South America - Year-over-year growth 2023-2028 (%)
      • Exhibit 82: Data Table on South America - Year-over-year growth 2023-2028 (%)
    • 9.7 Middle East and Africa - Market size and forecast 2023-2028
      • Exhibit 83: Chart on Middle East and Africa - Market size and forecast 2023-2028 ($ million)
      • Exhibit 84: Data Table on Middle East and Africa - Market size and forecast 2023-2028 ($ million)
      • Exhibit 85: Chart on Middle East and Africa - Year-over-year growth 2023-2028 (%)
      • Exhibit 86: Data Table on Middle East and Africa - Year-over-year growth 2023-2028 (%)
    • 9.8 US - Market size and forecast 2023-2028
      • Exhibit 87: Chart on US - Market size and forecast 2023-2028 ($ million)
      • Exhibit 88: Data Table on US - Market size and forecast 2023-2028 ($ million)
      • Exhibit 89: Chart on US - Year-over-year growth 2023-2028 (%)
      • Exhibit 90: Data Table on US - Year-over-year growth 2023-2028 (%)
    • 9.9 China - Market size and forecast 2023-2028
      • Exhibit 91: Chart on China - Market size and forecast 2023-2028 ($ million)
      • Exhibit 92: Data Table on China - Market size and forecast 2023-2028 ($ million)
      • Exhibit 93: Chart on China - Year-over-year growth 2023-2028 (%)
      • Exhibit 94: Data Table on China - Year-over-year growth 2023-2028 (%)
    • 9.10 Japan - Market size and forecast 2023-2028
      • Exhibit 95: Chart on Japan - Market size and forecast 2023-2028 ($ million)
      • Exhibit 96: Data Table on Japan - Market size and forecast 2023-2028 ($ million)
      • Exhibit 97: Chart on Japan - Year-over-year growth 2023-2028 (%)
      • Exhibit 98: Data Table on Japan - Year-over-year growth 2023-2028 (%)
    • 9.11 Germany - Market size and forecast 2023-2028
      • Exhibit 99: Chart on Germany - Market size and forecast 2023-2028 ($ million)
      • Exhibit 100: Data Table on Germany - Market size and forecast 2023-2028 ($ million)
      • Exhibit 101: Chart on Germany - Year-over-year growth 2023-2028 (%)
      • Exhibit 102: Data Table on Germany - Year-over-year growth 2023-2028 (%)
    • 9.12 UK - Market size and forecast 2023-2028
      • Exhibit 103: Chart on UK - Market size and forecast 2023-2028 ($ million)
      • Exhibit 104: Data Table on UK - Market size and forecast 2023-2028 ($ million)
      • Exhibit 105: Chart on UK - Year-over-year growth 2023-2028 (%)
      • Exhibit 106: Data Table on UK - Year-over-year growth 2023-2028 (%)
    • 9.13 Market opportunity by geography
      • Exhibit 107: Market opportunity by geography ($ million)
      • Exhibit 108: Data Tables on Market opportunity by geography ($ million)

    10 Drivers, Challenges, and Trends

    • 10.1 Market drivers
      • 10.2 Market challenges
        • 10.3 Impact of drivers and challenges
          • Exhibit 109: Impact of drivers and challenges in 2023 and 2028
        • 10.4 Market trends

          11 Vendor Landscape

          • 11.1 Overview
            • 11.2 Vendor landscape
              • Exhibit 110: Overview on Criticality of inputs and Factors of differentiation
            • 11.3 Landscape disruption
              • Exhibit 111: Overview on factors of disruption
            • 11.4 Industry risks
              • Exhibit 112: Impact of key risks on business

            12 Vendor Analysis

            • 12.1 Vendors covered
              • Exhibit 113: Vendors covered
            • 12.2 Market positioning of vendors
              • Exhibit 114: Matrix on vendor position and classification
            • 12.3 Altris AB
              • Exhibit 115: Altris AB - Overview
              • Exhibit 116: Altris AB - Product / Service
              • Exhibit 117: Altris AB - Key offerings
            • 12.4 AMTE Power plc
              • Exhibit 118: AMTE Power plc - Overview
              • Exhibit 119: AMTE Power plc - Product / Service
              • Exhibit 120: AMTE Power plc - Key offerings
            • 12.5 Aquion Energy
              • Exhibit 121: Aquion Energy - Overview
              • Exhibit 122: Aquion Energy - Product / Service
              • Exhibit 123: Aquion Energy - Key offerings
            • 12.6 Contemporary Amperex Technology Co. Ltd.
              • Exhibit 124: Contemporary Amperex Technology Co. Ltd. - Overview
              • Exhibit 125: Contemporary Amperex Technology Co. Ltd. - Product / Service
              • Exhibit 126: Contemporary Amperex Technology Co. Ltd. - Key offerings
            • 12.7 Faradion Ltd
              • Exhibit 127: Faradion Ltd - Overview
              • Exhibit 128: Faradion Ltd - Product / Service
              • Exhibit 129: Faradion Ltd - Key offerings
            • 12.8 HiNa Battery Technology Co. Ltd.
              • Exhibit 130: HiNa Battery Technology Co. Ltd. - Overview
              • Exhibit 131: HiNa Battery Technology Co. Ltd. - Product / Service
              • Exhibit 132: HiNa Battery Technology Co. Ltd. - Key offerings
            • 12.9 Natron Energy Inc.
              • Exhibit 133: Natron Energy Inc. - Overview
              • Exhibit 134: Natron Energy Inc. - Product / Service
              • Exhibit 135: Natron Energy Inc. - Key offerings
            • 12.10 NEI Corp.
              • Exhibit 136: NEI Corp. - Overview
              • Exhibit 137: NEI Corp. - Product / Service
              • Exhibit 138: NEI Corp. - Key offerings
            • 12.11 NGK Insulators Ltd.
              • Exhibit 139: NGK Insulators Ltd. - Overview
              • Exhibit 140: NGK Insulators Ltd. - Business segments
              • Exhibit 141: NGK Insulators Ltd. - Key offerings
              • Exhibit 142: NGK Insulators Ltd. - Segment focus
            • 12.12 Tiamat
              • Exhibit 143: Tiamat - Overview
              • Exhibit 144: Tiamat - Product / Service
              • Exhibit 145: Tiamat - Key offerings

            13 Appendix

            • 13.1 Scope of the report
              • 13.2 Inclusions and exclusions checklist
                • Exhibit 146: Inclusions checklist
                • Exhibit 147: Exclusions checklist
              • 13.3 Currency conversion rates for US$
                • Exhibit 148: Currency conversion rates for US$
              • 13.4 Research methodology
                • Exhibit 149: Research methodology
                • Exhibit 150: Validation techniques employed for market sizing
                • Exhibit 151: Information sources
              • 13.5 List of abbreviations
                • Exhibit 152: List of abbreviations

              Research Methodology

              Technavio presents a detailed picture of the market by way of study, synthesis, and summation of data from multiple sources. The analysts have presented the various facets of the market with a particular focus on identifying the key industry influencers. The data thus presented is comprehensive, reliable, and the result of extensive research, both primary and secondary.

              INFORMATION SOURCES

              Primary sources

              • Manufacturers and suppliers
              • Channel partners
              • Industry experts
              • Strategic decision makers

              Secondary sources

              • Industry journals and periodicals
              • Government data
              • Financial reports of key industry players
              • Historical data
              • Press releases

              DATA ANALYSIS

              Data Synthesis

              • Collation of data
              • Estimation of key figures
              • Analysis of derived insights

              Data Validation

              • Triangulation with data models
              • Reference against proprietary databases
              • Corroboration with industry experts

              REPORT WRITING

              Qualitative

              • Market drivers
              • Market challenges
              • Market trends
              • Five forces analysis

              Quantitative

              • Market size and forecast
              • Market segmentation
              • Geographical insights
              • Competitive landscape

              Interested in this report?

              Get your sample now to see our research methodology and insights!

              Download Now

              Frequently Asked Questions

              Sodium Ion Battery market growth will increase by $ 414.4 mn during 2024-2028 .

              The Sodium Ion Battery market is expected to grow at a CAGR of 17.33% during 2024-2028 .

              Sodium Ion Battery market is segmented by Application( Industrial, Commercial, Residential) End-user( Stationary energy storge, Transportation)

              Altris AB, AMTE Power plc, Aquion Energy, Contemporary Amperex Technology Co. Ltd., Faradion Ltd, HiNa Battery Technology Co. Ltd., Natron Energy Inc., NEI Corp., NGK Insulators Ltd., Tiamat are a few of the key vendors in the Sodium Ion Battery market.

              APAC will register the highest growth rate of 38% among the other regions. Therefore, the Sodium Ion Battery market in APAC is expected to garner significant business opportunities for the vendors during the forecast period.

              US, China, Japan, Germany, UK

              • Rising demand for smart devicesThe increasing adoption of smart devices is the driving factor this market.
              • including smartphones is the driving factor this market.
              • wearables is the driving factor this market.
              • and smart home devices is the driving factor this market.
              • has led to a growing need for efficient and compact energy storage solutions. Sodium-ion batteries is the driving factor this market.
              • if developed successfully is the driving factor this market.
              • could provide an alternative to lithium-ion batteries in powering these devices. Furthermore is the driving factor this market.
              • smart devices often require compact and lightweight energy storage solutions with high energy density. The development of sodium-ion batteries with improved energy density and performance characteristics could make them more attractive for integration into smart devices. The cost-effectiveness of sodium-ion batteries is a crucial factor. If sodium-ion batteries can offer a cost advantage over lithium-ion batteries is the driving factor this market.
              • it may drive their adoption in smart devices is the driving factor this market.
              • especially in markets where cost sensitivity is high. Thus is the driving factor this market.
              • the increasing demand for smart devices could incentivize research and development investments in sodium-ion battery technology is the driving factor this market.
              • which will boost the global sodium-ion battery market during the forecast period. is the driving factor this market.

              The Sodium Ion Battery market vendors should focus on grabbing business opportunities from the Industrial segment as it accounted for the largest market share in the base year.