Software-Defined Radio (SDR) Market Size 2025-2029
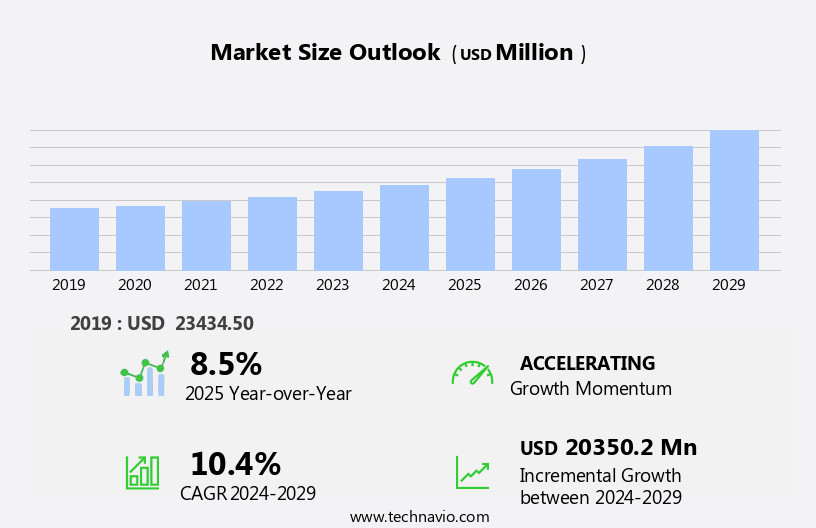
The software-defined radio (SDR) market size is forecast to increase by USD 20.35 billion at a CAGR of 10.4% between 2024 and 2029.
- The market is experiencing significant growth due to the increasing demand for cost-effective solutions for smart connected devices. SDR technology enables flexible and efficient communication systems by allowing the software configuration of radio parameters, making it an ideal choice for various applications, including telecommunications, military, and scientific research. The adoption of advanced communication technologies, such as 5G and IoT, is driving the need for more flexible and versatile radio solutions. Furthermore, the rising adoption of advanced communication technologies, such as 5G and IoT, is driving the market's growth as SDR offers the flexibility and adaptability required to support these emerging technologies. However, the complexity of SDR technology in integration with existing systems poses a significant challenge for market growth.
- The integration process requires specialized expertise and resources, which can increase implementation costs and time. Additionally, ensuring interoperability between different SDR systems and components can be a complex and time-consuming process. SDR's ability to reconfigure radio frequencies in real-time and support multiple communication standards makes it an attractive solution for various applications, including military, telecommunications, and consumer electronics. Companies seeking to capitalize on the market opportunities offered by SDR technology must focus on simplifying the integration process and providing comprehensive support services to their customers. By addressing these challenges, they can effectively navigate the market landscape and establish a competitive position in the rapidly growing SDR market. Additionally, the incorporation of mixers, antennae, filters, application-specific ICs, field-programmable gate arrays, and wireless capabilities further enhances SDR's versatility.
What will be the Size of the Software-Defined Radio (SDR) Market during the forecast period?

Request Free Sample
- The market encompasses technologies and applications that enable flexible and agile radio communication systems. SDRs utilize software for signal processing, allowing for dynamic modulation, demodulation, channel estimation, and data acquisition. This flexibility offers significant advantages in various sectors, including signal analysis, spectrum management, and telemetry. SDRs are instrumental in addressing radio frequency interference (RFI) and enhancing spectrum sharing through advanced signal processing algorithms. Modulation techniques, such as orthogonal frequency division multiplexing (OFDM) and direct sequence spread spectrum (DSSS), enable efficient spectrum utilization and improved data rates.
- Moreover, SDRs play a crucial role in over-the-air testing and radio frequency identification (RFID) applications. The integration of SDRs in wireless power transfer and charging systems is a growing trend, offering potential for innovative applications and increased efficiency. Additionally, SDRs find applications in software-defined sensors, education, and research and development, fostering continuous innovation in the field of wireless communications. The technology also finds applications in healthcare, including remote patient monitoring, medical telemetry, and smart healthcare solutions.
How is this Software-Defined Radio (SDR) Industry segmented?
The software-defined radio (SDR) industry research report provides comprehensive data (region-wise segment analysis), with forecasts and estimates in "USD million" for the period 2025-2029, as well as historical data from 2019-2023 for the following segments.
- Application
- Defense
- Homeland security
- Commercial
- Type
- Joint tactical radio system
- Cognitive radio
- General purpose radio
- Terrestrial trunked radio
- Frequency Band
- Platform
- Components
- Hardware
- Software
- Services
- Geography
- North America
- Europe
- Middle East and Africa
- APAC
- China
- India
- Japan
- South Korea
- South America
- Rest of World (ROW)
By Application Insights
The defense segment is estimated to witness significant growth during the forecast period. Software-Defined Radio (SDR) is a cutting-edge technology in wireless communication that utilizes Digital Signal Processing (DSP) to convert and process Radio Frequency (RF) signals digitally. SDRs employ Cognitive Radio technology for Spectrum Sensing and Dynamic Spectrum Access, making them an essential component in various industries. SDRs have found extensive applications in defense, wireless communication, satellite communication, air traffic control, military communications, radio astronomy, scientific research, remote sensing, industrial automation, Internet of Things, and Wireless Sensor Networks. In the defense sector, SDRs are utilized in tactical communication, surveillance, and reconnaissance systems due to their flexibility, reconfigurability, and compatibility with multiple communication standards. The technology also finds applications in healthcare, including remote patient monitoring, medical telemetry, and smart healthcare solutions.

Get a glance at the market report of share of various segments Request Free Sample
The Defense segment was valued at USD 19.33 billion in 2019 and showed a gradual increase during the forecast period. Software-Defined Radio (SDR) is a revolutionary technology that has transformed the way radio communications are perceived and utilized. SDR systems differ from traditional radios by separating the RF frontend from the digital signal processing (DSP) components, allowing for greater flexibility, reconfigurability, and interoperability. At the heart of an SDR system are the RF transceiver and the analog-to-digital converter (ADC), which convert RF signals to digital data for further processing. The digital signal is then processed using DSP algorithms, often implemented in software, to extract valuable information. SDR development kits provide an accessible entry point for engineers and hobbyists to explore this technology.
SDR offers several advantages over traditional radios. Its high performance, wide frequency range, and low power consumption make it suitable for various applications, including wireless communications, radio astronomy, and signal intelligence. SDR's flexibility and reconfigurability enable it to adapt to different communication standards and protocols. However, challenges such as SDR security, interoperability, and latency remain. Ensuring secure communication over SDR networks is crucial, as the digital nature of the signals makes them more vulnerable to interception. Additionally, achieving seamless interoperability between different SDR systems and software can be challenging. Lastly, minimizing SDR latency is essential for real-time applications, such as radar systems and satellite communications. In summary, SDR is a versatile technology that offers numerous advantages, including flexibility, reconfigurability, and high performance. Its applications range from wireless communications to radio astronomy, and its future potential is vast. Despite the challenges, continued advancements in SDR hardware, software, and research will undoubtedly lead to new breakthroughs and innovations.
Regional Analysis
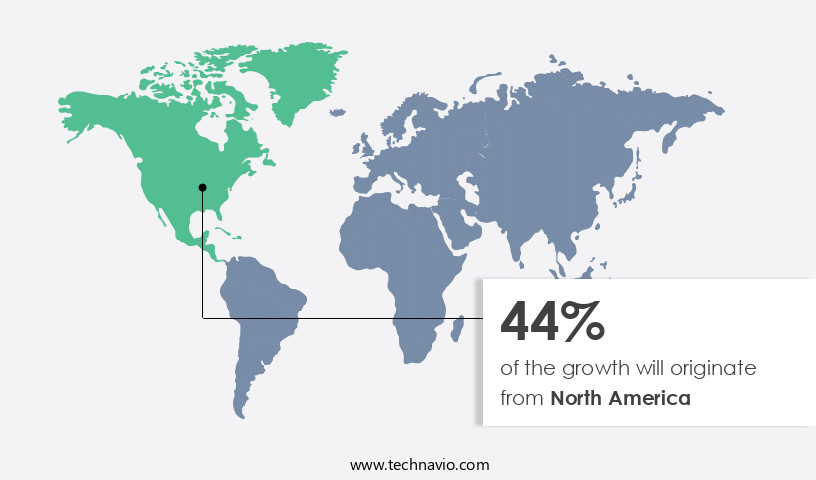
North America is estimated to contribute 44% to the growth of the global market during the forecast period. Technavio's analysts have elaborately explained the regional trends and drivers that shape the market during the forecast period.

For more insights on the market size of various regions, Request Free Sample
The market encompasses digital signal processing technologies that convert radio frequency (RF) signals into software-defined form. SDR systems employ cognitive radio for spectrum sensing and dynamic spectrum access, enabling wireless communication applications like satellite communication, air traffic control, military communications, and radio astronomy. SDR's flexibility and reconfigurability offer advantages in scientific research, remote sensing, industrial automation, the internet of Things, and wireless sensor networks. Key components of SDR systems include RF transceivers, RF front-ends, analog-to-digital converters, and digital-to-analog converters. Software-defined networking and network virtualization further expand SDR's potential. Open source SDR platforms, development kits, applications, software, hardware, and ecosystems foster innovation and collaboration within the SDR community.
Market Dynamics
Our researchers analyzed the data with 2024 as the base year, along with the key drivers, trends, and challenges. A holistic analysis of drivers will help companies refine their marketing strategies to gain a competitive advantage.
What are the key market drivers leading to the rise in the adoption of Software-Defined Radio (SDR) Industry?
- Increasing need for cost-effective solutions for smart connected devices is the key driver of the market. The market is driven by the demand for cost-effective communication solutions. SDR technology enables efficient spectrum usage, leading to reduced deployment and maintenance costs for communication networks. Moreover, its modular design allows for easy upgrades and reconfigurations, further decreasing the cost of ownership. Notably, the Internet of Things (IoT) sector is witnessing significant growth, and SDRs are increasingly being adopted due to their ability to support a wide range of communication protocols and frequencies with minimal power consumption. This makes them an ideal choice for connecting numerous IoT devices. In summary, the cost savings and versatility offered by SDRs make them a valuable investment for businesses seeking advanced communication solutions.
- The US military has adopted SDR technology in its communication systems, including the US Army's Joint Tactical Radio System program and the US Navy's Shipboard Communication System. SDRs offer cost optimization, improved performance, and increased bandwidth and frequency range, making them a valuable asset in various industries. Moreover, the SDR ecosystem comprises SDR platforms, development kits, applications, software, hardware, and a vibrant community of developers and researchers. The SDR standards ensure interoperability and security, while SDR cost optimization and flexibility make it an attractive choice for various applications. The industry faces regulatory scrutiny and consolidations, necessitating the development of cognitive radio technology and communication standards. SDRs' wireless capabilities, system performance, and communication devices contribute to the IoT, cloud computing, and AI technology advancements.
What are the market trends shaping the Software-Defined Radio (SDR) Industry?
- Rising adoption of advanced communication technologies is the upcoming market trend. Software-Defined Radio (SDR) technology is a versatile and adaptable solution for advanced communication systems, including Long-Term Evolution (LTE) and fifth generation (5G). SDRs' ability to support multiple communication standards and frequencies makes them an ideal choice for these systems. SDRs can swiftly adjust to evolving communication needs and be reprogrammed to accommodate new standards, such as those for 5G, which encompass radio frequency ranges in the low band (sub 1 GHz), mid-band (3.3-5 GHz), and high band (24.25-29.5 GHz and 37-43.5 GHz). Beyond their flexibility and reconfigurability, SDRs provide enhanced performance and cost savings compared to conventional radio systems. This technology's advantages make it a valuable asset for LTE and 5G networks.
- The Internet of Things (IoT) and wireless sensor networks also benefit from SDR's flexibility and cost optimization. The SDR ecosystem consists of various components, including RF transceivers, RF front-ends, analog-to-digital converters (ADC), and digital-to-analog converters (DAC). SDR platforms and development kits provide an accessible entry point for researchers, hobbyists, and developers to explore and innovate in this field. SDR applications span a wide range, from radio astronomy and scientific research to remote sensing and military communications. The open-source SDR community plays a crucial role in driving innovation and fostering collaboration in this field. SDR standards ensure interoperability and security within the SDR ecosystem.
What challenges does the Software-Defined Radio (SDR) Industry face during its growth?
- Complexity of SDR technology in integration with systems is a key challenge affecting the industry growth. The market faces complexities that hinder its growth. SDR technology's intricacy necessitates specialized expertise and knowledge for development and deployment, making it challenging for new market entrants and some governments to adopt it. Interoperability with legacy radio systems is another challenge due to differences in protocols, modulation schemes, and technical specifications. Interoperability testing is essential to ensure effective communication between SDRs and existing systems. SDRs' adaptability and mission-critical operational efficiency make them suitable for various applications, including healthcare, where remote patient monitoring, medical telemetry, and smart healthcare are increasingly prevalent.
- Furthermore, SDRs require additional components, such as antennas and amplifiers, to operate efficiently, increasing the overall system's complexity. Managing and troubleshooting these complexities can be time-consuming and resource-intensive. Despite these challenges, the SDR market continues to grow, offering opportunities for innovation and advancement in the field of radio communication technology. SDR standards ensure interoperability, security, cost optimization, and performance. SDR's adaptability caters to various industries, with applications ranging from aerospace and defense to telecommunications and consumer electronics. The market's growth is driven by the increasing demand for high-performance, flexible, and cost-effective communication solutions. SDR's ability to handle broad frequency ranges, high bandwidth, and low power consumption makes it a preferred choice for numerous applications.
Exclusive Customer Landscape
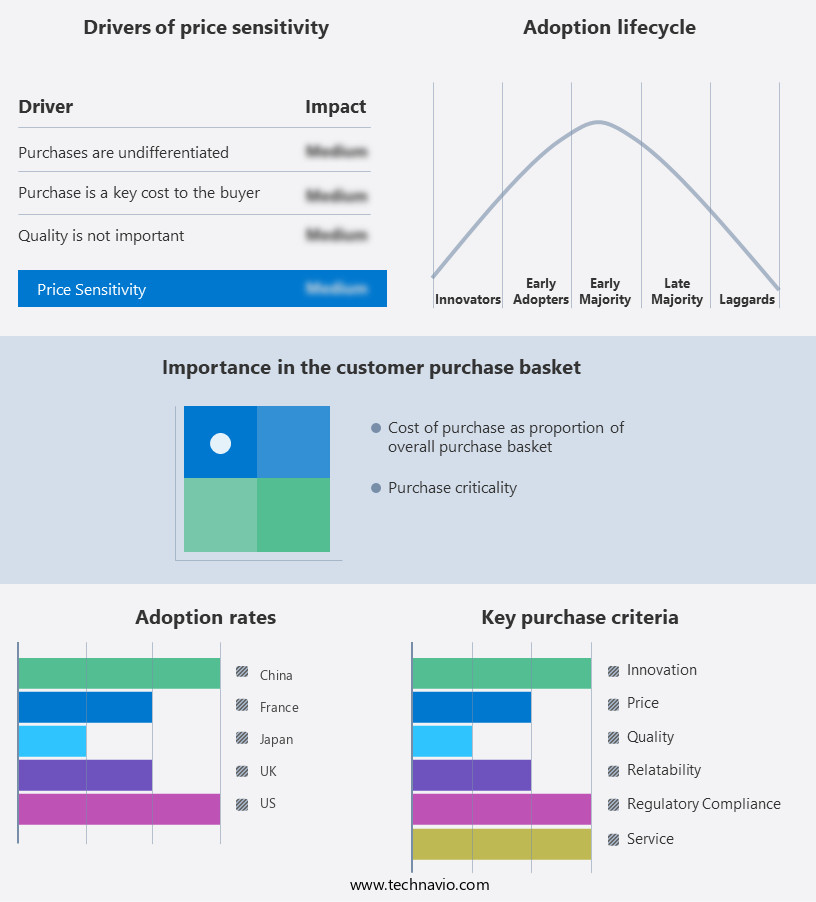
The software-defined radio (SDR) market forecasting report includes the adoption lifecycle of the market, covering from the innovator's stage to the laggard's stage. It focuses on adoption rates in different regions based on penetration. Furthermore, the software-defined radio (SDR) market report also includes key purchase criteria and drivers of price sensitivity to help companies evaluate and develop their market growth analysis strategies.

Customer Landscape
Key Companies & Market Insights
Companies are implementing various strategies, such as strategic alliances, software-defined radio (SDR) market forecast, partnerships, mergers and acquisitions, geographical expansion, and product/service launches, to enhance their presence in the industry.
Analog Devices Inc. - The Fire Series brand from the company showcases the AN ARC231A Software Defined Radio (SDR) Communications System, a cutting-edge technology solution.
The industry research and growth report includes detailed analyses of the competitive landscape of the market and information about key companies, including:
- Analog Devices Inc.
- BAE Systems Plc
- Bharat Electronics Ltd.
- Elbit Systems Ltd.
- General Dynamics Corp.
- Huawei Technologies Co. Ltd.
- Indra Sistemas SA
- L3Harris Technologies Inc.
- Leonardo Spa
- Northrop Grumman Corp.
- NXP Semiconductors NV
- Rafael Advanced Defense Systems Ltd.
- Rohde and Schwarz GmbH and Co. KG
- Rolta India Ltd.
- RTX Corp.
- Texas Instruments Inc.
- Thales Group
- Ultra Electronics Holdings Plc
- Viasat Inc.
- ZTE Corp.
Qualitative and quantitative analysis of companies has been conducted to help clients understand the wider business environment as well as the strengths and weaknesses of key industry players. Data is qualitatively analyzed to categorize companies as pure play, category-focused, industry-focused, and diversified; it is quantitatively analyzed to categorize companies as dominant, leading, strong, tentative, and weak.
Research Analyst Overview
Software-defined radio (SDR) technology has revolutionized the wireless communication landscape by enabling flexible, adaptable, and cost-effective solutions. This technology allows the processing of radio frequency (RF) signals in software rather than relying on traditional hardware components. The SDR market encompasses various applications, from wireless communication and scientific research to military communications and satellite communication. Digital signal processing (DSP) plays a pivotal role in SDR systems, facilitating the conversion of RF signals into digital form. Cognitive radio, a subset of SDR, incorporates spectrum sensing and dynamic spectrum access capabilities, enabling efficient utilization of the radio spectrum. SDR's versatility extends to various industries, including wireless communication networks, satellite communication, air traffic control, and industrial automation.
Cost optimization, flexibility, and reconfigurability are essential factors driving the adoption of SDR technology. Performance, bandwidth, frequency range, power consumption, and latency are critical considerations for SDR system design. The SDR market offers numerous opportunities for innovation and growth in various industries. The technology's flexibility, cost-effectiveness, and adaptability make it a valuable asset for wireless communication systems and scientific research. As the SDR ecosystem continues to evolve, we can expect further advancements in performance, security, and interoperability.
Market Scope
|
Report Coverage
|
Details
|
Page number
|
199
|
Base year
|
2024
|
Historic period
|
2019-2023 |
Forecast period
|
2025-2029
|
Growth momentum & CAGR
|
Accelerate at a CAGR of 10.4%
|
Market growth 2025-2029
|
USD 20.35 billion
|
Market structure
|
Fragmented
|
YoY growth 2024-2025(%)
|
8.5
|
Key countries
|
US, China, Canada, UK, Germany, Japan, India, France, Italy, and South Korea
|
Competitive landscape
|
Leading Companies, Market Positioning of Companies, Competitive Strategies, and Industry Risks
|
Request Free Sample
What are the Key Data Covered in this Software-Defined Radio (SDR) Market Research and Growth Report?
- CAGR of the Software-Defined Radio (SDR) industry during the forecast period
- Detailed information on factors that will drive the growth and forecasting between 2025 and 2029
- Precise estimation of the size of the market and its contribution of the industry in focus to the parent market
- Accurate predictions about upcoming growth and trends and changes in consumer behaviour
- Growth of the market across North America, Europe, APAC, South America, and Middle East and Africa
- Thorough analysis of the market's competitive landscape and detailed information about companies
- Comprehensive analysis of factors that will challenge the software-defined radio (SDR) market growth of industry companies
We can help! Our analysts can customize this software-defined radio (SDR) market research report to meet your requirements.
Get in touch
1 Executive Summary
- 1.1 Market overview
- Executive Summary - Chart on Market Overview
- Executive Summary - Data Table on Market Overview
- Executive Summary - Chart on Global Market Characteristics
- Executive Summary - Chart on Market by Geography
- Executive Summary - Chart on Market Segmentation by Application
- Executive Summary - Chart on Market Segmentation by Type
- Executive Summary - Chart on Incremental Growth
- Executive Summary - Data Table on Incremental Growth
- Executive Summary - Chart on Company Market Positioning
2 Technavio Analysis
- 2.1 Analysis of price sensitivity, lifecycle, customer purchase basket, adoption rates, and purchase criteria
- Analysis of price sensitivity, lifecycle, customer purchase basket, adoption rates, and purchase criteria
- 2.2 Criticality of inputs and Factors of differentiation
- Overview on criticality of inputs and factors of differentiation
- 2.3 Factors of disruption
- Overview on factors of disruption
- 2.4 Impact of drivers and challenges
- Impact of drivers and challenges in 2024 and 2029
3 Market Landscape
- 3.1 Market ecosystem
- Parent Market
- Data Table on - Parent Market
- 3.2 Market characteristics
- Market characteristics analysis
4 Market Sizing
- 4.1 Market definition
- Offerings of companies included in the market definition
- 4.2 Market segment analysis
- 4.4 Market outlook: Forecast for 2024-2029
- Chart on Global - Market size and forecast 2024-2029 ($ million)
- Data Table on Global - Market size and forecast 2024-2029 ($ million)
- Chart on Global Market: Year-over-year growth 2024-2029 (%)
- Data Table on Global Market: Year-over-year growth 2024-2029 (%)
5 Historic Market Size
- 5.1 Global Software-Defined Radio (SDR) Market 2019 - 2023
- Historic Market Size - Data Table on Global Software-Defined Radio (SDR) Market 2019 - 2023 ($ million)
- 5.2 Application segment analysis 2019 - 2023
- Historic Market Size - Application Segment 2019 - 2023 ($ million)
- 5.3 Type segment analysis 2019 - 2023
- Historic Market Size - Type Segment 2019 - 2023 ($ million)
- 5.4 Geography segment analysis 2019 - 2023
- Historic Market Size - Geography Segment 2019 - 2023 ($ million)
- 5.5 Country segment analysis 2019 - 2023
- Historic Market Size - Country Segment 2019 - 2023 ($ million)
6 Qualitative Analysis
- 6.1 Impact of AI on the Global Software-Defined Radio (SDR) Market
7 Five Forces Analysis
- 7.1 Five forces summary
- Five forces analysis - Comparison between 2024 and 2029
- 7.2 Bargaining power of buyers
- Bargaining power of buyers - Impact of key factors 2024 and 2029
- 7.3 Bargaining power of suppliers
- Bargaining power of suppliers - Impact of key factors in 2024 and 2029
- 7.4 Threat of new entrants
- Threat of new entrants - Impact of key factors in 2024 and 2029
- 7.5 Threat of substitutes
- Threat of substitutes - Impact of key factors in 2024 and 2029
- 7.6 Threat of rivalry
- Threat of rivalry - Impact of key factors in 2024 and 2029
- 7.7 Market condition
- Chart on Market condition - Five forces 2024 and 2029
8 Market Segmentation by Application
- 8.1 Market segments
- Chart on Application - Market share (2024-2029) (%)
- Data Table on Application - Market share (2024-2029) (%)
- 8.2 Comparison by Application
- Chart on Comparison by Application
- Data Table on Comparison by Application
- 8.3 Defense - Market size and forecast (2024-2029)
- Chart on Defense - Market size and forecast (2024-2029) ($ million)
- Data Table on Defense - Market size and forecast (2024-2029) ($ million)
- Chart on Defense - Year-over-year growth (2024-2029) (%)
- Data Table on Defense - Year-over-year growth (2024-2029) (%)
- 8.4 Homeland security - Market size and forecast (2024-2029)
- Chart on Homeland security - Market size and forecast (2024-2029) ($ million)
- Data Table on Homeland security - Market size and forecast (2024-2029) ($ million)
- Chart on Homeland security - Year-over-year growth (2024-2029) (%)
- Data Table on Homeland security - Year-over-year growth (2024-2029) (%)
- 8.5 Commercial - Market size and forecast (2024-2029)
- Chart on Commercial - Market size and forecast (2024-2029) ($ million)
- Data Table on Commercial - Market size and forecast (2024-2029) ($ million)
- Chart on Commercial - Year-over-year growth (2024-2029) (%)
- Data Table on Commercial - Year-over-year growth (2024-2029) (%)
- 8.6 Market opportunity by Application
- Market opportunity by Application ($ million)
- Data Table on Market opportunity by Application ($ million)
9 Market Segmentation by Type
- 9.1 Market segments
- Chart on Type - Market share (2024-2029) (%)
- Data Table on Type - Market share (2024-2029) (%)
- 9.2 Comparison by Type
- Chart on Comparison by Type
- Data Table on Comparison by Type
- 9.3 Joint tactical radio system - Market size and forecast (2024-2029)
- Chart on Joint tactical radio system - Market size and forecast (2024-2029) ($ million)
- Data Table on Joint tactical radio system - Market size and forecast (2024-2029) ($ million)
- Chart on Joint tactical radio system - Year-over-year growth (2024-2029) (%)
- Data Table on Joint tactical radio system - Year-over-year growth (2024-2029) (%)
- 9.4 Cognitive radio - Market size and forecast (2024-2029)
- Chart on Cognitive radio - Market size and forecast (2024-2029) ($ million)
- Data Table on Cognitive radio - Market size and forecast (2024-2029) ($ million)
- Chart on Cognitive radio - Year-over-year growth (2024-2029) (%)
- Data Table on Cognitive radio - Year-over-year growth (2024-2029) (%)
- 9.5 General purpose radio - Market size and forecast (2024-2029)
- Chart on General purpose radio - Market size and forecast (2024-2029) ($ million)
- Data Table on General purpose radio - Market size and forecast (2024-2029) ($ million)
- Chart on General purpose radio - Year-over-year growth (2024-2029) (%)
- Data Table on General purpose radio - Year-over-year growth (2024-2029) (%)
- 9.6 Terrestrial trunked radio - Market size and forecast (2024-2029)
- Chart on Terrestrial trunked radio - Market size and forecast (2024-2029) ($ million)
- Data Table on Terrestrial trunked radio - Market size and forecast (2024-2029) ($ million)
- Chart on Terrestrial trunked radio - Year-over-year growth (2024-2029) (%)
- Data Table on Terrestrial trunked radio - Year-over-year growth (2024-2029) (%)
- 9.7 Market opportunity by Type
- Market opportunity by Type ($ million)
- Data Table on Market opportunity by Type ($ million)
10 Market Segmentation by Frequency Band
- 10.1 Market segments
- Chart on Frequency Band - Market share (2024-2029) (%)
- Data Table on Frequency Band - Market share (2024-2029) (%)
- 10.2 Comparison by Frequency Band
- Chart on Comparison by Frequency Band
- Data Table on Comparison by Frequency Band
- 10.3 HF - Market size and forecast (2024-2029)
- Chart on HF - Market size and forecast (2024-2029) ($ million)
- Data Table on HF - Market size and forecast (2024-2029) ($ million)
- Chart on HF - Year-over-year growth (2024-2029) (%)
- Data Table on HF - Year-over-year growth (2024-2029) (%)
- 10.4 VHF - Market size and forecast (2024-2029)
- Chart on VHF - Market size and forecast (2024-2029) ($ million)
- Data Table on VHF - Market size and forecast (2024-2029) ($ million)
- Chart on VHF - Year-over-year growth (2024-2029) (%)
- Data Table on VHF - Year-over-year growth (2024-2029) (%)
- 10.5 UHF - Market size and forecast (2024-2029)
- Chart on UHF - Market size and forecast (2024-2029) ($ million)
- Data Table on UHF - Market size and forecast (2024-2029) ($ million)
- Chart on UHF - Year-over-year growth (2024-2029) (%)
- Data Table on UHF - Year-over-year growth (2024-2029) (%)
- 10.6 Market opportunity by Frequency Band
- Market opportunity by Frequency Band ($ million)
- Data Table on Market opportunity by Frequency Band ($ million)
11 Market Segmentation by Platform
- 11.1 Market segments
- Chart on Platform - Market share (2024-2029) (%)
- Data Table on Platform - Market share (2024-2029) (%)
- 11.2 Comparison by Platform
- Chart on Comparison by Platform
- Data Table on Comparison by Platform
- 11.3 Ground - Market size and forecast (2024-2029)
- Chart on Ground - Market size and forecast (2024-2029) ($ million)
- Data Table on Ground - Market size and forecast (2024-2029) ($ million)
- Chart on Ground - Year-over-year growth (2024-2029) (%)
- Data Table on Ground - Year-over-year growth (2024-2029) (%)
- 11.4 Naval - Market size and forecast (2024-2029)
- Chart on Naval - Market size and forecast (2024-2029) ($ million)
- Data Table on Naval - Market size and forecast (2024-2029) ($ million)
- Chart on Naval - Year-over-year growth (2024-2029) (%)
- Data Table on Naval - Year-over-year growth (2024-2029) (%)
- 11.5 Market opportunity by Platform
- Market opportunity by Platform ($ million)
- Data Table on Market opportunity by Platform ($ million)
12 Market Segmentation by Components
- 12.1 Market segments
- Chart on Components - Market share (2024-2029) (%)
- Data Table on Components - Market share (2024-2029) (%)
- 12.2 Comparison by Components
- Chart on Comparison by Components
- Data Table on Comparison by Components
- 12.3 Hardware - Market size and forecast (2024-2029)
- Chart on Hardware - Market size and forecast (2024-2029) ($ million)
- Data Table on Hardware - Market size and forecast (2024-2029) ($ million)
- Chart on Hardware - Year-over-year growth (2024-2029) (%)
- Data Table on Hardware - Year-over-year growth (2024-2029) (%)
- 12.4 Software - Market size and forecast (2024-2029)
- Chart on Software - Market size and forecast (2024-2029) ($ million)
- Data Table on Software - Market size and forecast (2024-2029) ($ million)
- Chart on Software - Year-over-year growth (2024-2029) (%)
- Data Table on Software - Year-over-year growth (2024-2029) (%)
- 12.5 Services - Market size and forecast (2024-2029)
- Chart on Services - Market size and forecast (2024-2029) ($ million)
- Data Table on Services - Market size and forecast (2024-2029) ($ million)
- Chart on Services - Year-over-year growth (2024-2029) (%)
- Data Table on Services - Year-over-year growth (2024-2029) (%)
- 12.6 Market opportunity by Components
- Market opportunity by Components ($ million)
- Data Table on Market opportunity by Components ($ million)
13 Customer Landscape
- 13.1 Customer landscape overview
- Analysis of price sensitivity, lifecycle, customer purchase basket, adoption rates, and purchase criteria
14 Geographic Landscape
- 14.1 Geographic segmentation
- Chart on Market share by geography 2024-2029 (%)
- Data Table on Market share by geography 2024-2029 (%)
- 14.2 Geographic comparison
- Chart on Geographic comparison
- Data Table on Geographic comparison
- 14.3 North America - Market size and forecast 2024-2029
- Chart on North America - Market size and forecast 2024-2029 ($ million)
- Data Table on North America - Market size and forecast 2024-2029 ($ million)
- Chart on North America - Year-over-year growth 2024-2029 (%)
- Data Table on North America - Year-over-year growth 2024-2029 (%)
- 14.4 Europe - Market size and forecast 2024-2029
- Chart on Europe - Market size and forecast 2024-2029 ($ million)
- Data Table on Europe - Market size and forecast 2024-2029 ($ million)
- Chart on Europe - Year-over-year growth 2024-2029 (%)
- Data Table on Europe - Year-over-year growth 2024-2029 (%)
- 14.5 APAC - Market size and forecast 2024-2029
- Chart on APAC - Market size and forecast 2024-2029 ($ million)
- Data Table on APAC - Market size and forecast 2024-2029 ($ million)
- Chart on APAC - Year-over-year growth 2024-2029 (%)
- Data Table on APAC - Year-over-year growth 2024-2029 (%)
- 14.6 South America - Market size and forecast 2024-2029
- Chart on South America - Market size and forecast 2024-2029 ($ million)
- Data Table on South America - Market size and forecast 2024-2029 ($ million)
- Chart on South America - Year-over-year growth 2024-2029 (%)
- Data Table on South America - Year-over-year growth 2024-2029 (%)
- 14.7 Middle East and Africa - Market size and forecast 2024-2029
- Chart on Middle East and Africa - Market size and forecast 2024-2029 ($ million)
- Data Table on Middle East and Africa - Market size and forecast 2024-2029 ($ million)
- Chart on Middle East and Africa - Year-over-year growth 2024-2029 (%)
- Data Table on Middle East and Africa - Year-over-year growth 2024-2029 (%)
- 14.8 US - Market size and forecast 2024-2029
- Chart on US - Market size and forecast 2024-2029 ($ million)
- Data Table on US - Market size and forecast 2024-2029 ($ million)
- Chart on US - Year-over-year growth 2024-2029 (%)
- Data Table on US - Year-over-year growth 2024-2029 (%)
- 14.9 China - Market size and forecast 2024-2029
- Chart on China - Market size and forecast 2024-2029 ($ million)
- Data Table on China - Market size and forecast 2024-2029 ($ million)
- Chart on China - Year-over-year growth 2024-2029 (%)
- Data Table on China - Year-over-year growth 2024-2029 (%)
- 14.10 Canada - Market size and forecast 2024-2029
- Chart on Canada - Market size and forecast 2024-2029 ($ million)
- Data Table on Canada - Market size and forecast 2024-2029 ($ million)
- Chart on Canada - Year-over-year growth 2024-2029 (%)
- Data Table on Canada - Year-over-year growth 2024-2029 (%)
- 14.11 UK - Market size and forecast 2024-2029
- Chart on UK - Market size and forecast 2024-2029 ($ million)
- Data Table on UK - Market size and forecast 2024-2029 ($ million)
- Chart on UK - Year-over-year growth 2024-2029 (%)
- Data Table on UK - Year-over-year growth 2024-2029 (%)
- 14.12 Japan - Market size and forecast 2024-2029
- Chart on Japan - Market size and forecast 2024-2029 ($ million)
- Data Table on Japan - Market size and forecast 2024-2029 ($ million)
- Chart on Japan - Year-over-year growth 2024-2029 (%)
- Data Table on Japan - Year-over-year growth 2024-2029 (%)
- 14.13 India - Market size and forecast 2024-2029
- Chart on India - Market size and forecast 2024-2029 ($ million)
- Data Table on India - Market size and forecast 2024-2029 ($ million)
- Chart on India - Year-over-year growth 2024-2029 (%)
- Data Table on India - Year-over-year growth 2024-2029 (%)
- 14.14 Germany - Market size and forecast 2024-2029
- Chart on Germany - Market size and forecast 2024-2029 ($ million)
- Data Table on Germany - Market size and forecast 2024-2029 ($ million)
- Chart on Germany - Year-over-year growth 2024-2029 (%)
- Data Table on Germany - Year-over-year growth 2024-2029 (%)
- 14.15 France - Market size and forecast 2024-2029
- Chart on France - Market size and forecast 2024-2029 ($ million)
- Data Table on France - Market size and forecast 2024-2029 ($ million)
- Chart on France - Year-over-year growth 2024-2029 (%)
- Data Table on France - Year-over-year growth 2024-2029 (%)
- 14.16 Italy - Market size and forecast 2024-2029
- Chart on Italy - Market size and forecast 2024-2029 ($ million)
- Data Table on Italy - Market size and forecast 2024-2029 ($ million)
- Chart on Italy - Year-over-year growth 2024-2029 (%)
- Data Table on Italy - Year-over-year growth 2024-2029 (%)
- 14.17 South Korea - Market size and forecast 2024-2029
- Chart on South Korea - Market size and forecast 2024-2029 ($ million)
- Data Table on South Korea - Market size and forecast 2024-2029 ($ million)
- Chart on South Korea - Year-over-year growth 2024-2029 (%)
- Data Table on South Korea - Year-over-year growth 2024-2029 (%)
- 14.18 Market opportunity by geography
- Market opportunity by geography ($ million)
- Data Tables on Market opportunity by geography ($ million)
- 14.19 Rest of World (ROW) - Market size and forecast (2024-2029)
- Chart on Rest of World (ROW) - Market size and forecast (2024-2029) ($ million)
- Data Table on Rest of World (ROW) - Market size and forecast (2024-2029) ($ million)
- Chart on Rest of World (ROW) - Year-over-year growth (2024-2029) (%)
- Data Table on Rest of World (ROW) - Year-over-year growth (2024-2029) (%)
15 Drivers, Challenges, and Opportunity/Restraints
- 15.3 Impact of drivers and challenges
- Impact of drivers and challenges in 2024 and 2029
- 15.4 Market opportunities/restraints
16 Competitive Landscape
- 16.2 Competitive Landscape
- Overview on criticality of inputs and factors of differentiation
- 16.3 Landscape disruption
- Overview on factors of disruption
- 16.4 Industry risks
- Impact of key risks on business
17 Competitive Analysis
- 17.2 Company ranking index
- 17.3 Market positioning of companies
- Matrix on companies position and classification
- 17.4 BAE Systems Plc
- BAE Systems Plc - Overview
- BAE Systems Plc - Business segments
- BAE Systems Plc - Key news
- BAE Systems Plc - Key offerings
- BAE Systems Plc - Segment focus
- SWOT
- 17.5 Elbit Systems Ltd.
- Elbit Systems Ltd. - Overview
- Elbit Systems Ltd. - Product / Service
- Elbit Systems Ltd. - Key news
- Elbit Systems Ltd. - Key offerings
- SWOT
- 17.6 General Dynamics Corp.
- General Dynamics Corp. - Overview
- General Dynamics Corp. - Business segments
- General Dynamics Corp. - Key news
- General Dynamics Corp. - Key offerings
- General Dynamics Corp. - Segment focus
- SWOT
- 17.7 Huawei Technologies Co. Ltd.
- Huawei Technologies Co. Ltd. - Overview
- Huawei Technologies Co. Ltd. - Product / Service
- Huawei Technologies Co. Ltd. - Key news
- Huawei Technologies Co. Ltd. - Key offerings
- SWOT
- 17.8 Indra Sistemas SA
- Indra Sistemas SA - Overview
- Indra Sistemas SA - Business segments
- Indra Sistemas SA - Key news
- Indra Sistemas SA - Key offerings
- Indra Sistemas SA - Segment focus
- SWOT
- 17.9 L3Harris Technologies Inc.
- L3Harris Technologies Inc. - Overview
- L3Harris Technologies Inc. - Business segments
- L3Harris Technologies Inc. - Key news
- L3Harris Technologies Inc. - Key offerings
- L3Harris Technologies Inc. - Segment focus
- SWOT
- 17.10 Leonardo Spa
- Leonardo Spa - Overview
- Leonardo Spa - Business segments
- Leonardo Spa - Key offerings
- Leonardo Spa - Segment focus
- SWOT
- 17.11 Northrop Grumman Corp.
- Northrop Grumman Corp. - Overview
- Northrop Grumman Corp. - Business segments
- Northrop Grumman Corp. - Key news
- Northrop Grumman Corp. - Key offerings
- Northrop Grumman Corp. - Segment focus
- SWOT
- 17.12 NXP Semiconductors NV
- NXP Semiconductors NV - Overview
- NXP Semiconductors NV - Product / Service
- NXP Semiconductors NV - Key offerings
- SWOT
- 17.13 Rohde and Schwarz GmbH and Co. KG
- Rohde and Schwarz GmbH and Co. KG - Overview
- Rohde and Schwarz GmbH and Co. KG - Product / Service
- Rohde and Schwarz GmbH and Co. KG - Key offerings
- SWOT
- 17.14 RTX Corp.
- RTX Corp. - Overview
- RTX Corp. - Business segments
- RTX Corp. - Key news
- RTX Corp. - Key offerings
- RTX Corp. - Segment focus
- SWOT
- 17.15 Texas Instruments Inc.
- Texas Instruments Inc. - Overview
- Texas Instruments Inc. - Business segments
- Texas Instruments Inc. - Key offerings
- Texas Instruments Inc. - Segment focus
- SWOT
- 17.16 Thales Group
- Thales Group - Overview
- Thales Group - Business segments
- Thales Group - Key news
- Thales Group - Key offerings
- Thales Group - Segment focus
- SWOT
- 17.17 Ultra Electronics Holdings Plc
- Ultra Electronics Holdings Plc - Overview
- Ultra Electronics Holdings Plc - Product / Service
- Ultra Electronics Holdings Plc - Key offerings
- SWOT
- 17.18 Viasat Inc.
- Viasat Inc. - Overview
- Viasat Inc. - Business segments
- Viasat Inc. - Key news
- Viasat Inc. - Key offerings
- Viasat Inc. - Segment focus
- SWOT
18 Appendix
- 18.2 Inclusions and exclusions checklist
- Inclusions checklist
- Exclusions checklist
- 18.3 Currency conversion rates for US$
- Currency conversion rates for US$
- 18.4 Research methodology
- 18.7 Validation techniques employed for market sizing
- Validation techniques employed for market sizing
- 18.9 360 degree market analysis
- 360 degree market analysis
- 18.10 List of abbreviations