Software Testing Services Market Analysis, Size, and Forecast 2026-2030: North America (US, Canada, and Mexico), Europe (UK, Germany, and France), APAC (China, India, and Japan), South America (Brazil, Argentina, and Colombia), Middle East and Africa (UAE, Saudi Arabia, and South Africa), and Rest of World (ROW)

Software Testing Services Market Analysis, Size, and Forecast 2026-2030:
North America (US, Canada, and Mexico), Europe (UK, Germany, and France), APAC (China, India, and Japan), South America (Brazil, Argentina, and Colombia), Middle East and Africa (UAE, Saudi Arabia, and South Africa), and Rest of World (ROW)

Published: Mar 2026 315 Pages SKU: IRTNTR40590

Market Overview at a Glance

$27.61 B
Market Opportunity
11.7%
CAGR 2025 - 2030
42.8%
North America Growth
$18.75 B
Functional segment 2024

Software Testing Services Market Size 2026-2030

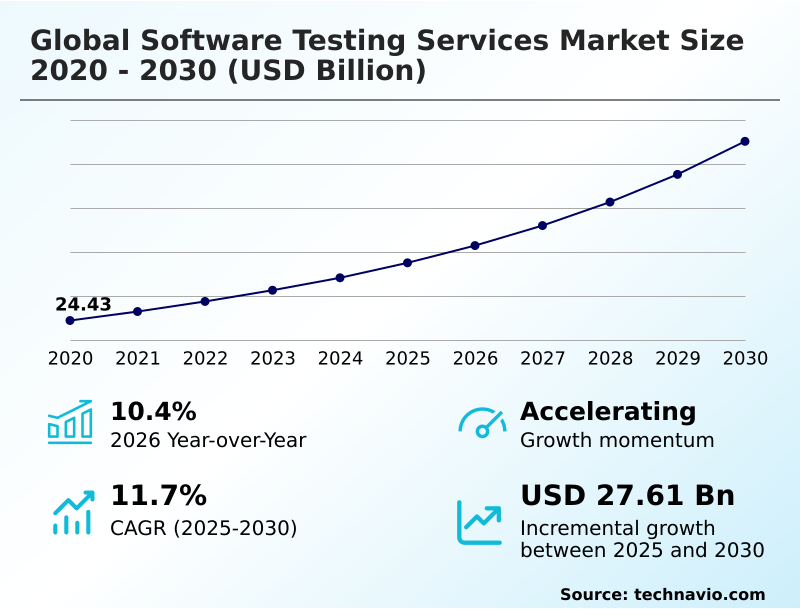
The software testing services market size is valued to increase by USD 27.61 billion, at a CAGR of 11.7% from 2025 to 2030. Pervasive digital transformation and escalating software complexity will drive the software testing services market.

Major Market Trends & Insights

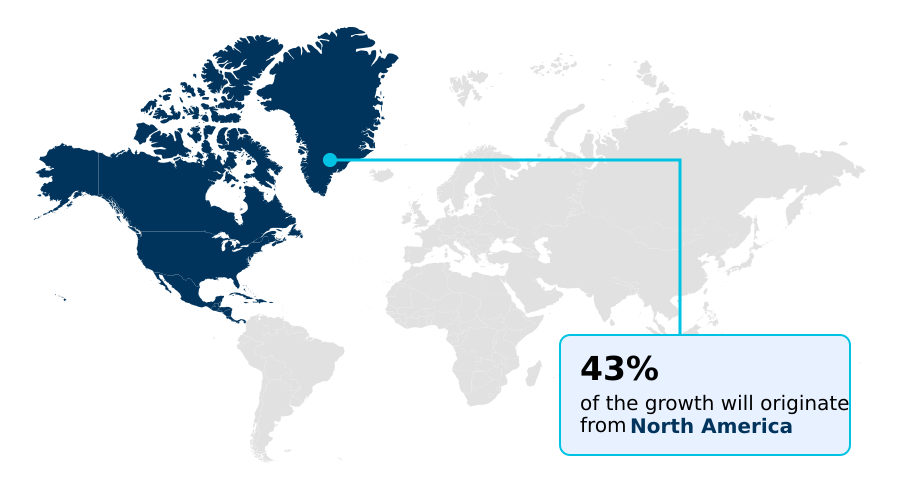
  • North America dominated the market and accounted for a 42.8% growth during the forecast period.
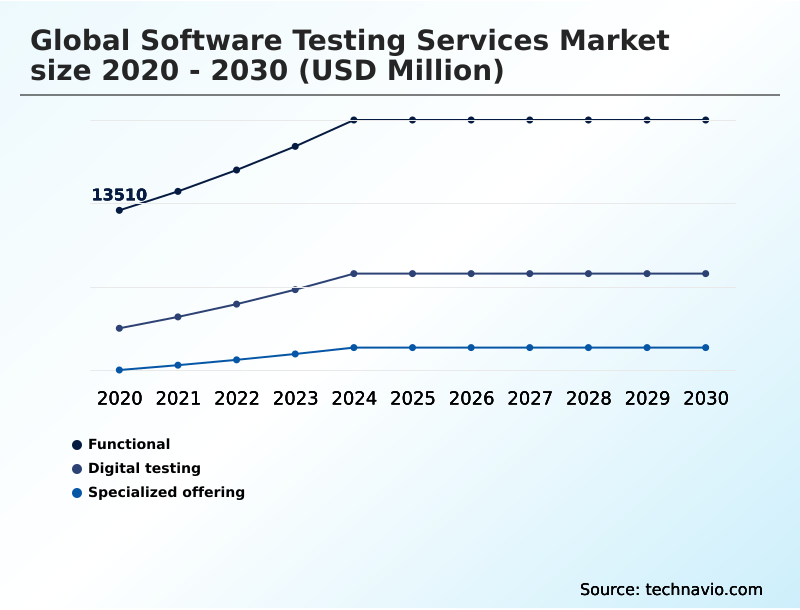
  • By Service - Functional segment was valued at USD 18.75 billion in 2024
  • By End-user - BFSI segment accounted for the largest market revenue share in 2024

Market Size & Forecast

  • Market Opportunities: USD 40.72 billion
  • Market Future Opportunities: USD 27.61 billion
  • CAGR from 2025 to 2030 : 11.7%

Market Summary

  • The software testing services market is undergoing a significant transformation, driven by the dual imperatives of digital acceleration and heightened software complexity. As enterprises adopt modern architectures like microservices and cloud-native applications, the need for robust quality assurance moves beyond simple defect detection to become a strategic business function.
  • This evolution fuels demand for advanced capabilities, particularly in test automation, performance engineering, and cybersecurity validation. The integration of AI and machine learning is a key trend, enabling intelligent test case generation and predictive analytics to identify high-risk areas.
  • In a business scenario involving a global logistics company, a failure in the supply chain management software could cause cascading delays, impacting thousands of deliveries. To prevent this, continuous testing is integrated into the DevOps pipeline, where automated scripts validate every code change in real-time.
  • This 'shift-left' approach ensures quality is built in from the start, mitigating risks and ensuring the reliability of mission-critical systems. However, the market faces a significant challenge in the acute shortage of skilled professionals, particularly software development engineers in test (SDETs) who possess the hybrid skills needed for modern quality engineering.

What will be the Size of the Software Testing Services Market during the forecast period?

Get Key Insights on Market Forecast (PDF) Request Free Sample

How is the Software Testing Services Market Segmented?

The software testing services industry research report provides comprehensive data (region-wise segment analysis), with forecasts and estimates in "USD million" for the period 2026-2030, as well as historical data from 2020-2024 for the following segments.

  • Service
    • Functional
    • Digital testing
    • Specialized offering
  • End-user
    • BFSI
    • Telecom and media
    • Manufacturing
    • Retail
    • Others
  • Product
    • Application testing
    • Product testing
  • Geography
    • North America
      • US
      • Canada
      • Mexico
    • Europe
      • UK
      • Germany
      • France
    • APAC
      • China
      • India
      • Japan
    • South America
      • Brazil
      • Argentina
      • Colombia
    • Middle East and Africa
      • UAE
      • Saudi Arabia
      • South Africa
    • Rest of World (ROW)

By Service Insights

The functional segment is estimated to witness significant growth during the forecast period.

The software testing services market segmentation reveals that functional validation remains a cornerstone, focused on verifying software against design specifications and business logic. This includes crucial activities like unit testing, system testing, and regression testing to prevent defects.

Service providers are enhancing this segment by moving beyond manual testing and adopting advanced test automation frameworks.

This shift toward intelligent automation is critical for managing complex software environments, where a data-driven approach can improve defect detection efficacy by over 15%.

This evolution makes functional testing a strategic enabler for reliable software delivery, incorporating AI in quality assurance and specialized testing domains to meet modern digital demands, ensuring robust test data management and improved test coverage.

Request Free Sample

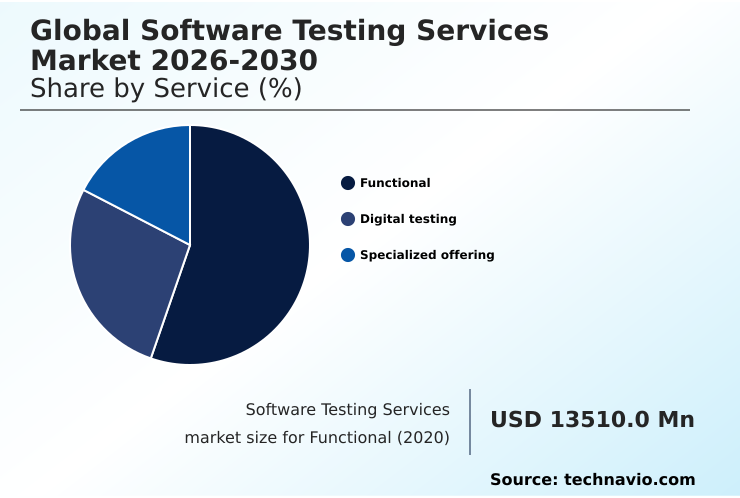
The Functional segment was valued at USD 18.75 billion in 2024 and showed a gradual increase during the forecast period.

Request Free Sample

Regional Analysis

North America is estimated to contribute 42.8% to the growth of the global market during the forecast period.Technavio’s analysts have elaborately explained the regional trends and drivers that shape the market during the forecast period.

See How Software Testing Services Market Demand is Rising in North America Request Free Sample

The global software testing services market exhibits distinct regional dynamics, with North America representing the largest segment, contributing over 42% of the incremental growth.

This dominance is driven by the region's early adoption of agile and DevOps methodologies and stringent regulatory demands in sectors like finance and healthcare. The focus here is on AI-powered visual testing and intelligent automation to manage complex software.

In contrast, the APAC region is the fastest-growing market, propelled by its role as a global IT outsourcing hub and a booming domestic digital economy.

In countries like India and China, the demand is fueled by mobile application compatibility testing for a massive consumer base.

European markets, led by Germany and the UK, prioritize security and embedded software testing, reflecting the needs of their strong automotive and financial technology industries. This geographic segmentation highlights a shift toward specialized, region-specific QA and testing services.

Market Dynamics

Our researchers analyzed the data with 2025 as the base year, along with the key drivers, trends, and challenges. A holistic analysis of drivers will help companies refine their marketing strategies to gain a competitive advantage.

  • As organizations navigate digital transformation, understanding the nuances of modern quality assurance becomes critical. A key consideration is the cost of manual vs automated regression testing, where automation consistently delivers a higher ROI by reducing cycle times and freeing up resources. Implementing self-healing test automation scripts further enhances this value, drastically cutting down on maintenance overhead.
  • Another vital area is establishing best practices for microservices api contract testing, which is essential for ensuring stability in distributed architectures. Businesses are also evaluating how to integrate SAST into the CI/CD pipeline effectively, shifting security validation to earlier stages of development.
  • The challenges of IoT device interoperability testing require specialized strategies to validate performance across a fragmented ecosystem of hardware and protocols. Furthermore, the debate over in-house qa vs outsourced software testing services continues, with many firms finding that outsourcing provides access to specialized skills and advanced tools that are difficult to cultivate internally.
  • Organizations that master these advanced testing disciplines often report significantly fewer production defects compared to those using traditional methods, directly impacting customer satisfaction and brand loyalty.

What are the key market drivers leading to the rise in the adoption of Software Testing Services Industry?

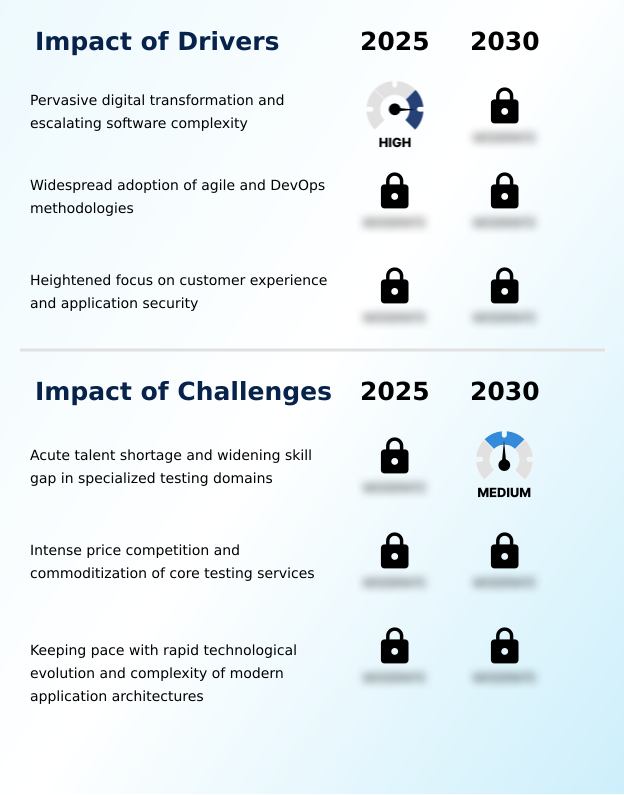
  • Pervasive digital transformation and escalating software complexity are primary drivers for the software testing services market.

  • The enterprise-wide adoption of digital transformation initiatives is a primary driver for the global software testing services market. As organizations shift to complex digital ecosystems built on microservices and cloud-native applications, the need for comprehensive testing escalates.
  • This architectural complexity, combined with the proliferation of IoT devices and AI, often exceeds the capabilities of in-house teams. For example, ensuring interoperability across diverse platforms can increase testing efforts by over 50%.
  • This capability gap creates a compelling case for engaging third-party providers who offer specialized expertise in end-to-end system testing and API validation.
  • Their services are critical for mitigating the risks associated with deploying mission-critical applications, ensuring reliability and functionality in intricate IT environments and validating a secure software development lifecycle.

What are the market trends shaping the Software Testing Services Industry?

  • The proliferation of artificial intelligence and machine learning in quality assurance is a dominant trend, marking a paradigm shift from traditional test automation to intelligent and autonomous testing.

  • A dominant trend is the integration of artificial intelligence into the quality assurance lifecycle, enabling a shift to intelligent, autonomous testing. Service providers are leveraging machine learning for test case optimization, with data-driven approaches improving test coverage by up to 25%. This technology facilitates predictive analytics for quality, allowing teams to focus resources on high-risk modules.
  • Furthermore, AI-powered visual testing is revolutionizing UI validation, detecting inconsistencies with near-perfect accuracy. The development of self-healing automation scripts, which adapt to UI changes, addresses a major challenge in test automation by reducing maintenance costs by over 40%.
  • This evolution is compelling providers to offer high-value, technology-driven solutions, making AI-powered testing platforms a key competitive differentiator for delivering faster and more effective QA outcomes.

What challenges does the Software Testing Services Industry face during its growth?

  • An acute talent shortage and a widening skill gap in specialized testing domains represent a key challenge affecting industry growth.

  • A formidable challenge confronting the market is the acute shortage of skilled professionals, particularly software development engineers in test (SDETs). Modern DevOps environments demand a hybrid skill set combining deep testing expertise with strong development capabilities, a profile for which talent is scarce.
  • This scarcity intensifies competition, driving up labor costs by as much as 20% in key markets and pressuring provider margins. The deficit is even more pronounced in specialized testing domains like application security and AI model validation, where the talent pool is exceptionally limited.
  • This skills gap directly constrains the ability of service providers to scale operations, forcing substantial investment in internal training programs and impacting their capacity to meet complex client demands.

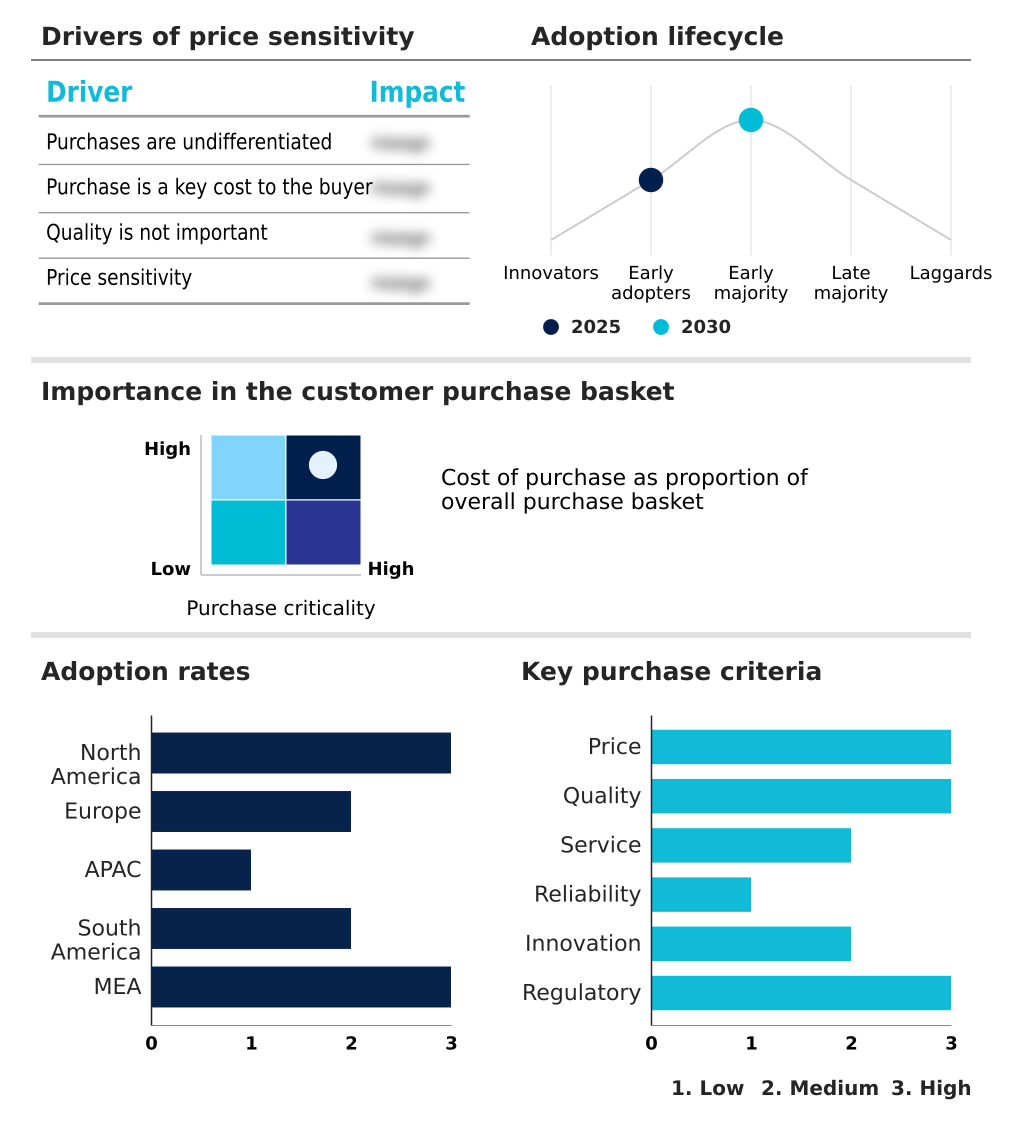
Exclusive Technavio Analysis on Customer Landscape

The software testing services market forecasting report includes the adoption lifecycle of the market, covering from the innovator’s stage to the laggard’s stage. It focuses on adoption rates in different regions based on penetration. Furthermore, the software testing services market report also includes key purchase criteria and drivers of price sensitivity to help companies evaluate and develop their market growth analysis strategies.

Customer Landscape of Software Testing Services Industry

Competitive Landscape

Companies are implementing various strategies, such as strategic alliances, software testing services market forecast, partnerships, mergers and acquisitions, geographical expansion, and product/service launches, to enhance their presence in the industry.

Accenture Plc - Offerings center on intelligent quality engineering and AI-driven automation, providing scalable, end-to-end validation for enterprise digital transformation and accelerated time-to-market.

The industry research and growth report includes detailed analyses of the competitive landscape of the market and information about key companies, including:

  • Accenture Plc
  • Amdocs Ltd.
  • Atos SE
  • Capgemini Service SAS
  • Cigniti Technologies Ltd.
  • Cognizant Technology Solution
  • Deloitte Touche Tohmatsu Ltd.
  • DXC Technology Co.
  • EPAM Systems Inc.
  • HCL Technologies Ltd.
  • IBM Corp.
  • Infosys Ltd.
  • LTIMindtree Ltd.
  • NTT DATA Corp.
  • PricewaterhouseCoopers LLP
  • QualiTest Group
  • Sopra Steria Group SA
  • Tata Consultancy Services
  • Tech Mahindra Ltd.
  • Wipro Ltd.

Qualitative and quantitative analysis of companies has been conducted to help clients understand the wider business environment as well as the strengths and weaknesses of key industry players. Data is qualitatively analyzed to categorize companies as pure play, category-focused, industry-focused, and diversified; it is quantitatively analyzed to categorize companies as dominant, leading, strong, tentative, and weak.

Recent Development and News in Software testing services market

  • In May, 2025, Forethought launched its new AI-powered platform, Agatha, designed to automate the identification and prioritization of user experience issues on retail websites and mobile applications.
  • In April, 2025, Microsoft announced the general availability of Azure DevOps Lab Services, a cloud-based solution enabling users to create and manage virtual environments for streamlined software testing.
  • In March, 2025, Infosys launched Infostretch Conversational Testing, an innovative AI-powered test automation platform that utilizes natural language processing to simplify test script creation and execution.
  • In January, 2025, EPAM Systems Inc. completed its acquisition of NEORIS, a digital accelerator with a strong presence across Latin America, significantly expanding its service delivery capabilities and talent base in the region.

Dive into Technavio’s robust research methodology, blending expert interviews, extensive data synthesis, and validated models for unparalleled Software Testing Services Market insights. See full methodology.

Market Scope
Page number 315
Base year 2025
Historic period 2020-2024
Forecast period 2026-2030
Growth momentum & CAGR Accelerate at a CAGR of 11.7%
Market growth 2026-2030 USD 27612.0 million
Market structure Fragmented
YoY growth 2025-2026(%) 10.4%
Key countries US, Canada, Mexico, UK, Germany, France, Italy, The Netherlands, Spain, China, India, Japan, South Korea, Australia, Indonesia, Brazil, Argentina, Colombia, UAE, Saudi Arabia, South Africa, Qatar and Turkey
Competitive landscape Leading Companies, Market Positioning of Companies, Competitive Strategies, and Industry Risks

Request Free Sample

Research Analyst Overview

  • The software testing services market is defined by a strategic pivot from traditional QA to integrated quality engineering, driven by digital transformation. The adoption of DevOps continuous testing solutions and agile test automation frameworks is no longer optional but a core requirement for competitive advantage.
  • We observe a strong demand for specialized, non-functional testing, including performance engineering and robust application security testing. This shift is a direct response to the escalating complexity of modern software, particularly in cloud-native application testing and systems built on microservices architecture.
  • Firms are leveraging AI-powered testing platforms for predictive analytics and intelligent test case generation, with some achieving a 30% reduction in critical defect slippage. The emphasis is on delivering a superior customer experience through comprehensive usability and compatibility testing, supported by advanced test data management and continuous integration practices.
  • This evolution makes test automation a strategic enabler of business agility and resilience in a dynamic digital landscape.

What are the Key Data Covered in this Software Testing Services Market Research and Growth Report?

  • What is the expected growth of the Software Testing Services Market between 2026 and 2030?

    • USD 27.61 billion, at a CAGR of 11.7%

  • What segmentation does the market report cover?

    • The report is segmented by Service (Functional, Digital testing, and Specialized offering), End-user (BFSI, Telecom and media, Manufacturing, Retail, and Others), Product (Application testing, and Product testing) and Geography (North America, Europe, APAC, South America, Middle East and Africa)

  • Which regions are analyzed in the report?

    • North America, Europe, APAC, South America and Middle East and Africa

  • What are the key growth drivers and market challenges?

    • Pervasive digital transformation and escalating software complexity, Acute talent shortage and widening skill gap in specialized testing domains

  • Who are the major players in the Software Testing Services Market?

    • Accenture Plc, Amdocs Ltd., Atos SE, Capgemini Service SAS, Cigniti Technologies Ltd., Cognizant Technology Solution, Deloitte Touche Tohmatsu Ltd., DXC Technology Co., EPAM Systems Inc., HCL Technologies Ltd., IBM Corp., Infosys Ltd., LTIMindtree Ltd., NTT DATA Corp., PricewaterhouseCoopers LLP, QualiTest Group, Sopra Steria Group SA, Tata Consultancy Services, Tech Mahindra Ltd. and Wipro Ltd.

Market Research Insights

  • Market dynamics are shaped by a strategic shift toward integrated quality engineering, where continuous testing is embedded within DevOps pipelines to accelerate delivery. Organizations are increasingly adopting cloud-based testing platforms, with adoption rates showing a 25% year-over-year increase, to achieve greater scalability and cost efficiency.
  • This move is driven by the need for robust agile test automation frameworks capable of supporting rapid, iterative development cycles. The focus on non-functional testing is also intensifying, as performance and security directly impact business outcomes. For instance, implementing comprehensive penetration testing services can reduce security breach incidents by over 40%, safeguarding brand reputation.
  • This heightened emphasis on quality, security, and speed makes specialized software testing services an indispensable component of modern software development, directly impacting ROI.

We can help! Our analysts can customize this software testing services market research report to meet your requirements.

Get in touch

1. Executive Summary

1.1 Market overview

Executive Summary - Chart on Market Overview
Executive Summary - Data Table on Market Overview
Executive Summary - Chart on Global Market Characteristics
Executive Summary - Chart on Market by Geography
Executive Summary - Chart on Market Segmentation by Service
Executive Summary - Chart on Market Segmentation by End-user
Executive Summary - Chart on Market Segmentation by Product
Executive Summary - Chart on Incremental Growth
Executive Summary - Data Table on Incremental Growth
Executive Summary - Chart on Company Market Positioning

2. Technavio Analysis

2.1 Analysis of price sensitivity, lifecycle, customer purchase basket, adoption rates, and purchase criteria

2.2 Criticality of inputs and Factors of differentiation

Chart on Overview on criticality of inputs and factors of differentiation

2.3 Factors of disruption

Chart on Overview on factors of disruption

2.4 Impact of drivers and challenges

Chart on Impact of drivers and challenges in 2025 and 2030

3. Market Landscape

3.1 Market ecosystem

Chart on Parent Market
Data Table on - Parent Market

3.2 Market characteristics

Chart on Market characteristics analysis

3.3 Value chain analysis

Chart on Value chain analysis

4. Market Sizing

4.1 Market definition

Data Table on Offerings of companies included in the market definition

4.2 Market segment analysis

Market segments

4.3 Market size 2025

4.4 Market outlook: Forecast for 2025-2030

Chart on Global - Market size and forecast 2025-2030 ($ million)
Data Table on Global - Market size and forecast 2025-2030 ($ million)
Chart on Global Market: Year-over-year growth 2025-2030 (%)
Data Table on Global Market: Year-over-year growth 2025-2030 (%)

5. Historic Market Size

5.1 Global Software Testing Services Market 2020 - 2024

Historic Market Size - Data Table on Global Software Testing Services Market 2020 - 2024 ($ million)

5.2 Service segment analysis 2020 - 2024

Historic Market Size - Service Segment 2020 - 2024 ($ million)

5.3 End-user segment analysis 2020 - 2024

Historic Market Size - End-user Segment 2020 - 2024 ($ million)

5.4 Product segment analysis 2020 - 2024

Historic Market Size - Product Segment 2020 - 2024 ($ million)

5.5 Geography segment analysis 2020 - 2024

Historic Market Size - Geography Segment 2020 - 2024 ($ million)

5.6 Country segment analysis 2020 - 2024

Historic Market Size - Country Segment 2020 - 2024 ($ million)

6. Qualitative Analysis

6.1 The AI impact on global software testing services market

7. Five Forces Analysis

7.1 Five forces summary

Five forces analysis - Comparison between 2025 and 2030

7.2 Bargaining power of buyers

Bargaining power of buyers - Impact of key factors 2025 and 2030

7.3 Bargaining power of suppliers

Bargaining power of suppliers - Impact of key factors in 2025 and 2030

7.4 Threat of new entrants

Threat of new entrants - Impact of key factors in 2025 and 2030

7.5 Threat of substitutes

Threat of substitutes - Impact of key factors in 2025 and 2030

7.6 Threat of rivalry

Threat of rivalry - Impact of key factors in 2025 and 2030

7.7 Market condition

Chart on Market condition - Five forces 2025 and 2030

8. Market Segmentation by Service

8.1 Market segments

Chart on Service - Market share 2025-2030 (%)
Data Table on Service - Market share 2025-2030 (%)

8.2 Comparison by Service

Chart on Comparison by Service
Data Table on Comparison by Service

8.3 Functional - Market size and forecast 2025-2030

Chart on Functional - Market size and forecast 2025-2030 ($ million)
Data Table on Functional - Market size and forecast 2025-2030 ($ million)
Chart on Functional - Year-over-year growth 2025-2030 (%)
Data Table on Functional - Year-over-year growth 2025-2030 (%)

8.4 Digital testing - Market size and forecast 2025-2030

Chart on Digital testing - Market size and forecast 2025-2030 ($ million)
Data Table on Digital testing - Market size and forecast 2025-2030 ($ million)
Chart on Digital testing - Year-over-year growth 2025-2030 (%)
Data Table on Digital testing - Year-over-year growth 2025-2030 (%)

8.5 Specialized offering - Market size and forecast 2025-2030

Chart on Specialized offering - Market size and forecast 2025-2030 ($ million)
Data Table on Specialized offering - Market size and forecast 2025-2030 ($ million)
Chart on Specialized offering - Year-over-year growth 2025-2030 (%)
Data Table on Specialized offering - Year-over-year growth 2025-2030 (%)

8.6 Market opportunity by Service

Market opportunity by Service ($ million)
Data Table on Market opportunity by Service ($ million)

9. Market Segmentation by End-user

9.1 Market segments

Chart on End-user - Market share 2025-2030 (%)
Data Table on End-user - Market share 2025-2030 (%)

9.2 Comparison by End-user

Chart on Comparison by End-user
Data Table on Comparison by End-user

9.3 BFSI - Market size and forecast 2025-2030

Chart on BFSI - Market size and forecast 2025-2030 ($ million)
Data Table on BFSI - Market size and forecast 2025-2030 ($ million)
Chart on BFSI - Year-over-year growth 2025-2030 (%)
Data Table on BFSI - Year-over-year growth 2025-2030 (%)

9.4 Telecom and media - Market size and forecast 2025-2030

Chart on Telecom and media - Market size and forecast 2025-2030 ($ million)
Data Table on Telecom and media - Market size and forecast 2025-2030 ($ million)
Chart on Telecom and media - Year-over-year growth 2025-2030 (%)
Data Table on Telecom and media - Year-over-year growth 2025-2030 (%)

9.5 Manufacturing - Market size and forecast 2025-2030

Chart on Manufacturing - Market size and forecast 2025-2030 ($ million)
Data Table on Manufacturing - Market size and forecast 2025-2030 ($ million)
Chart on Manufacturing - Year-over-year growth 2025-2030 (%)
Data Table on Manufacturing - Year-over-year growth 2025-2030 (%)

9.6 Retail - Market size and forecast 2025-2030

Chart on Retail - Market size and forecast 2025-2030 ($ million)
Data Table on Retail - Market size and forecast 2025-2030 ($ million)
Chart on Retail - Year-over-year growth 2025-2030 (%)
Data Table on Retail - Year-over-year growth 2025-2030 (%)

9.7 Others - Market size and forecast 2025-2030

Chart on Others - Market size and forecast 2025-2030 ($ million)
Data Table on Others - Market size and forecast 2025-2030 ($ million)
Chart on Others - Year-over-year growth 2025-2030 (%)
Data Table on Others - Year-over-year growth 2025-2030 (%)

9.8 Market opportunity by End-user

Market opportunity by End-user ($ million)
Data Table on Market opportunity by End-user ($ million)

10. Market Segmentation by Product

10.1 Market segments

Chart on Product - Market share 2025-2030 (%)
Data Table on Product - Market share 2025-2030 (%)

10.2 Comparison by Product

Chart on Comparison by Product
Data Table on Comparison by Product

10.3 Application testing - Market size and forecast 2025-2030

Chart on Application testing - Market size and forecast 2025-2030 ($ million)
Data Table on Application testing - Market size and forecast 2025-2030 ($ million)
Chart on Application testing - Year-over-year growth 2025-2030 (%)
Data Table on Application testing - Year-over-year growth 2025-2030 (%)

10.4 Product testing - Market size and forecast 2025-2030

Chart on Product testing - Market size and forecast 2025-2030 ($ million)
Data Table on Product testing - Market size and forecast 2025-2030 ($ million)
Chart on Product testing - Year-over-year growth 2025-2030 (%)
Data Table on Product testing - Year-over-year growth 2025-2030 (%)

10.5 Market opportunity by Product

Market opportunity by Product ($ million)
Data Table on Market opportunity by Product ($ million)

11. Customer Landscape

11.1 Customer landscape overview

Analysis of price sensitivity, lifecycle, customer purchase basket, adoption rates, and purchase criteria

12. Geographic Landscape

12.1 Geographic segmentation

Chart on Market share by geography 2025-2030 (%)
Data Table on Market share by geography 2025-2030 (%)

12.2 Geographic comparison

Chart on Geographic comparison
Data Table on Geographic comparison

12.3 North America - Market size and forecast 2025-2030

Chart on North America - Market size and forecast 2025-2030 ($ million)
Data Table on North America - Market size and forecast 2025-2030 ($ million)
Chart on North America - Year-over-year growth 2025-2030 (%)
Data Table on North America - Year-over-year growth 2025-2030 (%)
Chart on Regional Comparison - North America
Data Table on Regional Comparison - North America

12.3.1 US - Market size and forecast 2025-2030

Chart on US - Market size and forecast 2025-2030 ($ million)
Data Table on US - Market size and forecast 2025-2030 ($ million)
Chart on US - Year-over-year growth 2025-2030 (%)
Data Table on US - Year-over-year growth 2025-2030 (%)

12.3.2 Canada - Market size and forecast 2025-2030

Chart on Canada - Market size and forecast 2025-2030 ($ million)
Data Table on Canada - Market size and forecast 2025-2030 ($ million)
Chart on Canada - Year-over-year growth 2025-2030 (%)
Data Table on Canada - Year-over-year growth 2025-2030 (%)

12.3.3 Mexico - Market size and forecast 2025-2030

Chart on Mexico - Market size and forecast 2025-2030 ($ million)
Data Table on Mexico - Market size and forecast 2025-2030 ($ million)
Chart on Mexico - Year-over-year growth 2025-2030 (%)
Data Table on Mexico - Year-over-year growth 2025-2030 (%)

12.4 Europe - Market size and forecast 2025-2030

Chart on Europe - Market size and forecast 2025-2030 ($ million)
Data Table on Europe - Market size and forecast 2025-2030 ($ million)
Chart on Europe - Year-over-year growth 2025-2030 (%)
Data Table on Europe - Year-over-year growth 2025-2030 (%)
Chart on Regional Comparison - Europe
Data Table on Regional Comparison - Europe

12.4.1 UK - Market size and forecast 2025-2030

Chart on UK - Market size and forecast 2025-2030 ($ million)
Data Table on UK - Market size and forecast 2025-2030 ($ million)
Chart on UK - Year-over-year growth 2025-2030 (%)
Data Table on UK - Year-over-year growth 2025-2030 (%)

12.4.2 Germany - Market size and forecast 2025-2030

Chart on Germany - Market size and forecast 2025-2030 ($ million)
Data Table on Germany - Market size and forecast 2025-2030 ($ million)
Chart on Germany - Year-over-year growth 2025-2030 (%)
Data Table on Germany - Year-over-year growth 2025-2030 (%)

12.4.3 France - Market size and forecast 2025-2030

Chart on France - Market size and forecast 2025-2030 ($ million)
Data Table on France - Market size and forecast 2025-2030 ($ million)
Chart on France - Year-over-year growth 2025-2030 (%)
Data Table on France - Year-over-year growth 2025-2030 (%)

12.4.4 Italy - Market size and forecast 2025-2030

Chart on Italy - Market size and forecast 2025-2030 ($ million)
Data Table on Italy - Market size and forecast 2025-2030 ($ million)
Chart on Italy - Year-over-year growth 2025-2030 (%)
Data Table on Italy - Year-over-year growth 2025-2030 (%)

12.4.5 The Netherlands - Market size and forecast 2025-2030

Chart on The Netherlands - Market size and forecast 2025-2030 ($ million)
Data Table on The Netherlands - Market size and forecast 2025-2030 ($ million)
Chart on The Netherlands - Year-over-year growth 2025-2030 (%)
Data Table on The Netherlands - Year-over-year growth 2025-2030 (%)

12.4.6 Spain - Market size and forecast 2025-2030

Chart on Spain - Market size and forecast 2025-2030 ($ million)
Data Table on Spain - Market size and forecast 2025-2030 ($ million)
Chart on Spain - Year-over-year growth 2025-2030 (%)
Data Table on Spain - Year-over-year growth 2025-2030 (%)

12.5 APAC - Market size and forecast 2025-2030

Chart on APAC - Market size and forecast 2025-2030 ($ million)
Data Table on APAC - Market size and forecast 2025-2030 ($ million)
Chart on APAC - Year-over-year growth 2025-2030 (%)
Data Table on APAC - Year-over-year growth 2025-2030 (%)
Chart on Regional Comparison - APAC
Data Table on Regional Comparison - APAC

12.5.1 China - Market size and forecast 2025-2030

Chart on China - Market size and forecast 2025-2030 ($ million)
Data Table on China - Market size and forecast 2025-2030 ($ million)
Chart on China - Year-over-year growth 2025-2030 (%)
Data Table on China - Year-over-year growth 2025-2030 (%)

12.5.2 India - Market size and forecast 2025-2030

Chart on India - Market size and forecast 2025-2030 ($ million)
Data Table on India - Market size and forecast 2025-2030 ($ million)
Chart on India - Year-over-year growth 2025-2030 (%)
Data Table on India - Year-over-year growth 2025-2030 (%)

12.5.3 Japan - Market size and forecast 2025-2030

Chart on Japan - Market size and forecast 2025-2030 ($ million)
Data Table on Japan - Market size and forecast 2025-2030 ($ million)
Chart on Japan - Year-over-year growth 2025-2030 (%)
Data Table on Japan - Year-over-year growth 2025-2030 (%)

12.5.4 South Korea - Market size and forecast 2025-2030

Chart on South Korea - Market size and forecast 2025-2030 ($ million)
Data Table on South Korea - Market size and forecast 2025-2030 ($ million)
Chart on South Korea - Year-over-year growth 2025-2030 (%)
Data Table on South Korea - Year-over-year growth 2025-2030 (%)

12.5.5 Australia - Market size and forecast 2025-2030

Chart on Australia - Market size and forecast 2025-2030 ($ million)
Data Table on Australia - Market size and forecast 2025-2030 ($ million)
Chart on Australia - Year-over-year growth 2025-2030 (%)
Data Table on Australia - Year-over-year growth 2025-2030 (%)

12.5.6 Indonesia - Market size and forecast 2025-2030

Chart on Indonesia - Market size and forecast 2025-2030 ($ million)
Data Table on Indonesia - Market size and forecast 2025-2030 ($ million)
Chart on Indonesia - Year-over-year growth 2025-2030 (%)
Data Table on Indonesia - Year-over-year growth 2025-2030 (%)

12.6 South America - Market size and forecast 2025-2030

Chart on South America - Market size and forecast 2025-2030 ($ million)
Data Table on South America - Market size and forecast 2025-2030 ($ million)
Chart on South America - Year-over-year growth 2025-2030 (%)
Data Table on South America - Year-over-year growth 2025-2030 (%)
Chart on Regional Comparison - South America
Data Table on Regional Comparison - South America

12.6.1 Brazil - Market size and forecast 2025-2030

Chart on Brazil - Market size and forecast 2025-2030 ($ million)
Data Table on Brazil - Market size and forecast 2025-2030 ($ million)
Chart on Brazil - Year-over-year growth 2025-2030 (%)
Data Table on Brazil - Year-over-year growth 2025-2030 (%)

12.6.2 Argentina - Market size and forecast 2025-2030

Chart on Argentina - Market size and forecast 2025-2030 ($ million)
Data Table on Argentina - Market size and forecast 2025-2030 ($ million)
Chart on Argentina - Year-over-year growth 2025-2030 (%)
Data Table on Argentina - Year-over-year growth 2025-2030 (%)

12.6.3 Colombia - Market size and forecast 2025-2030

Chart on Colombia - Market size and forecast 2025-2030 ($ million)
Data Table on Colombia - Market size and forecast 2025-2030 ($ million)
Chart on Colombia - Year-over-year growth 2025-2030 (%)
Data Table on Colombia - Year-over-year growth 2025-2030 (%)

12.7 Middle East and Africa - Market size and forecast 2025-2030

Chart on Middle East and Africa - Market size and forecast 2025-2030 ($ million)
Data Table on Middle East and Africa - Market size and forecast 2025-2030 ($ million)
Chart on Middle East and Africa - Year-over-year growth 2025-2030 (%)
Data Table on Middle East and Africa - Year-over-year growth 2025-2030 (%)
Chart on Regional Comparison - Middle East and Africa
Data Table on Regional Comparison - Middle East and Africa

12.7.1 UAE - Market size and forecast 2025-2030

Chart on UAE - Market size and forecast 2025-2030 ($ million)
Data Table on UAE - Market size and forecast 2025-2030 ($ million)
Chart on UAE - Year-over-year growth 2025-2030 (%)
Data Table on UAE - Year-over-year growth 2025-2030 (%)

12.7.2 Saudi Arabia - Market size and forecast 2025-2030

Chart on Saudi Arabia - Market size and forecast 2025-2030 ($ million)
Data Table on Saudi Arabia - Market size and forecast 2025-2030 ($ million)
Chart on Saudi Arabia - Year-over-year growth 2025-2030 (%)
Data Table on Saudi Arabia - Year-over-year growth 2025-2030 (%)

12.7.3 South Africa - Market size and forecast 2025-2030

Chart on South Africa - Market size and forecast 2025-2030 ($ million)
Data Table on South Africa - Market size and forecast 2025-2030 ($ million)
Chart on South Africa - Year-over-year growth 2025-2030 (%)
Data Table on South Africa - Year-over-year growth 2025-2030 (%)

12.7.4 Qatar - Market size and forecast 2025-2030

Chart on Qatar - Market size and forecast 2025-2030 ($ million)
Data Table on Qatar - Market size and forecast 2025-2030 ($ million)
Chart on Qatar - Year-over-year growth 2025-2030 (%)
Data Table on Qatar - Year-over-year growth 2025-2030 (%)

12.7.5 Turkey - Market size and forecast 2025-2030

Chart on Turkey - Market size and forecast 2025-2030 ($ million)
Data Table on Turkey - Market size and forecast 2025-2030 ($ million)
Chart on Turkey - Year-over-year growth 2025-2030 (%)
Data Table on Turkey - Year-over-year growth 2025-2030 (%)

12.8 Market opportunity by geography

Market opportunity by geography ($ million)
Data Tables on Market opportunity by geography ($ million)

13. Drivers, Challenges, and Opportunity

13.1 Market drivers

Pervasive digital transformation and escalating software complexity
Widespread adoption of agile and DevOps methodologies
Heightened focus on customer experience and application security

13.2 Market challenges

Acute talent shortage and widening skill gap in specialized testing domains
Intense price competition and commoditization of core testing services
Keeping pace with rapid technological evolution and complexity of modern application architectures

13.3 Impact of drivers and challenges

Impact of drivers and challenges in 2025 and 2030

13.4 Market opportunities

Proliferation of artificial intelligence and machine learning in quality assurance
Deepening integration of shift-left and continuous testing within DevOps environments
Rising demand for specialized non-functional testing services

14. Competitive Landscape

14.1 Overview

14.2

Overview on criticality of inputs and factors of differentiation

14.3 Landscape disruption

Overview on factors of disruption

14.4 Industry risks

Impact of key risks on business

15. Competitive Analysis

15.1 Companies profiled

Companies covered

15.2 Company ranking index

15.3 Market positioning of companies

Matrix on companies position and classification

15.4 Accenture Plc

Accenture Plc - Overview
Accenture Plc - Business segments
Accenture Plc - Key news
Accenture Plc - Key offerings
Accenture Plc - Segment focus
SWOT

15.5 Capgemini Service SAS

Capgemini Service SAS - Overview
Capgemini Service SAS - Business segments
Capgemini Service SAS - Key news
Capgemini Service SAS - Key offerings
Capgemini Service SAS - Segment focus
SWOT

15.6 Cognizant Technology Solution

Cognizant Technology Solution - Overview
Cognizant Technology Solution - Business segments
Cognizant Technology Solution - Key news
Cognizant Technology Solution - Key offerings
Cognizant Technology Solution - Segment focus
SWOT

15.7 Deloitte Touche Tohmatsu Ltd.

Deloitte Touche Tohmatsu Ltd. - Overview
Deloitte Touche Tohmatsu Ltd. - Business segments
Deloitte Touche Tohmatsu Ltd. - Key offerings
Deloitte Touche Tohmatsu Ltd. - Segment focus
SWOT

15.8 DXC Technology Co.

DXC Technology Co. - Overview
DXC Technology Co. - Business segments
DXC Technology Co. - Key news
DXC Technology Co. - Key offerings
DXC Technology Co. - Segment focus
SWOT

15.9 EPAM Systems Inc.

EPAM Systems Inc. - Overview
EPAM Systems Inc. - Business segments
EPAM Systems Inc. - Key news
EPAM Systems Inc. - Key offerings
EPAM Systems Inc. - Segment focus
SWOT

15.10 HCL Technologies Ltd.

HCL Technologies Ltd. - Overview
HCL Technologies Ltd. - Business segments
HCL Technologies Ltd. - Key news
HCL Technologies Ltd. - Key offerings
HCL Technologies Ltd. - Segment focus
SWOT

15.11 IBM Corp.

IBM Corp. - Overview
IBM Corp. - Business segments
IBM Corp. - Key news
IBM Corp. - Key offerings
IBM Corp. - Segment focus
SWOT

15.12 Infosys Ltd.

Infosys Ltd. - Overview
Infosys Ltd. - Business segments
Infosys Ltd. - Key news
Infosys Ltd. - Key offerings
Infosys Ltd. - Segment focus
SWOT

15.13 LTIMindtree Ltd.

LTIMindtree Ltd. - Overview
LTIMindtree Ltd. - Product / Service
LTIMindtree Ltd. - Key offerings
SWOT

15.14 NTT DATA Corp.

NTT DATA Corp. - Overview
NTT DATA Corp. - Business segments
NTT DATA Corp. - Key news
NTT DATA Corp. - Key offerings
NTT DATA Corp. - Segment focus
SWOT

15.15 PricewaterhouseCoopers LLP

PricewaterhouseCoopers LLP - Overview
PricewaterhouseCoopers LLP - Product / Service
PricewaterhouseCoopers LLP - Key offerings
SWOT

15.16 Tata Consultancy Services

Tata Consultancy Services - Overview
Tata Consultancy Services - Business segments
Tata Consultancy Services - Key news
Tata Consultancy Services - Key offerings
Tata Consultancy Services - Segment focus
SWOT

15.17 Tech Mahindra Ltd.

Tech Mahindra Ltd. - Overview
Tech Mahindra Ltd. - Business segments
Tech Mahindra Ltd. - Key news
Tech Mahindra Ltd. - Key offerings
Tech Mahindra Ltd. - Segment focus
SWOT

15.18 Wipro Ltd.

Wipro Ltd. - Overview
Wipro Ltd. - Business segments
Wipro Ltd. - Key news
Wipro Ltd. - Key offerings
Wipro Ltd. - Segment focus
SWOT

16. Appendix

16.1 Scope of the report

Market definition
Objectives
Notes and caveats

16.2 Inclusions and exclusions checklist

Inclusions checklist
Exclusions checklist

16.3 Currency conversion rates for US$

16.4 Research methodology

16.5 Data procurement

Information sources

16.6 Data validation

16.7 Validation techniques employed for market sizing

16.8 Data synthesis

16.9 360 degree market analysis

16.10 List of abbreviations

Research Methodology

Technavio presents a detailed picture of the market by way of study, synthesis, and summation of data from multiple sources. The analysts have presented the various facets of the market with a particular focus on identifying the key industry influencers. The data thus presented is comprehensive, reliable, and the result of extensive research, both primary and secondary.

INFORMATION SOURCES

Primary sources

  • Manufacturers and suppliers
  • Channel partners
  • Industry experts
  • Strategic decision makers

Secondary sources

  • Industry journals and periodicals
  • Government data
  • Financial reports of key industry players
  • Historical data
  • Press releases

DATA ANALYSIS

Data Synthesis

  • Collation of data
  • Estimation of key figures
  • Analysis of derived insights

Data Validation

  • Triangulation with data models
  • Reference against proprietary databases
  • Corroboration with industry experts

REPORT WRITING

Qualitative

  • Market drivers
  • Market challenges
  • Market trends
  • Five forces analysis

Quantitative

  • Market size and forecast
  • Market segmentation
  • Geographical insights
  • Competitive landscape

Interested in this report?

Get your sample now to see our research methodology and insights!

Download Now

Frequently Asked Questions

Software Testing Services market growth will increase by USD 27612.0 million during 2026-2030.

The Software Testing Services market is expected to grow at a CAGR of 11.7% during 2026-2030.

Software Testing Services market is segmented by Service (Functional, Digital testing, Specialized offering) End-user (BFSI, Telecom and media, Manufacturing, Retail, Others) Product (Application testing, Product testing)

Accenture Plc, Amdocs Ltd., Atos SE, Capgemini Service SAS, Cigniti Technologies Ltd., Cognizant Technology Solution, Deloitte Touche Tohmatsu Ltd., DXC Technology Co., EPAM Systems Inc., HCL Technologies Ltd., IBM Corp., Infosys Ltd., LTIMindtree Ltd., NTT DATA Corp., PricewaterhouseCoopers LLP, QualiTest Group, Sopra Steria Group SA, Tata Consultancy Services, Tech Mahindra Ltd., Wipro Ltd. are a few of the key vendors in the Software Testing Services market.

North America will register the highest growth rate of 42.8% among the other regions. Therefore, the Software Testing Services market in North America is expected to garner significant business opportunities for the vendors during the forecast period.

US, Canada, Mexico, UK, Germany, France, Italy, The Netherlands, Spain, China, India, Japan, South Korea, Australia, Indonesia, Brazil, Argentina, Colombia, UAE, Saudi Arabia, South Africa, Qatar, Turkey

  • Pervasive digital transformation and escalating software complexity is the driving factor this market.

The Software Testing Services market vendors should focus on grabbing business opportunities from the Service segment as it accounted for the largest market share in the base year.
RIA - Research AI Assistant
Ask RIA