Solar Cover Glass Market Size 2025-2029
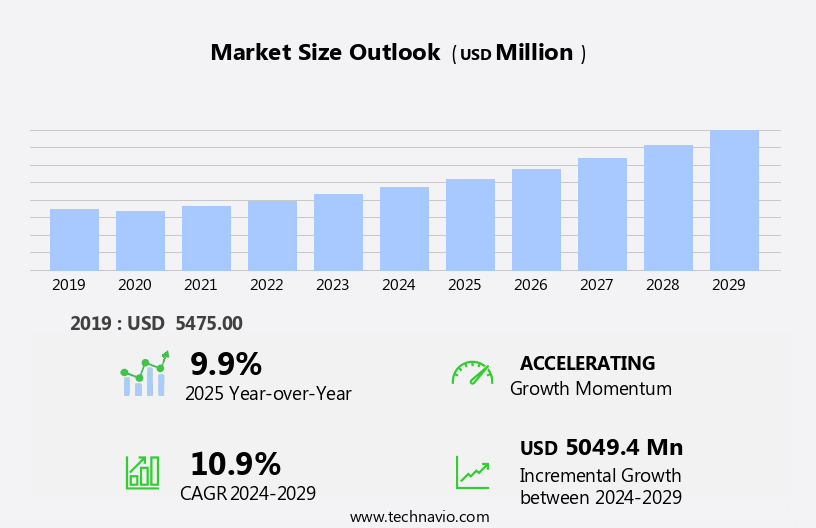
The solar cover glass market size is forecast to increase by USD 5.05 billion, at a CAGR of 10.9% between 2024 and 2029.
- The market is experiencing significant growth, driven by the increasing deployment of solar photovoltaic (PV) systems and the integration of solar energy into microgrids. The rise in solar PV installations is a key trend, as countries worldwide seek to reduce their carbon footprint and transition to renewable energy sources. This trend is further bolstered by advancements in solar technology, making solar energy more cost-effective and accessible. However, the intermittent nature of solar energy poses a significant challenge for the market. Solar energy production is dependent on weather conditions and time of day, necessitating the need for efficient energy storage solutions or backup power sources.
- This challenge can be addressed through the integration of solar energy into microgrids, which enable the storage and distribution of excess solar energy. Additionally, advancements in energy storage technology are expected to mitigate the intermittency issue, providing a promising opportunity for market growth. Companies seeking to capitalize on this market's potential must focus on developing innovative solar cover glass solutions that address the challenges of intermittency and energy storage while maintaining high efficiency and durability.
What will be the Size of the Solar Cover Glass Market during the forecast period?
Explore in-depth regional segment analysis with market size data - historical 2019-2023 and forecasts 2025-2029 - in the full report.
Request Free Sample
The market is a dynamic and evolving sector, driven by the ongoing advancements in solar energy technology and the expanding applications across various industries. Soda-lime glass, a traditional float glass, continues to be a popular choice due to its low cost and availability. However, high strength glass, borosilicate glass, and other specialized types are gaining traction for their enhanced properties, such as thermal stress resistance, UV resistance, and high transparency. Quality control is paramount in solar glass manufacturing, ensuring consistent solar transmittance, reflection coefficient, and light weight. Self-cleaning glass and anti-reflective coatings are increasingly being adopted to enhance energy efficiency and reduce maintenance costs.
Reflection coefficient and chemical resistance are crucial factors, as solar panels require glass that can withstand harsh environmental conditions and maintain optimal performance. Surface finish, edge finishing, and fracture resistance are essential considerations for glass used in solar panel manufacturing. Tempered glass and laminated glass offer superior impact and scratch resistance, ensuring durability and longevity. The market's continuous unfolding is reflected in the ongoing development of photovoltaic cells, green technology, and waste management solutions, all aimed at maximizing energy efficiency and minimizing environmental impact. Solar glass is a vital component of the renewable energy sector, with its light transmittance and refractive index playing a significant role in the conversion of solar energy into electricity.
The market's evolution is further highlighted by the integration of advanced testing standards and the increasing importance of glass recycling and weather resistance. The solar glass market's ongoing dynamism underscores its significance in the broader context of sustainable energy production and the circular economy.
How is this Solar Cover Glass Industry segmented?
The solar cover glass industry research report provides comprehensive data (region-wise segment analysis), with forecasts and estimates in "USD million" for the period 2025-2029, as well as historical data from 2019-2023 for the following segments.
- Application
- Utility
- Commercial
- Residential
- Type
- Crystalline
- Thin-film
- Product Type
- Anti-reflective (AR) coated glass
- Tempered glass
- Transparent conductive oxide (TCO) coated glass
- Others
- Geography
- North America
- US
- Canada
- Europe
- Germany
- Spain
- Middle East and Africa
- South Africa
- APAC
- Australia
- China
- India
- Japan
- South America
- Brazil
- Rest of World (ROW)
- North America
By Application Insights
The utility segment is estimated to witness significant growth during the forecast period.
Solar cover glass, including tempered and plate glass, plays a crucial role in solar power utilities by enhancing the durability and performance of solar panels. With the expansion of utility-scale solar energy capabilities, the demand for high-quality solar cover glass is surging globally. The use of solar cover glass is essential for reducing maintenance costs, as solar panels require frequent repairs and replacements in large-scale settings. Solar energy's growing presence necessitates the adoption of advanced glass technologies, such as low-iron glass, borosilicate glass, and anti-reflective coatings, to optimize energy efficiency, UV resistance, thermal stress resistance, and solar transmittance. Additionally, glass recycling and waste management are vital aspects of the solar glass industry, promoting green technology and sustainability.
Solar panel manufacturing involves various processes, including refractive index testing, surface finish, edge finishing, and quality control, to ensure the production of robust and reliable solar cover glass. The industry also prioritizes self-cleaning glass, chemical resistance, impact resistance, scratch resistance, and fracture resistance to enhance the overall performance and longevity of solar panels.
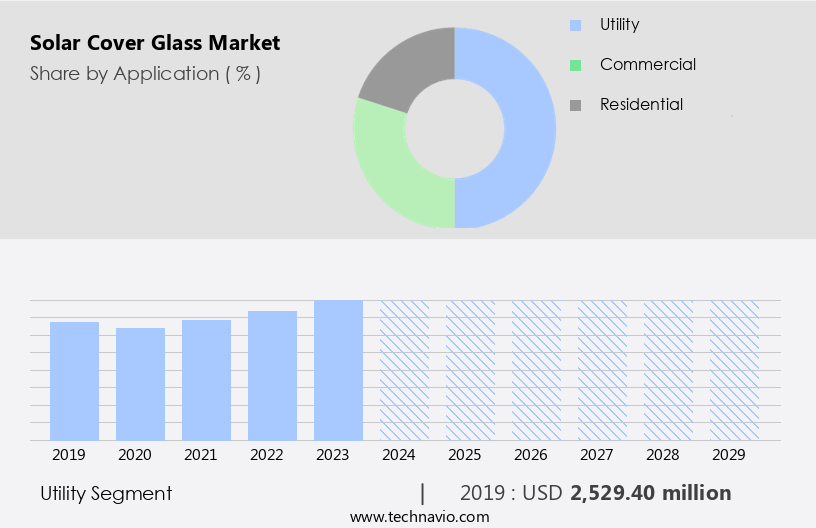
The Utility segment was valued at USD 2.53 billion in 2019 and showed a gradual increase during the forecast period.
Regional Analysis
APAC is estimated to contribute 63% to the growth of the global market during the forecast period.Technavio’s analysts have elaborately explained the regional trends and drivers that shape the market during the forecast period.

The market in the Asia Pacific (APAC) region is experiencing significant growth, making it the largest and fastest-growing market worldwide. China, India, South Korea, and Japan are the primary contributors to the region's revenue. The solar cover glass demand in APAC is driven by increasing environmental concerns, new regulations, expanding renewable energy initiatives, and the declining cost of solar cells. The region's solar energy market has seen remarkable growth in recent years, with China leading the way as the global leader in solar power generation. Solar energy's growing popularity is attributed to its energy efficiency, light transmittance, and ability to reduce carbon emissions.
Solar cover glass plays a crucial role in solar panel manufacturing, enhancing their performance through properties like high transparency, light weight, and thermal stress resistance. Additionally, the integration of advanced features like self-cleaning glass, anti-reflective coating, and chemical resistance further boosts the market's growth. The APAC region's the market is expected to continue its robust expansion during the forecast period.
Market Dynamics
Our researchers analyzed the data with 2024 as the base year, along with the key drivers, trends, and challenges. A holistic analysis of drivers will help companies refine their marketing strategies to gain a competitive advantage.
What are the key market drivers leading to the rise in the adoption of Solar Cover Glass Industry?
- The significant increase in solar photovoltaic (PV) installations serves as the primary market driver.
- The market is experiencing significant growth due to the increasing demand for renewable energy sources and advancements in solar technology. Solar cover glass, which is characterized by high transparency, thermal stress resistance, impact resistance, and scratch resistance, is increasingly being used in photovoltaic cells to enhance their efficiency and durability. The market's growth can be attributed to the rising global energy demand, driven by population growth and technological advancements in various industries such as electrical and electronic appliances, HVAC systems, and industrial electric motor systems.
- Governments worldwide are investing in renewable energy projects to reduce carbon emissions and mitigate climate change, further fueling the market's growth. Solar cover glass's lightweight and eco-friendly properties make it an attractive option for businesses and consumers seeking green technology solutions. The market's future looks promising, with continued advancements in solar technology and increasing awareness of the importance of renewable energy.
What are the market trends shaping the Solar Cover Glass Industry?
- The deployment of microgrids is an emerging market trend that is gaining significant traction. Microgrids, which are small-scale power systems capable of operating independently or in parallel with the main power grid, are becoming increasingly popular due to their ability to provide reliable and resilient power supply.
- Solar cover glass is a crucial component in the manufacturing of solar photovoltaic (PV) systems, which are integral to microgrids - energy systems that integrate various renewable energy sources and provide power to local communities. The increasing adoption of microgrids, driven by the need for energy independence and resilience against power outages, will fuel the demand for solar PV systems and, consequently, solar cover glass. Solar cover glass offers several advantages, including weather resistance, abrasion resistance, and high light transmittance. Its refractive index enables optimal energy absorption, enhancing the overall efficiency of solar panels. Moreover, the recyclability of glass makes it an eco-friendly choice for waste management in the solar industry.
- The growth of the solar energy sector, driven by the global shift towards renewable energy sources, is a significant factor propelling the demand for solar cover glass. As microgrids become increasingly popular, the need for high-quality, durable solar cover glass will continue to rise, ensuring a steady market growth during the forecast period.
What challenges does the Solar Cover Glass Industry face during its growth?
- The intermittent nature of solar energy poses a significant challenge to the industry's growth, requiring continuous advancements in energy storage and grid integration technologies to ensure a reliable and sustainable energy supply.
- The market has witnessed significant growth due to the declining installation costs and favorable government regulations promoting renewable energy. However, the intermittent nature of solar energy poses a challenge to market expansion. Solar energy production depends on various factors, including the panel's efficiency, degree of shading, and solar irradiation. The solar PV systems convert only a small percentage of the sunlight falling on the panel into energy, making it less energy-dense compared to fossil fuels. To enhance the performance and durability of solar cover glass, manufacturers focus on improving its high strength, chemical resistance, reflection coefficient, surface finish, edge finishing, and fracture resistance.
- These features ensure the glass can withstand harsh environmental conditions and maintain its quality over time. Additionally, self-cleaning glass is gaining popularity due to its ability to reduce maintenance costs and improve aesthetics.
Exclusive Customer Landscape
The solar cover glass market forecasting report includes the adoption lifecycle of the market, covering from the innovator’s stage to the laggard’s stage. It focuses on adoption rates in different regions based on penetration. Furthermore, the solar cover glass market report also includes key purchase criteria and drivers of price sensitivity to help companies evaluate and develop their market growth analysis strategies.

Customer Landscape
Key Companies & Market Insights
Companies are implementing various strategies, such as strategic alliances, solar cover glass market forecast, partnerships, mergers and acquisitions, geographical expansion, and product/service launches, to enhance their presence in the industry.
AGC Inc. - The company specializes in producing high-performance solar cover glass, including ultra low iron solar float glass and ultra durable options. These advanced glass solutions enhance solar energy efficiency and durability for various applications.
The industry research and growth report includes detailed analyses of the competitive landscape of the market and information about key companies, including:
- AGC Inc.
- Borosil Ltd.
- Central Glass Co. Ltd.
- Compagnie de Saint-Gobain SA
- Corning Inc.
- CSG Holding Co. Ltd.
- Flat Glass Group Co. Ltd.
- Glas Trosch Holding AG
- Interfloat Corp.
- IRICO Group New Energy Co. Ltd.
- Koch Industries Inc.
- Nippon Sheet Glass Co. Ltd.
- Onyx Solar Group LLC
- SCHOTT AG
- Shenzhen Topray Solar Co. Ltd.
- Taiwan Glass Ind. Corp.
- Targray Technology International Inc.
- TURKIYE SISE VE CAM FABRIKALARI A.S.
- Xinyi Solar Holdings Ltd.
Qualitative and quantitative analysis of companies has been conducted to help clients understand the wider business environment as well as the strengths and weaknesses of key industry players. Data is qualitatively analyzed to categorize companies as pure play, category-focused, industry-focused, and diversified; it is quantitatively analyzed to categorize companies as dominant, leading, strong, tentative, and weak.
Recent Development and News in Solar Cover Glass Market
- In January 2024, Heliovolt, a leading solar glass manufacturer, announced the launch of its new product line, "FlexiSolar," which is a flexible solar cover glass designed for rooftop solar installations. This innovative product offers improved durability and efficiency, making it a game-changer in the solar industry (Heliovolt Press Release).
- In March 2024, Solarglass, a major player in the market, formed a strategic partnership with Tesla, the renowned electric vehicle and renewable energy company. This collaboration aimed to integrate Solarglass's advanced solar cover glass solutions into Tesla's solar roof tiles, expanding their product offerings and enhancing their market presence (Tesla Press Release).
- In May 2024, Guardian Industries, a global manufacturing company, completed the acquisition of SolarSeal, a prominent solar cover glass manufacturer. This acquisition allowed Guardian Industries to strengthen its position in the market and expand its product portfolio, providing synergies and economies of scale (Guardian Industries Press Release).
- In January 2025, the European Union passed the Solar Cover Glass Regulation, mandating the use of high-performance solar cover glass in all new residential and commercial solar installations starting from 2027. This regulatory approval is expected to significantly boost the demand for solar cover glass in Europe (European Commission Press Release).
Research Analyst Overview
- The market encompasses a diverse range of products and technologies, including laminating presses and glass grinding machines, essential for producing high-quality solar glass for various applications. Energy yield and solar cell efficiency are key performance indicators, driving the demand for raw materials such as silicon wafers and advanced coating equipment. Safety standards, mechanical testing, and optical measurements ensure the reliability and durability of solar glass in commercial and residential applications. Solar farms, a significant market segment, require large quantities of solar glass, necessitating efficient distribution networks and robust supply chain management. Quality control instruments, including surface roughness measurement and thickness measurement, ensure the precision and consistency required for optimal power output.
- Corrosion resistance, environmental testing, and government regulations are crucial factors influencing the market dynamics. Tempering furnaces and annealing furnaces play a vital role in the manufacturing process, while glass cutting machines and polishing machines enable customization and finishing. The integration of advanced technologies, such as coating equipment, enhances the performance and durability of solar glass, catering to the evolving needs of the industry. The market trends reflect the growing importance of sustainable energy solutions and the continuous pursuit of higher power output and improved efficiency.
Dive into Technavio’s robust research methodology, blending expert interviews, extensive data synthesis, and validated models for unparalleled Solar Cover Glass Market insights. See full methodology.
|
Market Scope |
|
|
Report Coverage |
Details |
|
Page number |
221 |
|
Base year |
2024 |
|
Historic period |
2019-2023 |
|
Forecast period |
2025-2029 |
|
Growth momentum & CAGR |
Accelerate at a CAGR of 10.9% |
|
Market growth 2025-2029 |
USD 5049.4 million |
|
Market structure |
Fragmented |
|
YoY growth 2024-2025(%) |
9.9 |
|
Key countries |
China, US, India, Germany, Spain, Australia, Canada, South Africa, Japan, and Brazil |
|
Competitive landscape |
Leading Companies, Market Positioning of Companies, Competitive Strategies, and Industry Risks |
What are the Key Data Covered in this Solar Cover Glass Market Research and Growth Report?
- CAGR of the Solar Cover Glass industry during the forecast period
- Detailed information on factors that will drive the growth and forecasting between 2025 and 2029
- Precise estimation of the size of the market and its contribution of the industry in focus to the parent market
- Accurate predictions about upcoming growth and trends and changes in consumer behaviour
- Growth of the market across APAC, Europe, North America, Middle East and Africa, and South America
- Thorough analysis of the market’s competitive landscape and detailed information about companies
- Comprehensive analysis of factors that will challenge the solar cover glass market growth of industry companies
We can help! Our analysts can customize this solar cover glass market research report to meet your requirements.
 RIA -
RIA - 
