South Africa Solar Energy Market Size 2026-2030
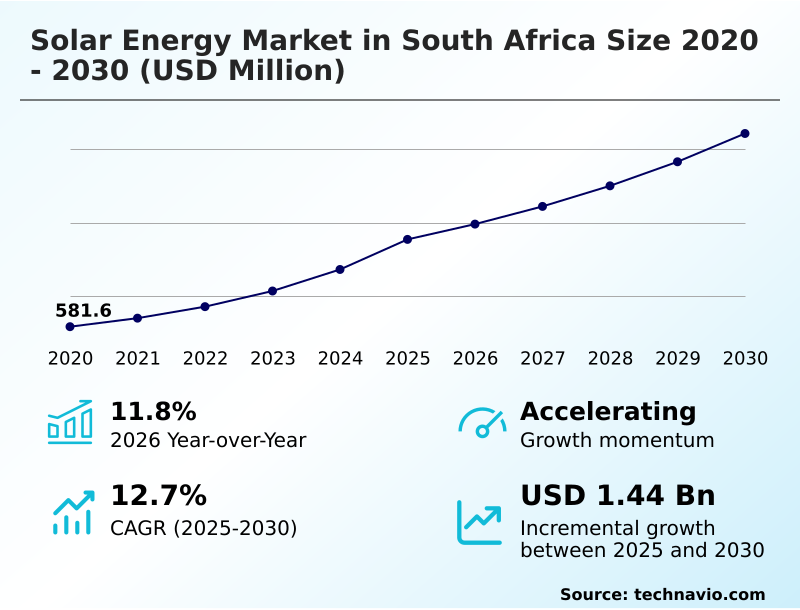
The south africa solar energy market size is valued to increase by USD 1.44 billion, at a CAGR of 12.7% from 2025 to 2030. Radical structural decoupling and emergence of independent transmission entity will drive the south africa solar energy market.
Major Market Trends & Insights
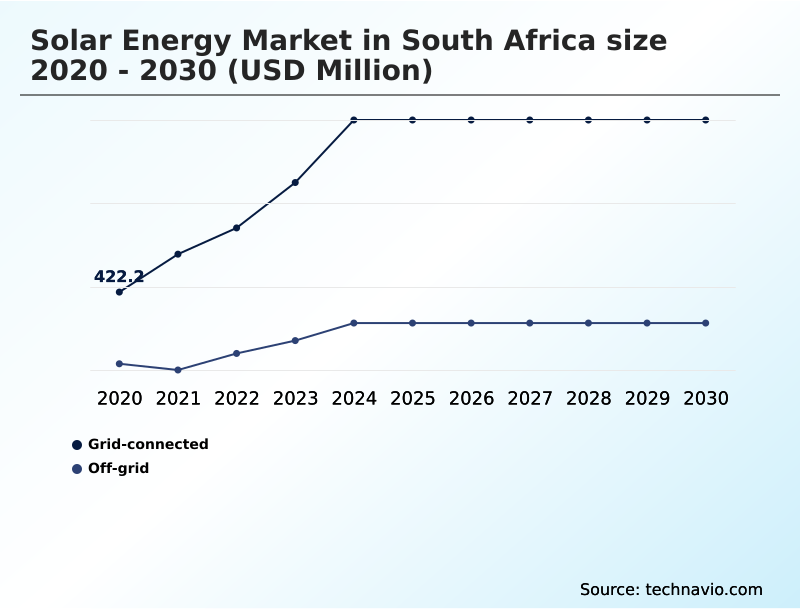
- By Application - Grid-connected segment was valued at USD 1.05 billion in 2024
- By End-user - Utility segment accounted for the largest market revenue share in 2024
Market Size & Forecast
- Market Opportunities: USD 2.63 billion
- Market Future Opportunities: USD 1.44 billion
- CAGR from 2025 to 2030 : 12.7%
Market Summary
- The solar energy market in South Africa is undergoing a significant transformation, driven by structural reforms and a pressing need for energy security. This shift is characterized by the rapid expansion of photovoltaic infrastructure and the strategic deployment of dispatchable renewable energy technologies to complement a grid historically reliant on traditional power sources.
- Key trends include the integration of solar-plus-storage solutions, leveraging lithium-ion battery energy storage systems to mitigate intermittency and enable peak-shaving. The rise of a wholesale electricity market allows independent power producers to engage in bilateral power purchase agreements, enhancing project bankability.
- For instance, a large mining operation can now secure a long-term, fixed-price energy supply from a dedicated utility-scale solar farm via virtual wheeling, bypassing grid volatility and reducing operational costs.
- However, challenges such as grid-curtailment in high-irradiance regions and the high capital cost of hybrid projects persist, requiring ongoing investment in transmission infrastructure and innovative financing models to unlock the market's full potential.
What will be the Size of the South Africa Solar Energy Market during the forecast period?
Get Key Insights on Market Forecast (PDF) Get Free Sample
How is the South Africa Solar Energy Market Segmented?
The south africa solar energy industry research report provides comprehensive data (region-wise segment analysis), with forecasts and estimates in "USD million" for the period 2026-2030, as well as historical data from 2020-2024 for the following segments.
- Application
- Grid-connected
- Off-grid
- End-user
- Utility
- Rooftop
- Technology
- PV systems
- CSP
- Solar thermal systems
- Geography
- Middle East and Africa
- South Africa
- Middle East and Africa
By Application Insights
The grid-connected segment is estimated to witness significant growth during the forecast period.
The grid-connected segment is defined by the integration of large-scale renewable generation into national transmission networks. This sub-segment includes utility-scale solar farms and concentrated solar power facilities supplying bulk electricity to state-owned and private off-takers through sophisticated wheeling arrangements.
The advancement of projects totaling over 5,000 megawatts toward financial closure marks the highest single-year volume of grid-connected renewable capacity in the nation’s history.
This expansion is driven by a regulatory landscape favoring independent power producers and the adoption of advanced solar-plus-storage solutions.
Such photovoltaic infrastructure is critical for diversifying the energy mix and supporting grid stability, with developers incorporating advanced power electronics and smart-grid technologies to manage the influx of dispatchable renewable energy.
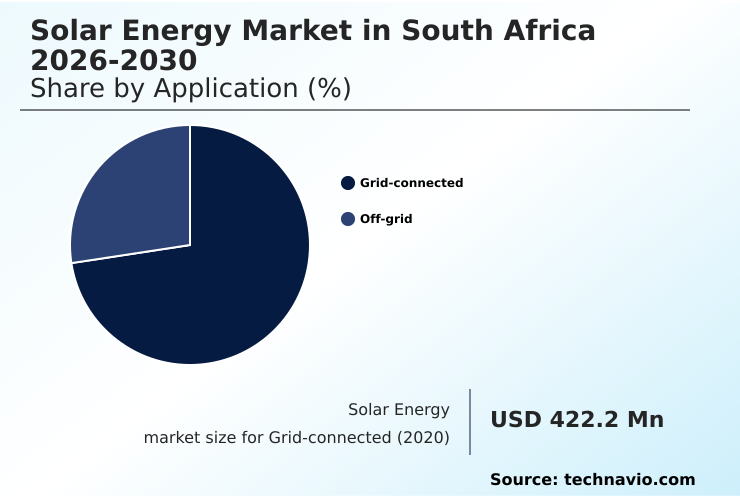
The Grid-connected segment was valued at USD 1.05 billion in 2024 and showed a gradual increase during the forecast period.
Market Dynamics
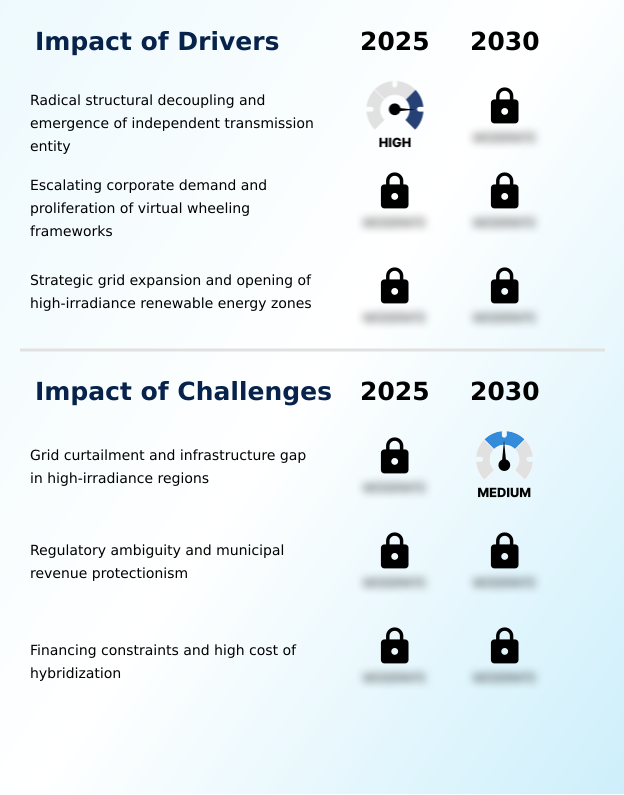
Our researchers analyzed the data with 2025 as the base year, along with the key drivers, trends, and challenges. A holistic analysis of drivers will help companies refine their marketing strategies to gain a competitive advantage.
- The strategic direction of the solar energy market is increasingly shaped by complex financial and regulatory considerations. The impact of unbundling on independent power producers is profound, creating new opportunities in a liberalized wholesale market but also demanding greater sophistication in navigating grid access and tariff structures.
- A critical aspect is the economics of concentrated solar power thermal storage, which, despite higher upfront costs, offers dispatchable power that commands a premium, improving project viability by over 20% compared to intermittent-only sources. However, developers face significant regulatory hurdles for peer-to-peer electricity trading, which could unlock value in decentralized generation but remains limited by municipal-level policies.
- The financing models for utility-scale solar farms are evolving to incorporate these new risks and revenue streams. Key challenges of grid integration for renewable energy persist, particularly the risk of curtailment. When comparing rooftop solar and utility-scale solar PPA, the former offers energy autonomy while the latter provides economies of scale.
- The technical requirements for solar-plus-storage solutions are becoming standard, with advanced solar inverter technology for smart-grid applications being essential for maintaining grid stability amid high renewable penetration. This confluence of factors determines the long-term success of investments in the sector.
What are the key market drivers leading to the rise in the adoption of South Africa Solar Energy Industry?
- A key driver for the market is the radical structural decoupling of the national utility and the corresponding emergence of an independent transmission entity, facilitating open grid access.
- Market expansion is fueled by fundamental structural reforms and escalating corporate demand for clean energy.
- The unbundling of the national utility has paved the way for a competitive wholesale electricity market, empowering independent power producers and streamlining power purchase agreements, which has accelerated project timelines by as much as 20%.
- Simultaneously, corporations are driving the adoption of decentralized generation and rooftop solar to achieve energy security and meet sustainability goals.
- The implementation of virtual wheeling frameworks allows companies to procure renewable energy from utility-scale solar farms, increasing access to clean power.
- Strategic investments in transmission infrastructure are unlocking high-irradiance regions, with new grid connections expected to support over 3 GW of new capacity annually and reduce grid-curtailment risks.
What are the market trends shaping the South Africa Solar Energy Industry?
- A key market trend is the proliferation of large-scale battery energy storage systems, which are increasingly integrated with solar installations to enhance grid stability and provide dispatchable power.
- Key trends are reshaping the market, primarily through the integration of advanced technologies to enhance reliability and create new value streams. The proliferation of solar-plus-storage solutions, which incorporate battery energy storage systems, is critical for delivering dispatchable power, improving grid stability by up to 25%.
- This move toward hybrid projects is transforming the sector, with energy management software enabling sophisticated peak-shaving strategies that can reduce energy costs for industrial users by 15%. Concurrently, the maturation of secondary markets for operational assets and the emergence of peer-to-peer electricity trading platforms are unlocking capital for new photovoltaic infrastructure.
- These decentralized generation models, supported by smart-grid technologies, empower communities and businesses, fostering greater energy autonomy across both grid-tied and off-grid applications.
What challenges does the South Africa Solar Energy Industry face during its growth?
- A key challenge affecting industry growth is the prevalence of grid curtailment and a significant infrastructure gap in high-irradiance regions.
- Despite strong growth drivers, the market faces significant structural and financial challenges that temper its potential. The critical deficit in transmission infrastructure remains a primary bottleneck, with grid-curtailment in high-irradiance regions posing a revenue risk of up to 20% for new utility-scale solar farms. This forces developers to consider less optimal sites, impacting project efficiency.
- At the local level, regulatory ambiguity and inconsistent wheeling tariffs create uncertainty for investors in distributed energy resources. Furthermore, the shift toward hybridization, while necessary for grid stability, inflates initial capital expenditure for solar-plus-storage projects by 30–40%. This financial pressure, compounded by a high-interest-rate environment, complicates financing for independent power producers and small-scale embedded generation projects.
Exclusive Technavio Analysis on Customer Landscape
The south africa solar energy market forecasting report includes the adoption lifecycle of the market, covering from the innovator’s stage to the laggard’s stage. It focuses on adoption rates in different regions based on penetration. Furthermore, the south africa solar energy market report also includes key purchase criteria and drivers of price sensitivity to help companies evaluate and develop their market growth analysis strategies.
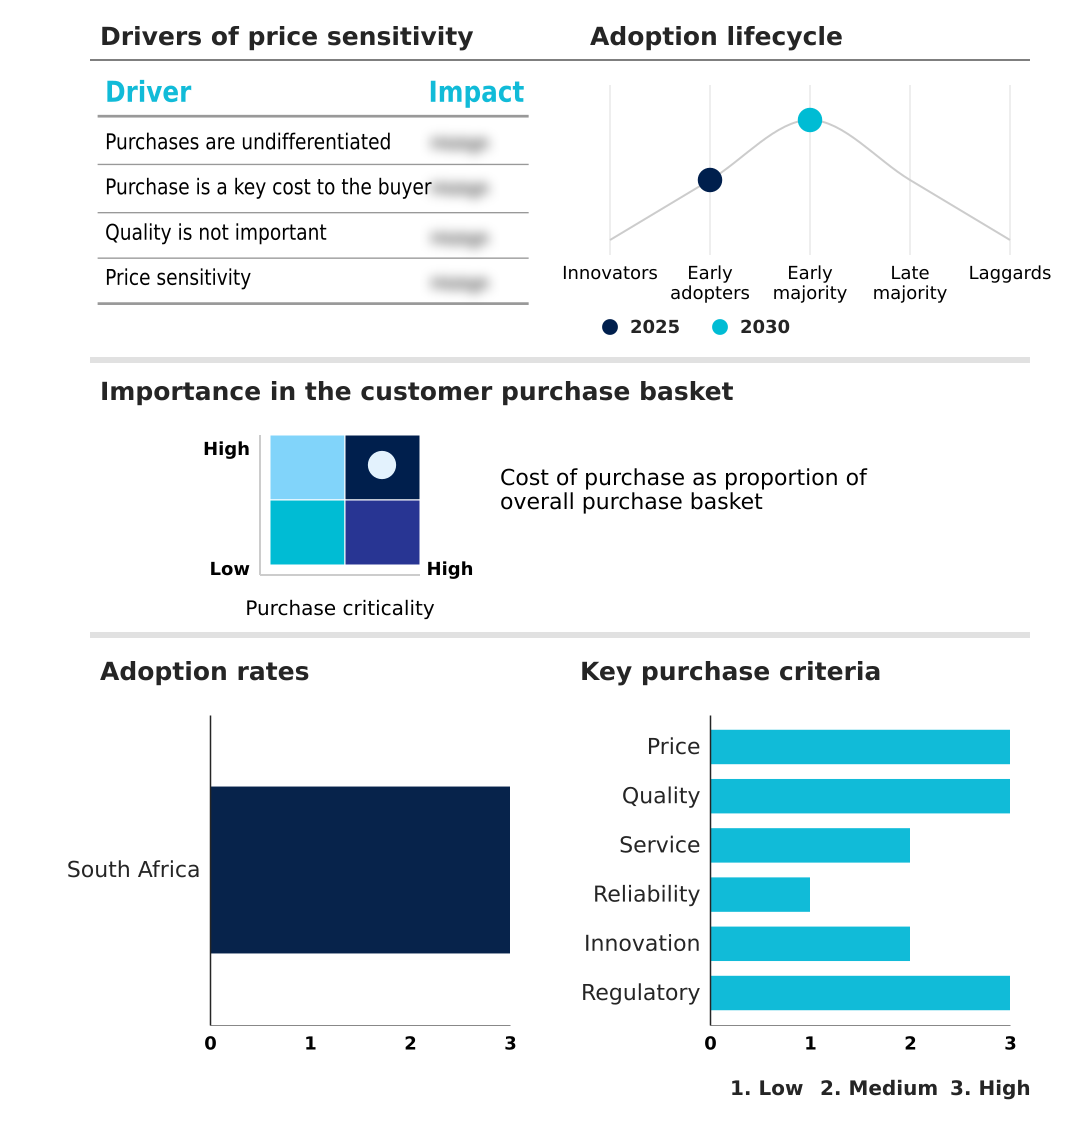
Customer Landscape of South Africa Solar Energy Industry
Competitive Landscape
Companies are implementing various strategies, such as strategic alliances, south africa solar energy market forecast, partnerships, mergers and acquisitions, geographical expansion, and product/service launches, to enhance their presence in the industry.
Acwa Power Co. - The market provides advanced photovoltaic systems, solar-plus-storage solutions, and utility-scale project development to meet escalating clean energy demands and enhance grid stability.
The industry research and growth report includes detailed analyses of the competitive landscape of the market and information about key companies, including:
- Acwa Power Co.
- BP Plc
- Canadian Solar Inc.
- Eaton Corp. Plc
- Enel Spa
- ENGIE SA
- Exxon Mobil Corp.
- Huawei Technologies Co. Ltd.
- JA Solar Technology Co. Ltd.
- JinkoSolar Holding Co. Ltd.
- Sasol Ltd.
- Schneider Electric SE
- Sharp Corp.
- Shell plc
- SolarEdge Technologies Inc.
- Tesla Inc.
- TotalEnergies SE
- Trina Solar Co. Ltd.
- Vestas Wind Systems AS
- Victron Energy BV
Qualitative and quantitative analysis of companies has been conducted to help clients understand the wider business environment as well as the strengths and weaknesses of key industry players. Data is qualitatively analyzed to categorize companies as pure play, category-focused, industry-focused, and diversified; it is quantitatively analyzed to categorize companies as dominant, leading, strong, tentative, and weak.
Recent Development and News in South africa solar energy market
- In October 2024, the South African government passed the final amendments to the Electricity Regulation Amendment Act, creating a framework for a competitive wholesale electricity market and open grid access for independent power producers.
- In March 2025, Schneider Electric highlighted the growing role of solar energy in supporting stable and critical healthcare infrastructure across West Africa, providing reliable power for essential medical equipment.
- In March 2025, Shell announced the discontinuation of several solar projects in Brazil, citing adverse market conditions and a strategic review of its renewable energy portfolio and capital allocation.
- In April 2025, TotalEnergies announced a major agreement to supply 1 gigawatt of solar power from new projects to support Google's expanding data center operations in the United States.
Dive into Technavio’s robust research methodology, blending expert interviews, extensive data synthesis, and validated models for unparalleled South Africa Solar Energy Market insights. See full methodology.
| Market Scope | |
|---|---|
| Page number | 188 |
| Base year | 2025 |
| Historic period | 2020-2024 |
| Forecast period | 2026-2030 |
| Growth momentum & CAGR | Accelerate at a CAGR of 12.7% |
| Market growth 2026-2030 | USD 1444.0 million |
| Market structure | Fragmented |
| YoY growth 2025-2026(%) | 11.8% |
| Key countries | South Africa |
| Competitive landscape | Leading Companies, Market Positioning of Companies, Competitive Strategies, and Industry Risks |
Research Analyst Overview
- The solar energy market in South Africa is defined by a rapid technological and structural evolution, moving decisively toward a decentralized and resilient energy model. The integration of battery energy storage systems with photovoltaic systems is now a standard requirement for ensuring dispatchable renewable energy, a critical boardroom consideration for capital allocation as it significantly alters project economics.
- This shift is driven by the need to overcome grid instability, with industrial consumers reporting that energy can constitute up to 40% of their operational expenses. The industry leverages advanced semiconductor materials in bifacial modules and sophisticated power electronics to maximize output.
- A competitive wholesale electricity market is fostering the growth of independent power producers, who utilize smart-grid technologies and solar inverters to manage grid-connection. However, developers contend with grid-curtailment and complex wheeling tariffs.
- The adoption of solar-plus-storage, microgrids, and off-grid solutions is accelerating, supported by innovative models like virtual wheeling and peer-to-peer electricity trading, which are reshaping the photovoltaic infrastructure and secondary markets.
What are the Key Data Covered in this South Africa Solar Energy Market Research and Growth Report?
-
What is the expected growth of the South Africa Solar Energy Market between 2026 and 2030?
-
USD 1.44 billion, at a CAGR of 12.7%
-
-
What segmentation does the market report cover?
-
The report is segmented by Application (Grid-connected, and Off-grid), End-user (Utility, and Rooftop), Technology (PV systems, CSP, and Solar thermal systems) and Geography (Middle East and Africa)
-
-
Which regions are analyzed in the report?
-
Middle East and Africa
-
-
What are the key growth drivers and market challenges?
-
Radical structural decoupling and emergence of independent transmission entity, Grid curtailment and infrastructure gap in high-irradiance regions
-
-
Who are the major players in the South Africa Solar Energy Market?
-
Acwa Power Co., BP Plc, Canadian Solar Inc., Eaton Corp. Plc, Enel Spa, ENGIE SA, Exxon Mobil Corp., Huawei Technologies Co. Ltd., JA Solar Technology Co. Ltd., JinkoSolar Holding Co. Ltd., Sasol Ltd., Schneider Electric SE, Sharp Corp., Shell plc, SolarEdge Technologies Inc., Tesla Inc., TotalEnergies SE, Trina Solar Co. Ltd., Vestas Wind Systems AS and Victron Energy BV
-
Market Research Insights
- The market is being reshaped by a move toward energy autonomy, as commercial and industrial entities aggressively pursue renewable energy procurement to ensure energy security. This has led to a surge in rooftop solar and decentralized generation, with private installations now exceeding 5,000 megawatts of capacity.
- The adoption of sophisticated energy management software and grid-tied systems allows businesses to reduce grid reliance by over 30% in certain industrial parks. The development of power purchase agreements for distributed energy resources is creating new revenue streams, improving the return on investment for small-scale embedded generation by up to 15%.
- This shift toward decentralized models is a direct response to grid instability and rising tariffs, pushing the clean energy transition.
We can help! Our analysts can customize this south africa solar energy market research report to meet your requirements.
 RIA -
RIA - 
