
Solar PV Backsheet Market Size 2025-2029
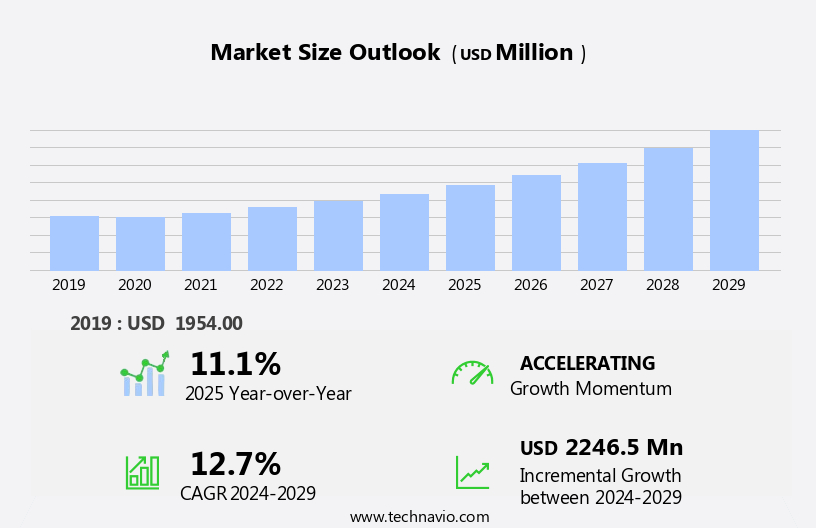
The solar pv backsheet market size is forecast to increase by USD 2.25 billion, at a CAGR of 12.7% between 2024 and 2029.
- The market is experiencing significant shifts, driven by the increasing adoption of thin-film solar PV modules and half-cell modules. Thin-film solar technology, with its flexibility and cost-effectiveness, is gaining traction in the industry, leading to an uptick in demand for compatible backsheets. Technological advances have led to the development of UV-resistant polymers like Polyvinylidene fluoride (PVDF) and Polyethylene terephthalate (PET), which enhance the electrical properties and surface properties of solar backsheets. Additionally, half-cut cell modules, which offer improved efficiency and durability, are becoming increasingly popular. However, this market is not without challenges. Backsheet-associated PV module failures continue to pose a significant threat, necessitating the development of advanced backsheet materials and manufacturing processes to ensure module longevity and reliability.
- Companies in this space must stay abreast of these trends and challenges to capitalize on opportunities and navigate obstacles effectively. By focusing on innovation and quality, they can differentiate themselves and secure a competitive edge in the evolving the market.
What will be the Size of the Solar PV Backsheet Market during the forecast period?
Explore in-depth regional segment analysis with market size data - historical 2019-2023 and forecasts 2025-2029 - in the full report.
Request Free Sample
The market continues to evolve, driven by advancements in technology and shifting market dynamics. EVA film, a crucial component of PV panel construction, undergoes constant innovation to enhance weather resistance and improve overall panel performance. Solar cells, the heart of PV modules, benefit from material science breakthroughs, leading to increased efficiency and reduced carbon footprint. The circular economy gains traction in the solar industry, with data analytics playing a pivotal role in optimizing production processes. UL standards and mechanical strength requirements ensure safety and reliability, while IEC standards maintain consistency and interoperability. Utility-scale solar and energy storage systems drive market demand, with grid-tied systems and off-grid applications catering to diverse energy needs.
Production processes adopt roll-to-roll processing for mass production, while quality control measures ensure thermal stability and power generation efficiency. Moisture barriers, junction boxes, and other protective components are essential for PV module durability. Surface morphology research continues to uncover new ways to enhance UV degradation resistance and fire retardancy. Raw materials undergo rigorous cost analysis and chemical composition assessments to minimize environmental impact. Distributed generation, from residential to commercial applications, expands the market's reach, fueled by the growing importance of energy security and renewable energy adoption. The value chain's intricacies necessitate continuous monitoring and quality assurance to meet evolving market demands.
How is this Solar PV Backsheet Industry segmented?
The solar pv backsheet industry research report provides comprehensive data (region-wise segment analysis), with forecasts and estimates in "USD million" for the period 2025-2029, as well as historical data from 2019-2023 for the following segments.
- Product
- Fluoropolymer
- Non-fluoropolymer
- End-user
- Utility
- Commercial
- Residential
- Technology
- Crystalline silicon
- Thin film
- Ultra-thin film
- Geography
- North America
- US
- Canada
- Europe
- France
- Germany
- Italy
- UK
- APAC
- Australia
- China
- India
- Japan
- Rest of World (ROW)
- North America
.
By Product Insights
The fluoropolymer segment is estimated to witness significant growth during the forecast period.
The market is driven by advancements in technology, material science, and coating technology. EVA film, a common material for backsheets, offers weather resistance and flexibility. Solar cells are integrated into PV panels, which require backsheets for protection and electrical insulation. Carbon footprint concerns have led to a circular economy approach, with data analytics and quality control essential for ensuring efficiency and performance. Grid-tied systems and energy storage are key components of utility-scale solar, while distributed generation and rooftop solar cater to residential and commercial sectors. UL and IEC standards ensure mechanical strength, thermal stability, and fire retardancy.
Production processes employ raw materials such as fluoropolymers, which exhibit long-term performance and reliability. Roll-to-roll processing streamlines manufacturing. Market demand for solar farms and off-grid systems continues to grow, with UV degradation and moisture barrier crucial for maintaining power generation. Performance degradation over time necessitates continuous monitoring and quality assurance. Energy security is a significant factor in the market's expansion. Polymer science and anti-reflective coatings further enhance solar energy production. The value chain involves multiple stakeholders, from raw material suppliers to manufacturers, installers, and end-users. Cost analysis and chemical composition are important considerations for market growth. In summary, the market is a dynamic and evolving sector, driven by technological advancements, environmental impact, and the increasing demand for renewable energy.
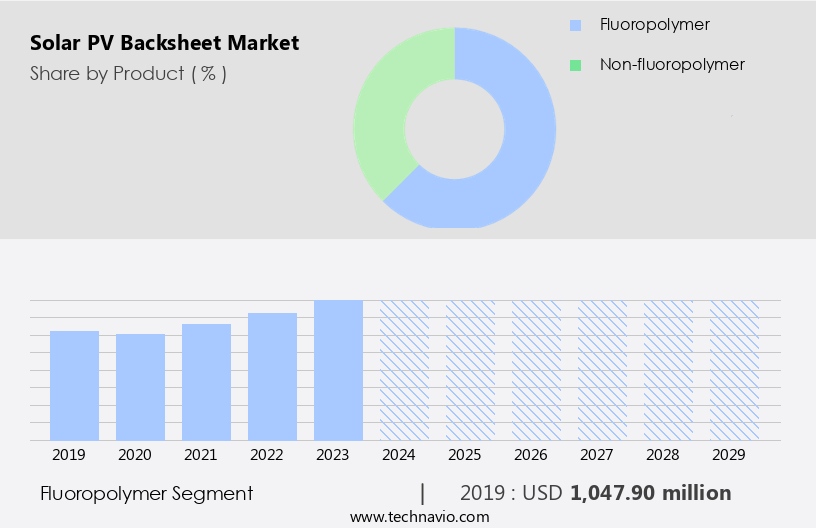
The Fluoropolymer segment was valued at USD 1.05 billion in 2019 and showed a gradual increase during the forecast period.
Regional Analysis
APAC is estimated to contribute 68% to the growth of the global market during the forecast period.Technavio's analysts have elaborately explained the regional trends and drivers that shape the market during the forecast period.

The market in the Asia Pacific (APAC) region is experiencing significant growth, fueled by increasing solar installations in China, India, Japan, South Korea, and Australia. Financial incentives, such as feed-in tariffs (FITs) in China, Japan, Vietnam, and Thailand, have substantially boosted solar PV adoption in these countries. The growing concern over greenhouse gas (GHG) emissions in China and India is further driving the shift towards renewable energy sources, including solar and wind power. Governments in the region are actively implementing policies to replace fossil fuels with solar energy, setting ambitious targets for solar-powered plants in residential and commercial sectors.
Technology advancements, such as the use of EVA film, PV panels with enhanced weather resistance, and solar cells with improved efficiency, are playing a crucial role in the market's growth. Material science and coating technology innovations, including thermal stability, moisture barrier, and UV degradation resistance, are essential for the production of high-quality, durable backsheets. Circular economy principles, including the use of recycled raw materials and energy storage systems, are gaining traction in the solar industry. Data analytics and monitoring systems enable better performance tracking, maintenance, and quality control, while grid-tied systems and off-grid solutions cater to various energy generation requirements.
The value chain involves various stakeholders, including raw material suppliers, manufacturers, installers, and utility companies. UL and IEC standards ensure product safety and performance, while mechanical strength and fire retardancy are essential considerations for ensuring the longevity and safety of solar installations. Roll-to-roll processing and laminated structures are becoming increasingly popular production methods for solar PV backsheets. Residential, commercial, and utility-scale solar installations, as well as off-grid systems, all require robust and reliable backsheets to optimize power generation and ensure energy security. Cost analysis and chemical composition are essential factors in the market's competitiveness, with ongoing research focusing on reducing production costs and improving product performance.
The market's future lies in its ability to meet the growing demand for renewable energy solutions while minimizing its environmental impact.
Market Dynamics
Our researchers analyzed the data with 2024 as the base year, along with the key drivers, trends, and challenges. A holistic analysis of drivers will help companies refine their marketing strategies to gain a competitive advantage.
What are the key market drivers leading to the rise in the adoption of Solar PV Backsheet Industry?
- The significant growth in the adoption of thin-film photovoltaic (PV) modules is the primary factor fueling market expansion in this sector.
- Thin-film solar photovolvoltaic (PV) modules, known for their cost-effectiveness and flexibility, are gaining traction in the solar energy market. These modules consist of multiple thin layers of PV films with semiconductor devices deposited on a plastic or glass substrate. Thin-film PV modules offer weather resistance, making them suitable for various applications, including grid-tied systems. Technology advancements in material science and coating technology have led to improvements in the performance and efficiency of thin-film PV modules. One such advancement is the use of Ethylene-Vinyl Acetate (EVA) film as a backing material, which enhances the durability and reliability of the modules.
- The adoption of thin-film PV modules contributes to the circular economy by reducing the carbon footprint associated with the production of traditional silicon-based modules. Data analytics plays a crucial role in optimizing the performance of these modules by providing insights into their operational efficiency and maintenance requirements. In summary, the thin-film solar PV module market is driven by its competitive cost, flexibility, and environmental benefits. The market's growth is further propelled by advancements in technology, including material science and coating technology, and the increasing focus on data analytics for optimizing performance.
What are the market trends shaping the Solar PV Backsheet Industry?
- The increasing preference for half-cut cell modules represents a significant market trend. This adoption is driven by advantages such as improved efficiency and reduced manufacturing costs compared to traditional full-cell modules.
- Solar PV backsheets play a crucial role in the production process of photovoltaic modules, providing mechanical strength, moisture barrier protection, and electrical insulation. In the evolving solar energy landscape, both utility-scale and rooftop solar installations require reliable backsheets to ensure optimal performance. Half-cut cell modules, an innovation in the solar industry, utilize advanced laser technology to precisely cut solar cells in half. This design enhances module efficiency by reducing resistance losses, making them a preferred choice over traditional full-cell modules. The solar industry adheres to stringent UL and IEC standards to ensure product quality and safety.
- Raw materials, such as polyolefin films, are essential for manufacturing solar PV backsheets. Surface morphology and energy storage integration are essential considerations in the production process. Monitoring systems enable continuous tracking of solar installations, ensuring maximum energy production and minimizing potential issues. In the context of distributed generation and the increasing integration of renewable energy into the power grid, solar PV backsheets remain a vital component in the production of efficient and durable photovoltaic modules.
What challenges does the Solar PV Backsheet Industry face during its growth?
- The issue of backsheet-related failures in photovoltaic (PV) modules poses a significant challenge to the industry's growth. This problem, which affects the performance and durability of solar panels, requires urgent attention and innovation to ensure continued expansion and efficiency in the renewable energy sector.
- Solar PV backsheets are an essential component of solar panels, protecting them from UV degradation and ensuring fire retardancy in power generation systems. As the demand for renewable energy sources continues to grow, particularly in the context of off-grid solar farms and residential and commercial installations, the value chain of solar PV backsheets is experiencing significant evolution. Recent advancements in photovoltaic technology have led to increased conversion efficiencies, with some high-performance monocrystalline panels now achieving over 24% efficiency. However, the larger number of panels required to compensate for the lower efficiency compared to fossil fuel-based power generation necessitates the use of robust and reliable backsheets.
- Roll-to-roll processing is a promising technology in the production of solar PV backsheets, offering cost savings and increased efficiency. Quality control measures, such as thermal stability and UV resistance testing, are crucial to ensure the longevity and performance of these backsheets. Junction boxes, an integral part of solar panel installations, also benefit from the advancements in backsheet technology. Fire retardant backsheets provide an additional layer of safety, reducing the risk of fires in the event of a fault or malfunction. The market is poised for growth, driven by the increasing demand for renewable energy sources and advancements in photovoltaic technology.
- The focus on quality control, thermal stability, and fire retardancy will continue to be essential factors in the development of this market.
Exclusive Customer Landscape
The solar pv backsheet market forecasting report includes the adoption lifecycle of the market, covering from the innovator's stage to the laggard's stage. It focuses on adoption rates in different regions based on penetration. Furthermore, the solar pv backsheet market report also includes key purchase criteria and drivers of price sensitivity to help companies evaluate and develop their market growth analysis strategies.

Customer Landscape
Key Companies & Market Insights
Companies are implementing various strategies, such as strategic alliances, solar pv backsheet market forecast, partnerships, mergers and acquisitions, geographical expansion, and product/service launches, to enhance their presence in the industry.
3M Co. - The company specializes in advanced solar PV backsheets, engineered with cutting-edge fluoropolymer technology. This technology, backed by extensive field testing and years of proven performance, fortifies modules against environmental elements. The backsheets' robust design ensures optimal module protection, enhancing energy efficiency and longevity. The company's commitment to innovation and quality is reflected in every product, delivering superior value to clients worldwide.
The industry research and growth report includes detailed analyses of the competitive landscape of the market and information about key companies, including:
- 3M Co.
- Agfa Gevaert NV
- Arkema
- COVEME Spa
- Cybrid Technologies Inc.
- DSM-Firmenich AG
- Dunmore Corp.
- DuPont de Nemours Inc.
- FLEXcon Co. Inc.
- Honeywell International Inc.
- Jiangsu Zhongtian Technology Co Ltd
- Jolywood Suzhou Sunwatt Co. Ltd.
- KREMPEL GmbH
- Mitsubishi Corp.
- Nippon Light Metal Holdings Co. Ltd.
- Targray Technology International Inc.
- Tomark Worthen LLC
- Toppan Printing Co Ltd
- Toray Industries Inc.
- Toyobo Co. Ltd.
Qualitative and quantitative analysis of companies has been conducted to help clients understand the wider business environment as well as the strengths and weaknesses of key industry players. Data is qualitatively analyzed to categorize companies as pure play, category-focused, industry-focused, and diversified; it is quantitatively analyzed to categorize companies as dominant, leading, strong, tentative, and weak.
Recent Development and News in Solar PV Backsheet Market
- In February 2023, REC Group, a leading solar panel manufacturer, announced the launch of its new REC Alpha Series solar panels featuring Alpha Glass, an advanced backsheet technology that enhances module durability and efficiency by up to 5% (REC Group press release). In May 2023, First Solar, a major solar technology provider, entered into a strategic partnership with Hemlock Semiconductor Corporation to secure a long-term supply of high-purity polysilicon for its solar modules, strengthening its position in the market (First Solar press release).
- In September 2024, Hanwha Q CELLS, a global solar cell and module manufacturer, completed the acquisition of Heliana Energy, a leading solar backsheet manufacturer, expanding its product portfolio and increasing its market share in the market (Hanwha Q CELLS press release). In January 2025, the European Union announced the Solar PV Backsheet Regulation, mandating the use of fire-resistant backsheets for all new solar installations in the EU from 2027, driving demand for specialized solar PV backsheet solutions (European Commission press release). These developments underscore the growing importance of advanced backsheet technology, strategic partnerships, and regulatory compliance in the market.
Research Analyst Overview
- The market is experiencing significant growth as renewable energy sources gain prominence in the energy transition. These backsheets, integral to the functionality and durability of solar panels, are subjected to rigorous field performance testing to ensure optimal energy output and carbon emission reduction. Manufacturers prioritize chemical resistance, thermal conductivity, and UV resistance to enhance the backsheet's life cycle assessment and waste management. Green technology is at the forefront of innovation, with backsheet producers focusing on improving optical properties, flexural strength, and dielectric strength. Tensile strength and failure analysis are crucial factors in ensuring backsheet durability and reliability.
- Moreover, degradation mechanisms and corrosion resistance are essential considerations in the development of sustainable backsheets. As the demand for sustainable manufacturing practices increases, companies are integrating green manufacturing processes into their production lines. The market is poised for continued growth, driven by the need for high-performing, eco-friendly materials that support the energy transition and contribute to sustainable development.
Dive into Technavio's robust research methodology, blending expert interviews, extensive data synthesis, and validated models for unparalleled Solar PV Backsheet Market insights. See full methodology.
|
Market Scope |
|
|
Report Coverage |
Details |
|
Page number |
223 |
|
Base year |
2024 |
|
Historic period |
2019-2023 |
|
Forecast period |
2025-2029 |
|
Growth momentum & CAGR |
Accelerate at a CAGR of 12.7% |
|
Market growth 2025-2029 |
USD 2246.5 million |
|
Market structure |
Fragmented |
|
YoY growth 2024-2025(%) |
11.1 |
|
Key countries |
China, Japan, Australia, Germany, US, UK, Canada, France, India, and Italy |
|
Competitive landscape |
Leading Companies, Market Positioning of Companies, Competitive Strategies, and Industry Risks |
What are the Key Data Covered in this Solar PV Backsheet Market Research and Growth Report?
- CAGR of the Solar PV Backsheet industry during the forecast period
- Detailed information on factors that will drive the growth and forecasting between 2025 and 2029
- Precise estimation of the size of the market and its contribution of the industry in focus to the parent market
- Accurate predictions about upcoming growth and trends and changes in consumer behaviour
- Growth of the market across APAC, Europe, North America, South America, and Middle East and Africa
- Thorough analysis of the market's competitive landscape and detailed information about companies
- Comprehensive analysis of factors that will challenge the solar pv backsheet market growth of industry companies
We can help! Our analysts can customize this solar pv backsheet market research report to meet your requirements.
 RIA -
RIA - 
