Solid-state Cooling Market Analysis, Size, and Forecast 2026-2030: APAC (China, Japan, and India), North America (US, Canada, and Mexico), Europe (Germany, UK, and France), Middle East and Africa (Saudi Arabia, UAE, and South Africa), South America (Brazil, Argentina, and Colombia), and Rest of World (ROW)

Solid-state Cooling Market Analysis, Size, and Forecast 2026-2030:
APAC (China, Japan, and India), North America (US, Canada, and Mexico), Europe (Germany, UK, and France), Middle East and Africa (Saudi Arabia, UAE, and South Africa), South America (Brazil, Argentina, and Colombia), and Rest of World (ROW)

Published: Dec 2025 290 Pages SKU: IRTNTR75061

Market Overview at a Glance

$399.6 Mn
Market Opportunity
8.1%
CAGR 2025 - 2030
43.7%
APAC Growth
$447.4 Mn
Single stage segment 2024

Solid-state Cooling Market Size 2026-2030

The solid-state cooling market size is valued to increase by USD 399.6 million, at a CAGR of 8.1% from 2025 to 2030. Surging demand for energy-efficient and environmentally conscious cooling technologies will drive the solid-state cooling market.

Major Market Trends & Insights

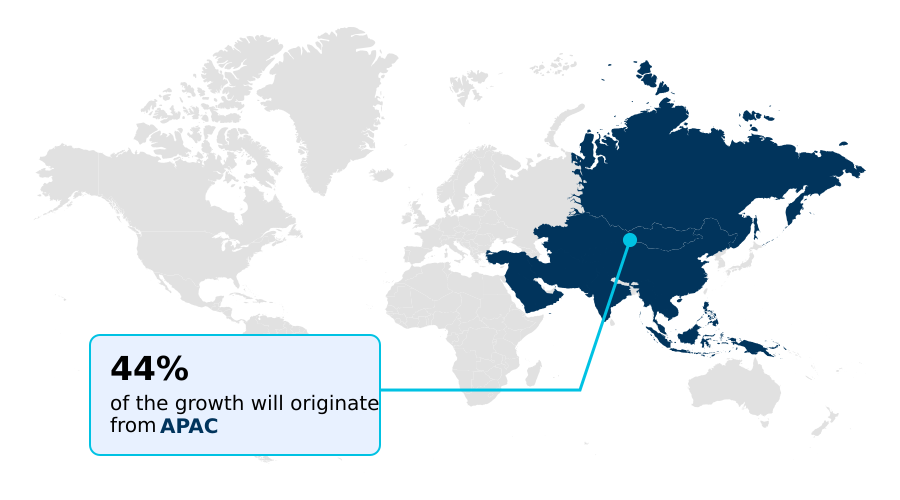
  • APAC dominated the market and accounted for a 43.7% growth during the forecast period.
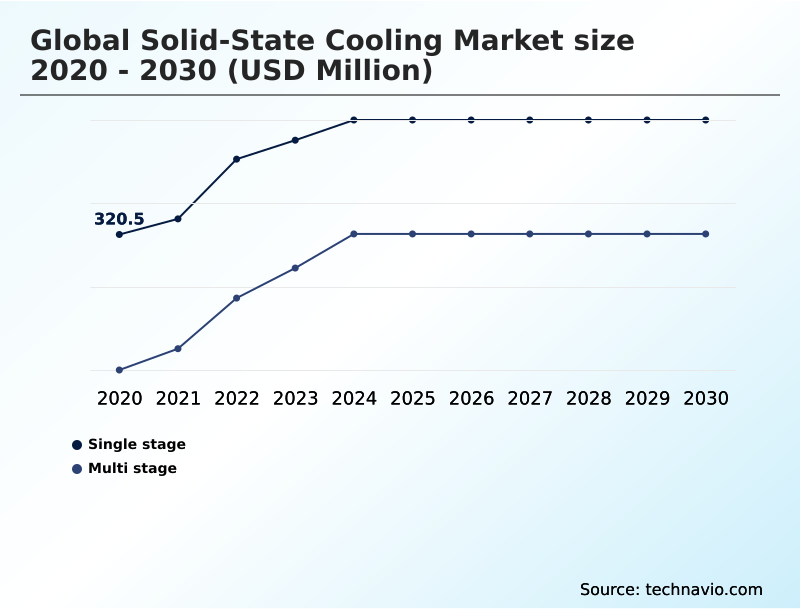
  • By Type - Single stage segment was valued at USD 447.4 million in 2024
  • By End-user - Automotive segment accounted for the largest market revenue share in 2024

Market Size & Forecast

  • Market Opportunities: USD 744.1 million
  • Market Future Opportunities: USD 399.6 million
  • CAGR from 2025 to 2030 : 8.1%

Market Summary

  • The Solid-State Cooling Market is defined by a shift toward more sustainable and efficient thermal management solutions. Driven by stringent regulations phasing out traditional refrigerants and the increasing power density of electronics, the industry is seeing wider adoption of thermoelectric coolers and related technologies.
  • Key trends include the integration of these systems into electric vehicles for EV battery thermal management and the miniaturization of modules for consumer electronics and 5G infrastructure. While challenges related to initial cost and heat pumping capacity persist, ongoing advancements in materials science are improving performance.
  • For example, a medical device OEM might implement solid-state systems to achieve the precise, vibration-free temperature control required for diagnostic equipment, ensuring result accuracy and enhancing device longevity while meeting environmental compliance standards. This pursuit of precision, reliability, and sustainability is expanding the technology's footprint across the automotive, healthcare, and high-performance computing sectors.

What will be the Size of the Solid-state Cooling Market during the forecast period?

Get Key Insights on Market Forecast (PDF) Request Free Sample

How is the Solid-state Cooling Market Segmented?

The solid-state cooling industry research report provides comprehensive data (region-wise segment analysis), with forecasts and estimates in "USD million" for the period 2026-2030, as well as historical data from 2020-2024 for the following segments.

  • Type
    • Single stage
    • Multi stage
  • End-user
    • Automotive
    • Semiconductor and electronics
    • Healthcare
    • Consumer
  • Technology
    • Electrocaloric cooling
    • Magnetocaloric cooling
  • Geography
    • APAC
      • China
      • Japan
      • India
    • North America
      • US
      • Canada
      • Mexico
    • Europe
      • Germany
      • UK
      • France
    • Middle East and Africa
      • Saudi Arabia
      • UAE
      • South Africa
    • South America
      • Brazil
      • Argentina
      • Colombia
    • Rest of World (ROW)

By Type Insights

The single stage segment is estimated to witness significant growth during the forecast period.

Single-stage modules represent a foundational category within the thermal management industry, providing a compact and lightweight vapor-compression refrigeration alternative.

Key market drivers include the demand for precision temperature control in high-performance computing systems and the need for silent operation in various consumer and medical applications.

The technology’s design, which inherently leads to reduced maintenance requirements, enhances its appeal for deployments where long-term reliability is critical. As industries increasingly adopt energy-efficient cooling strategies, these modules offer a compelling solution.

Systems utilizing this technology have demonstrated energy efficiency improvements of up to 47% compared to conventional methods in certain low-power applications, reinforcing their value in space-constrained and power-sensitive environments.

Request Free Sample

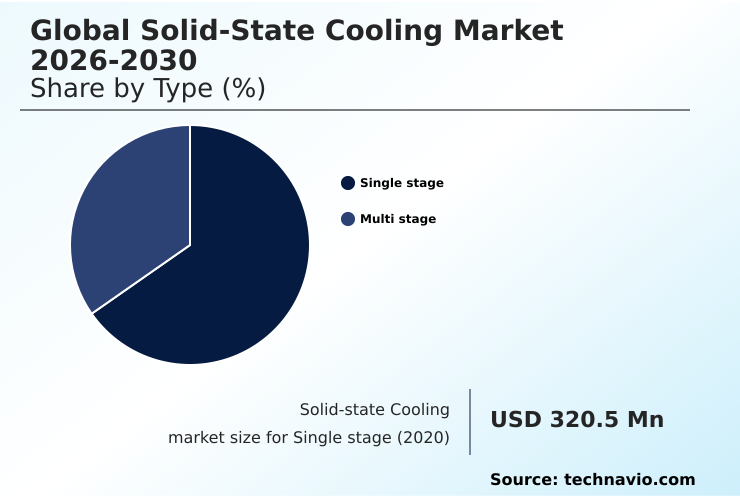
The Single stage segment was valued at USD 447.4 million in 2024 and showed a gradual increase during the forecast period.

Request Free Sample

Regional Analysis

APAC is estimated to contribute 43.7% to the growth of the global market during the forecast period.Technavio’s analysts have elaborately explained the regional trends and drivers that shape the market during the forecast period.

See How Solid-state Cooling Market Demand is Rising in APAC Request Free Sample

The geographic landscape is dominated by APAC, which accounts for 43.7% of the market, driven by its massive semiconductor and electronics manufacturing ecosystem. North America and Europe follow, with strong demand from aerospace, medical, and automotive sectors.

Regional dynamics are shaped by specialized high-tech needs. For instance, the development of quantum computing cooling and satellite avionics cooling is concentrated in regions with advanced R&D infrastructure.

Similarly, demand for cooling in military hardware and high-precision lasers is prominent in nations with significant defense and scientific industries.

The use of solid-state systems in analytical instruments and medical imaging systems is growing globally, with adoption rates in specialized medical applications increasing by nearly 15% in developed regions.

This highlights a global trend toward adopting high-reliability solutions for critical, high-value equipment.

Market Dynamics

Our researchers analyzed the data with 2025 as the base year, along with the key drivers, trends, and challenges. A holistic analysis of drivers will help companies refine their marketing strategies to gain a competitive advantage.

  • Strategic decision-making in the industry involves a detailed analysis of solid-state cooling versus vapor compression, particularly as applications diversify. For instance, the selection of solid-state cooling for electric vehicles is driven by the need for enhanced battery longevity and performance. Similarly, the use of thermoelectric modules for medical diagnostics highlights the technology’s precision.
  • In parallel, magnetocaloric cooling in commercial refrigeration is gaining traction as a green alternative. The push for compact cooling for high-performance computing and advanced thermal management for 5G infrastructure underscores the need for innovation. This has spurred high-efficiency thermoelectric materials development, with a focus on improving ZT value in thermoelectric materials to create more cost-effective solid-state refrigeration solutions.
  • Such advancements are crucial for the deployment of solid-state cooling for data centers and solid-state air conditioning systems. The technology’s versatility is evident in its use for thermal management of semiconductor equipment, thermoelectric cooling in consumer electronics, portable solid-state cooling devices, and solid-state cooling for laser systems.
  • Despite challenges in scaling solid-state cooling, the reliability of thermoelectric cooling systems in demanding fields like thermoelectric coolers in aerospace applications is well-established. The environmental benefits of solid-state cooling position it for long-term growth, shaping the future of solid-state cooling technology. Companies adopting these systems report maintenance cycle extensions of over 60% compared to mechanical counterparts, a significant operational advantage.

What are the key market drivers leading to the rise in the adoption of Solid-state Cooling Industry?

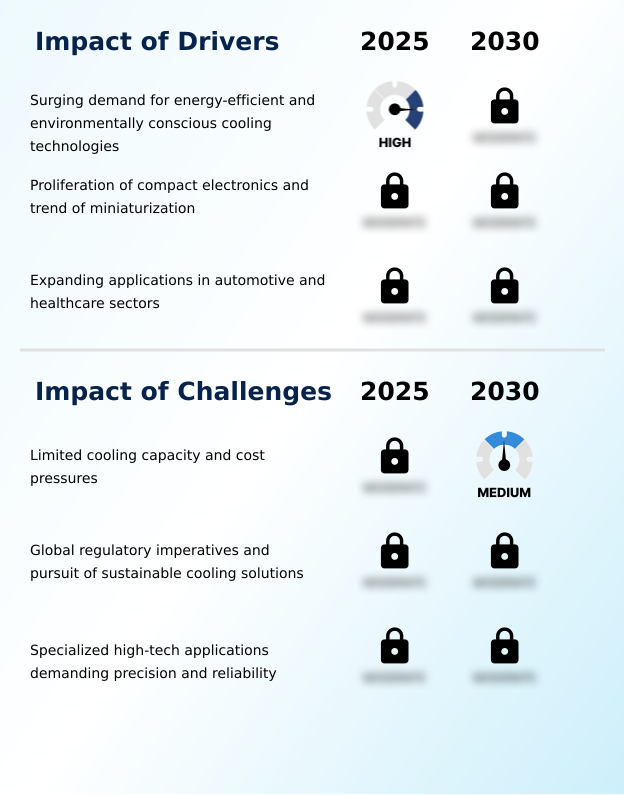
  • The surging demand for energy-efficient and environmentally conscious cooling technologies stands as a key driver for market growth.

  • Market growth is significantly driven by a global push toward sustainability and technological advancement. Investments in green infrastructure and the mandate for HFC-free systems are compelling industries to adopt cleaner alternatives.
  • This shift is particularly evident in data center cooling solutions, where energy efficiency is paramount, with advanced systems reducing cooling-related energy use by up to 30%.
  • In parallel, the expansion of 5G infrastructure cooling requirements and the increasing sophistication of industrial automation equipment demand more compact and reliable thermal management.
  • Sectors like aerospace and defense electronics are also key adopters, where performance in extreme environments is non-negotiable. These drivers collectively create a robust demand landscape for advanced, reliable cooling technologies.

What are the market trends shaping the Solid-state Cooling Industry?

  • The persistent trend toward miniaturization and deeper integration within advanced electronics is a significant factor shaping the market. This movement creates escalating demand for more compact and efficient thermal management solutions.

  • Key trends are driven by the need for environmentally friendly cooling in expanding high-tech sectors. In automotive, the focus on EV battery thermal management and enhanced passenger comfort through climate-controlled seating is creating significant demand.
  • The healthcare industry's reliance on precise medical device cooling and high-reliability cooling for diagnostics is another major growth vector, with adoption in such critical systems growing by over 12% annually. Furthermore, the expansion of cold chain logistics for pharmaceuticals and other sensitive goods requires more efficient and dependable solutions than ever.
  • This trend toward specialized, high-performance applications is pushing innovation in module design and material efficiency, opening new opportunities across multiple industries.

What challenges does the Solid-state Cooling Industry face during its growth?

  • Limited cooling capacity and persistent cost pressures present a key challenge affecting industry growth.

  • The market faces challenges in balancing performance with cost, particularly as high-power density components become more common in consumer electronics cooling. The push for advanced packaging techniques in semiconductors concentrates heat, demanding more effective dissipation than current cost-effective solutions can always provide.
  • While the industry is shifting toward low GWP refrigerants, solid-state alternatives must still overcome hurdles in scalability and initial investment. The demand for portable medical devices and advanced scientific instrumentation cooling requires compact and highly efficient systems, but material costs can be a constraint.
  • Innovations in material science are improving efficiency by over 10% in laboratory settings, but translating these gains into mass-produced, affordable components remains a primary focus for overcoming market barriers.

Exclusive Technavio Analysis on Customer Landscape

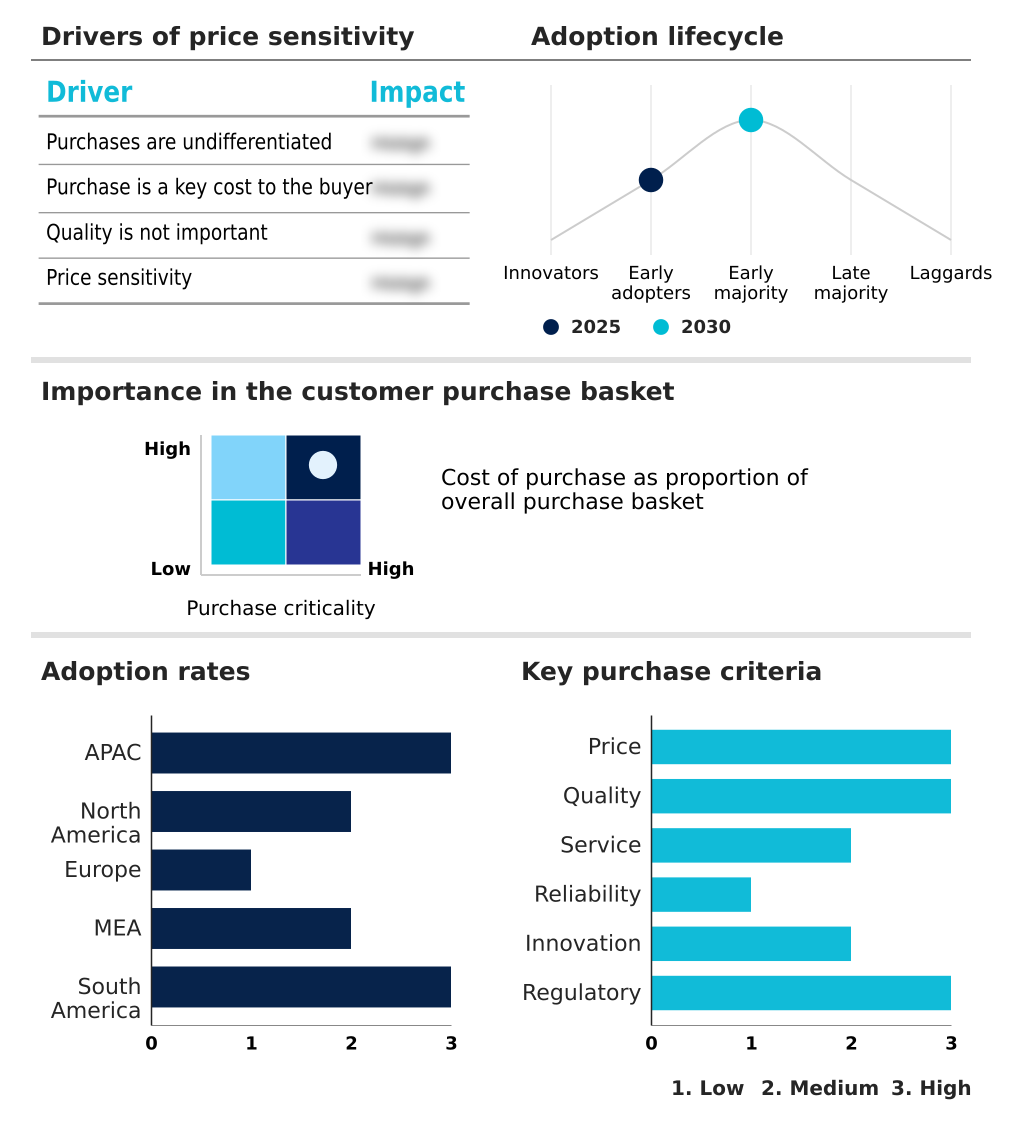
The solid-state cooling market forecasting report includes the adoption lifecycle of the market, covering from the innovator’s stage to the laggard’s stage. It focuses on adoption rates in different regions based on penetration. Furthermore, the solid-state cooling market report also includes key purchase criteria and drivers of price sensitivity to help companies evaluate and develop their market growth analysis strategies.

Customer Landscape of Solid-state Cooling Industry

Competitive Landscape

Companies are implementing various strategies, such as strategic alliances, solid-state cooling market forecast, partnerships, mergers and acquisitions, geographical expansion, and product/service launches, to enhance their presence in the industry.

AMS Technologies AG - Offers advanced thermoelectric modules and custom solid-state assemblies, providing precise, compact thermal management for critical industrial, medical, and electronics applications.

The industry research and growth report includes detailed analyses of the competitive landscape of the market and information about key companies, including:

  • AMS Technologies AG
  • Crystal Ltd.
  • CustomChill Inc.
  • EVERREDtronics
  • Ferrotec Holdings Corp.
  • Kryotherm
  • Phononic
  • RMT Ltd.
  • Sheetak Inc.
  • Tark Thermal Solutions GmbH
  • TE Technology Inc.
  • TEC Microsystems GmbH
  • Tellurex Corp.
  • Wellen Technology Co. Ltd.
  • XIDAS Inc.

Qualitative and quantitative analysis of companies has been conducted to help clients understand the wider business environment as well as the strengths and weaknesses of key industry players. Data is qualitatively analyzed to categorize companies as pure play, category-focused, industry-focused, and diversified; it is quantitatively analyzed to categorize companies as dominant, leading, strong, tentative, and weak.

Recent Development and News in Solid-state cooling market

  • In August 2025, Hyundai Motor Group patented a solid-state battery technology using copper, a development closely linked to advanced EV thermal management needs.
  • In December 2024, reports indicated that Hyundai was finalizing a pilot production line for solid-state batteries at its South Korean R&D center, with vehicle testing slated for 2025.
  • In October 2024, the United States Environmental Protection Agency issued its Final Rule on HFC Management, establishing measures to reduce emissions and mandate reclamation, thereby incentivizing HFC-free cooling alternatives.
  • In May 2025, the UK's Advanced Research and Invention Agency committed approximately $57 million in funding for research projects focused on climate cooling technologies, invigorating innovation in advanced materials and thermodynamic cycles.

Dive into Technavio’s robust research methodology, blending expert interviews, extensive data synthesis, and validated models for unparalleled Solid-state Cooling Market insights. See full methodology.

Market Scope
Page number 290
Base year 2025
Historic period 2020-2024
Forecast period 2026-2030
Growth momentum & CAGR Accelerate at a CAGR of 8.1%
Market growth 2026-2030 USD 399.6 million
Market structure Fragmented
YoY growth 2025-2026(%) 8.9%
Key countries China, Japan, India, South Korea, Australia, Indonesia, US, Canada, Mexico, Germany, UK, France, Italy, Spain, The Netherlands, Saudi Arabia, UAE, South Africa, Turkey, Israel, Brazil, Argentina and Colombia
Competitive landscape Leading Companies, Market Positioning of Companies, Competitive Strategies, and Industry Risks

Request Free Sample

Research Analyst Overview

  • The market is fundamentally reshaped by regulatory pressures mandating sustainable thermal management solutions, forcing boardroom-level decisions on product lifecycle and compliance strategy. The phase-down of HFCs necessitates a shift toward advanced thermoelectric converters and other solid-state technologies. Innovation is centered on improving the figure of merit ZT of core semiconductor materials, moving beyond traditional bismuth telluride to explore nanostructured materials.
  • Development of micro thermoelectric coolers and specialized thermoelectric assemblies is critical. These systems provide precise temperature stability and vibration-free operation, essential for high-density packages in electronics, where thermal design increasingly uses advanced thermal simulation tools. Engineers are integrating thermoelectric modules, including single stage modules and multi stage modules capable of cryogenic temperatures, into thermoelectric liquid chillers.
  • The goal is to improve heat pumping capacity and achieve effective heat dissipation methods, preventing thermal throttling.
  • These active cooling chip solutions, featuring robust ceramic components and moving away from bulky heat sinks, are key for applications from advanced semiconductor packaging like fan-out wafer-level packaging to waste heat recovery using thermoelectric generators, all based on the peltier effect and sometimes magnetocaloric cooling or electrocaloric cooling.

What are the Key Data Covered in this Solid-state Cooling Market Research and Growth Report?

  • What is the expected growth of the Solid-state Cooling Market between 2026 and 2030?

    • USD 399.6 million, at a CAGR of 8.1%

  • What segmentation does the market report cover?

    • The report is segmented by Type (Single stage, and Multi stage), End-user (Automotive, Semiconductor and electronics, Healthcare, and Consumer), Technology (Electrocaloric cooling, and Magnetocaloric cooling) and Geography (APAC, North America, Europe, Middle East and Africa, South America)

  • Which regions are analyzed in the report?

    • APAC, North America, Europe, Middle East and Africa and South America

  • What are the key growth drivers and market challenges?

    • Surging demand for energy-efficient and environmentally conscious cooling technologies, Limited cooling capacity and cost pressures

  • Who are the major players in the Solid-state Cooling Market?

    • AMS Technologies AG, Crystal Ltd., CustomChill Inc., EVERREDtronics, Ferrotec Holdings Corp., Kryotherm, Phononic, RMT Ltd., Sheetak Inc., Tark Thermal Solutions GmbH, TE Technology Inc., TEC Microsystems GmbH, Tellurex Corp., Wellen Technology Co. Ltd. and XIDAS Inc.

Market Research Insights

  • The market's dynamics are shaped by a push for higher operational efficiency and sustainability across high-tech sectors. The adoption of advanced solid-state systems in advanced telecommunications equipment and medical imaging systems is accelerating, driven by the need for superior temperature stability. In laboratory equipment cooling, these technologies enable precision that is unattainable with conventional methods.
  • For instance, integrated systems have demonstrated the ability to reduce energy consumption in targeted cooling applications by up to 40% compared to legacy solutions.
  • Furthermore, their solid-state nature eliminates mechanical failure points, leading to a reliability improvement that can decrease device downtime by over 50% in critical settings, providing a strong incentive for adoption in sectors where performance and uptime are paramount.

We can help! Our analysts can customize this solid-state cooling market research report to meet your requirements.

Get in touch

1. Executive Summary

1.1 Market overview

Executive Summary - Chart on Market Overview
Executive Summary - Data Table on Market Overview
Executive Summary - Chart on Global Market Characteristics
Executive Summary - Chart on Market by Geography
Executive Summary - Chart on Market Segmentation by Type
Executive Summary - Chart on Market Segmentation by End-user
Executive Summary - Chart on Market Segmentation by Technology
Executive Summary - Chart on Incremental Growth
Executive Summary - Data Table on Incremental Growth
Executive Summary - Chart on Company Market Positioning

2. Technavio Analysis

2.1 Analysis of price sensitivity, lifecycle, customer purchase basket, adoption rates, and purchase criteria

2.2 Criticality of inputs and Factors of differentiation

Chart on Overview on criticality of inputs and factors of differentiation

2.3 Factors of disruption

Chart on Overview on factors of disruption

2.4 Impact of drivers and challenges

Chart on Impact of drivers and challenges in 2025 and 2030

3. Market Landscape

3.1 Market ecosystem

Chart on Parent Market
Data Table on - Parent Market

3.2 Market characteristics

Chart on Market characteristics analysis

3.3 Value chain analysis

Chart on Value chain analysis

4. Market Sizing

4.1 Market definition

Data Table on Offerings of companies included in the market definition

4.2 Market segment analysis

Market segments

4.3 Market size 2025

4.4 Market outlook: Forecast for 2025-2030

Chart on Global - Market size and forecast 2025-2030 ($ million)
Data Table on Global - Market size and forecast 2025-2030 ($ million)
Chart on Global Market: Year-over-year growth 2025-2030 (%)
Data Table on Global Market: Year-over-year growth 2025-2030 (%)

5. Historic Market Size

5.1 Global Solid-State Cooling Market 2020 - 2024

Historic Market Size - Data Table on Global Solid-State Cooling Market 2020 - 2024 ($ million)

5.2 Type segment analysis 2020 - 2024

Historic Market Size - Type Segment 2020 - 2024 ($ million)

5.3 End-user segment analysis 2020 - 2024

Historic Market Size - End-user Segment 2020 - 2024 ($ million)

5.4 Technology segment analysis 2020 - 2024

Historic Market Size - Technology Segment 2020 - 2024 ($ million)

5.5 Geography segment analysis 2020 - 2024

Historic Market Size - Geography Segment 2020 - 2024 ($ million)

5.6 Country segment analysis 2020 - 2024

Historic Market Size - Country Segment 2020 - 2024 ($ million)

6. Qualitative Analysis

6.1 Impact of AI on the Global Solid-State Cooling Market

7. Five Forces Analysis

7.1 Five forces summary

Five forces analysis - Comparison between 2025 and 2030

7.2 Bargaining power of buyers

Bargaining power of buyers - Impact of key factors 2025 and 2030

7.3 Bargaining power of suppliers

Bargaining power of suppliers - Impact of key factors in 2025 and 2030

7.4 Threat of new entrants

Threat of new entrants - Impact of key factors in 2025 and 2030

7.5 Threat of substitutes

Threat of substitutes - Impact of key factors in 2025 and 2030

7.6 Threat of rivalry

Threat of rivalry - Impact of key factors in 2025 and 2030

7.7 Market condition

Chart on Market condition - Five forces 2025 and 2030

8. Market Segmentation by Type

8.1 Market segments

Chart on Type - Market share 2025-2030 (%)
Data Table on Type - Market share 2025-2030 (%)

8.2 Comparison by Type

Chart on Comparison by Type
Data Table on Comparison by Type

8.3 Single stage - Market size and forecast 2025-2030

Chart on Single stage - Market size and forecast 2025-2030 ($ million)
Data Table on Single stage - Market size and forecast 2025-2030 ($ million)
Chart on Single stage - Year-over-year growth 2025-2030 (%)
Data Table on Single stage - Year-over-year growth 2025-2030 (%)

8.4 Multi stage - Market size and forecast 2025-2030

Chart on Multi stage - Market size and forecast 2025-2030 ($ million)
Data Table on Multi stage - Market size and forecast 2025-2030 ($ million)
Chart on Multi stage - Year-over-year growth 2025-2030 (%)
Data Table on Multi stage - Year-over-year growth 2025-2030 (%)

8.5 Market opportunity by Type

Market opportunity by Type ($ million)
Data Table on Market opportunity by Type ($ million)

9. Market Segmentation by End-user

9.1 Market segments

Chart on End-user - Market share 2025-2030 (%)
Data Table on End-user - Market share 2025-2030 (%)

9.2 Comparison by End-user

Chart on Comparison by End-user
Data Table on Comparison by End-user

9.3 Automotive - Market size and forecast 2025-2030

Chart on Automotive - Market size and forecast 2025-2030 ($ million)
Data Table on Automotive - Market size and forecast 2025-2030 ($ million)
Chart on Automotive - Year-over-year growth 2025-2030 (%)
Data Table on Automotive - Year-over-year growth 2025-2030 (%)

9.4 Semiconductor and electronics - Market size and forecast 2025-2030

Chart on Semiconductor and electronics - Market size and forecast 2025-2030 ($ million)
Data Table on Semiconductor and electronics - Market size and forecast 2025-2030 ($ million)
Chart on Semiconductor and electronics - Year-over-year growth 2025-2030 (%)
Data Table on Semiconductor and electronics - Year-over-year growth 2025-2030 (%)

9.5 Healthcare - Market size and forecast 2025-2030

Chart on Healthcare - Market size and forecast 2025-2030 ($ million)
Data Table on Healthcare - Market size and forecast 2025-2030 ($ million)
Chart on Healthcare - Year-over-year growth 2025-2030 (%)
Data Table on Healthcare - Year-over-year growth 2025-2030 (%)

9.6 Consumer - Market size and forecast 2025-2030

Chart on Consumer - Market size and forecast 2025-2030 ($ million)
Data Table on Consumer - Market size and forecast 2025-2030 ($ million)
Chart on Consumer - Year-over-year growth 2025-2030 (%)
Data Table on Consumer - Year-over-year growth 2025-2030 (%)

9.7 Market opportunity by End-user

Market opportunity by End-user ($ million)
Data Table on Market opportunity by End-user ($ million)

10. Market Segmentation by Technology

10.1 Market segments

Chart on Technology - Market share 2025-2030 (%)
Data Table on Technology - Market share 2025-2030 (%)

10.2 Comparison by Technology

Chart on Comparison by Technology
Data Table on Comparison by Technology

10.3 Electrocaloric cooling - Market size and forecast 2025-2030

Chart on Electrocaloric cooling - Market size and forecast 2025-2030 ($ million)
Data Table on Electrocaloric cooling - Market size and forecast 2025-2030 ($ million)
Chart on Electrocaloric cooling - Year-over-year growth 2025-2030 (%)
Data Table on Electrocaloric cooling - Year-over-year growth 2025-2030 (%)

10.4 Magnetocaloric cooling - Market size and forecast 2025-2030

Chart on Magnetocaloric cooling - Market size and forecast 2025-2030 ($ million)
Data Table on Magnetocaloric cooling - Market size and forecast 2025-2030 ($ million)
Chart on Magnetocaloric cooling - Year-over-year growth 2025-2030 (%)
Data Table on Magnetocaloric cooling - Year-over-year growth 2025-2030 (%)

10.5 Market opportunity by Technology

Market opportunity by Technology ($ million)
Data Table on Market opportunity by Technology ($ million)

11. Customer Landscape

11.1 Customer landscape overview

Analysis of price sensitivity, lifecycle, customer purchase basket, adoption rates, and purchase criteria

12. Geographic Landscape

12.1 Geographic segmentation

Chart on Market share by geography 2025-2030 (%)
Data Table on Market share by geography 2025-2030 (%)

12.2 Geographic comparison

Chart on Geographic comparison
Data Table on Geographic comparison

12.3 APAC - Market size and forecast 2025-2030

Chart on APAC - Market size and forecast 2025-2030 ($ million)
Data Table on APAC - Market size and forecast 2025-2030 ($ million)
Chart on APAC - Year-over-year growth 2025-2030 (%)
Data Table on APAC - Year-over-year growth 2025-2030 (%)
Chart on Regional Comparison - APAC
Data Table on Regional Comparison - APAC

12.3.1 China - Market size and forecast 2025-2030

Chart on China - Market size and forecast 2025-2030 ($ million)
Data Table on China - Market size and forecast 2025-2030 ($ million)
Chart on China - Year-over-year growth 2025-2030 (%)
Data Table on China - Year-over-year growth 2025-2030 (%)

12.3.2 Japan - Market size and forecast 2025-2030

Chart on Japan - Market size and forecast 2025-2030 ($ million)
Data Table on Japan - Market size and forecast 2025-2030 ($ million)
Chart on Japan - Year-over-year growth 2025-2030 (%)
Data Table on Japan - Year-over-year growth 2025-2030 (%)

12.3.3 India - Market size and forecast 2025-2030

Chart on India - Market size and forecast 2025-2030 ($ million)
Data Table on India - Market size and forecast 2025-2030 ($ million)
Chart on India - Year-over-year growth 2025-2030 (%)
Data Table on India - Year-over-year growth 2025-2030 (%)

12.3.4 South Korea - Market size and forecast 2025-2030

Chart on South Korea - Market size and forecast 2025-2030 ($ million)
Data Table on South Korea - Market size and forecast 2025-2030 ($ million)
Chart on South Korea - Year-over-year growth 2025-2030 (%)
Data Table on South Korea - Year-over-year growth 2025-2030 (%)

12.3.5 Australia - Market size and forecast 2025-2030

Chart on Australia - Market size and forecast 2025-2030 ($ million)
Data Table on Australia - Market size and forecast 2025-2030 ($ million)
Chart on Australia - Year-over-year growth 2025-2030 (%)
Data Table on Australia - Year-over-year growth 2025-2030 (%)

12.3.6 Indonesia - Market size and forecast 2025-2030

Chart on Indonesia - Market size and forecast 2025-2030 ($ million)
Data Table on Indonesia - Market size and forecast 2025-2030 ($ million)
Chart on Indonesia - Year-over-year growth 2025-2030 (%)
Data Table on Indonesia - Year-over-year growth 2025-2030 (%)

12.4 North America - Market size and forecast 2025-2030

Chart on North America - Market size and forecast 2025-2030 ($ million)
Data Table on North America - Market size and forecast 2025-2030 ($ million)
Chart on North America - Year-over-year growth 2025-2030 (%)
Data Table on North America - Year-over-year growth 2025-2030 (%)
Chart on Regional Comparison - North America
Data Table on Regional Comparison - North America

12.4.1 US - Market size and forecast 2025-2030

Chart on US - Market size and forecast 2025-2030 ($ million)
Data Table on US - Market size and forecast 2025-2030 ($ million)
Chart on US - Year-over-year growth 2025-2030 (%)
Data Table on US - Year-over-year growth 2025-2030 (%)

12.4.2 Canada - Market size and forecast 2025-2030

Chart on Canada - Market size and forecast 2025-2030 ($ million)
Data Table on Canada - Market size and forecast 2025-2030 ($ million)
Chart on Canada - Year-over-year growth 2025-2030 (%)
Data Table on Canada - Year-over-year growth 2025-2030 (%)

12.4.3 Mexico - Market size and forecast 2025-2030

Chart on Mexico - Market size and forecast 2025-2030 ($ million)
Data Table on Mexico - Market size and forecast 2025-2030 ($ million)
Chart on Mexico - Year-over-year growth 2025-2030 (%)
Data Table on Mexico - Year-over-year growth 2025-2030 (%)

12.5 Europe - Market size and forecast 2025-2030

Chart on Europe - Market size and forecast 2025-2030 ($ million)
Data Table on Europe - Market size and forecast 2025-2030 ($ million)
Chart on Europe - Year-over-year growth 2025-2030 (%)
Data Table on Europe - Year-over-year growth 2025-2030 (%)
Chart on Regional Comparison - Europe
Data Table on Regional Comparison - Europe

12.5.1 Germany - Market size and forecast 2025-2030

Chart on Germany - Market size and forecast 2025-2030 ($ million)
Data Table on Germany - Market size and forecast 2025-2030 ($ million)
Chart on Germany - Year-over-year growth 2025-2030 (%)
Data Table on Germany - Year-over-year growth 2025-2030 (%)

12.5.2 UK - Market size and forecast 2025-2030

Chart on UK - Market size and forecast 2025-2030 ($ million)
Data Table on UK - Market size and forecast 2025-2030 ($ million)
Chart on UK - Year-over-year growth 2025-2030 (%)
Data Table on UK - Year-over-year growth 2025-2030 (%)

12.5.3 France - Market size and forecast 2025-2030

Chart on France - Market size and forecast 2025-2030 ($ million)
Data Table on France - Market size and forecast 2025-2030 ($ million)
Chart on France - Year-over-year growth 2025-2030 (%)
Data Table on France - Year-over-year growth 2025-2030 (%)

12.5.4 Italy - Market size and forecast 2025-2030

Chart on Italy - Market size and forecast 2025-2030 ($ million)
Data Table on Italy - Market size and forecast 2025-2030 ($ million)
Chart on Italy - Year-over-year growth 2025-2030 (%)
Data Table on Italy - Year-over-year growth 2025-2030 (%)

12.5.5 Spain - Market size and forecast 2025-2030

Chart on Spain - Market size and forecast 2025-2030 ($ million)
Data Table on Spain - Market size and forecast 2025-2030 ($ million)
Chart on Spain - Year-over-year growth 2025-2030 (%)
Data Table on Spain - Year-over-year growth 2025-2030 (%)

12.5.6 The Netherlands - Market size and forecast 2025-2030

Chart on The Netherlands - Market size and forecast 2025-2030 ($ million)
Data Table on The Netherlands - Market size and forecast 2025-2030 ($ million)
Chart on The Netherlands - Year-over-year growth 2025-2030 (%)
Data Table on The Netherlands - Year-over-year growth 2025-2030 (%)

12.6 Middle East and Africa - Market size and forecast 2025-2030

Chart on Middle East and Africa - Market size and forecast 2025-2030 ($ million)
Data Table on Middle East and Africa - Market size and forecast 2025-2030 ($ million)
Chart on Middle East and Africa - Year-over-year growth 2025-2030 (%)
Data Table on Middle East and Africa - Year-over-year growth 2025-2030 (%)
Chart on Regional Comparison - Middle East and Africa
Data Table on Regional Comparison - Middle East and Africa

12.6.1 Saudi Arabia - Market size and forecast 2025-2030

Chart on Saudi Arabia - Market size and forecast 2025-2030 ($ million)
Data Table on Saudi Arabia - Market size and forecast 2025-2030 ($ million)
Chart on Saudi Arabia - Year-over-year growth 2025-2030 (%)
Data Table on Saudi Arabia - Year-over-year growth 2025-2030 (%)

12.6.2 UAE - Market size and forecast 2025-2030

Chart on UAE - Market size and forecast 2025-2030 ($ million)
Data Table on UAE - Market size and forecast 2025-2030 ($ million)
Chart on UAE - Year-over-year growth 2025-2030 (%)
Data Table on UAE - Year-over-year growth 2025-2030 (%)

12.6.3 South Africa - Market size and forecast 2025-2030

Chart on South Africa - Market size and forecast 2025-2030 ($ million)
Data Table on South Africa - Market size and forecast 2025-2030 ($ million)
Chart on South Africa - Year-over-year growth 2025-2030 (%)
Data Table on South Africa - Year-over-year growth 2025-2030 (%)

12.6.4 Turkey - Market size and forecast 2025-2030

Chart on Turkey - Market size and forecast 2025-2030 ($ million)
Data Table on Turkey - Market size and forecast 2025-2030 ($ million)
Chart on Turkey - Year-over-year growth 2025-2030 (%)
Data Table on Turkey - Year-over-year growth 2025-2030 (%)

12.6.5 Israel - Market size and forecast 2025-2030

Chart on Israel - Market size and forecast 2025-2030 ($ million)
Data Table on Israel - Market size and forecast 2025-2030 ($ million)
Chart on Israel - Year-over-year growth 2025-2030 (%)
Data Table on Israel - Year-over-year growth 2025-2030 (%)

12.7 South America - Market size and forecast 2025-2030

Chart on South America - Market size and forecast 2025-2030 ($ million)
Data Table on South America - Market size and forecast 2025-2030 ($ million)
Chart on South America - Year-over-year growth 2025-2030 (%)
Data Table on South America - Year-over-year growth 2025-2030 (%)
Chart on Regional Comparison - South America
Data Table on Regional Comparison - South America

12.7.1 Brazil - Market size and forecast 2025-2030

Chart on Brazil - Market size and forecast 2025-2030 ($ million)
Data Table on Brazil - Market size and forecast 2025-2030 ($ million)
Chart on Brazil - Year-over-year growth 2025-2030 (%)
Data Table on Brazil - Year-over-year growth 2025-2030 (%)

12.7.2 Argentina - Market size and forecast 2025-2030

Chart on Argentina - Market size and forecast 2025-2030 ($ million)
Data Table on Argentina - Market size and forecast 2025-2030 ($ million)
Chart on Argentina - Year-over-year growth 2025-2030 (%)
Data Table on Argentina - Year-over-year growth 2025-2030 (%)

12.7.3 Colombia - Market size and forecast 2025-2030

Chart on Colombia - Market size and forecast 2025-2030 ($ million)
Data Table on Colombia - Market size and forecast 2025-2030 ($ million)
Chart on Colombia - Year-over-year growth 2025-2030 (%)
Data Table on Colombia - Year-over-year growth 2025-2030 (%)

12.8 Market opportunity by geography

Market opportunity by geography ($ million)
Data Tables on Market opportunity by geography ($ million)

13. Drivers, Challenges, and Opportunity

13.1 Market drivers

Surging demand for energy-efficient and environmentally conscious cooling technologies
Proliferation of compact electronics and trend of miniaturization
Expanding applications in automotive and healthcare sectors

13.2 Market challenges

Limited cooling capacity and cost pressures
Global regulatory imperatives and pursuit of sustainable cooling solutions
Specialized high-tech applications demanding precision and reliability

13.3 Impact of drivers and challenges

Impact of drivers and challenges in 2025 and 2030

13.4 Market opportunities

Miniaturization and integration in advanced electronics
Growing adoption in electric vehicles and automotive sector
Advancements in thermoelectric materials and manufacturing processes

14. Competitive Landscape

14.1 Overview

14.2

Overview on criticality of inputs and factors of differentiation

14.3 Landscape disruption

Overview on factors of disruption

14.4 Industry risks

Impact of key risks on business

15. Competitive Analysis

15.1 Companies profiled

Companies covered

15.2 Company ranking index

15.3 Market positioning of companies

Matrix on companies position and classification

15.4 AMS Technologies AG

AMS Technologies AG - Overview
AMS Technologies AG - Product / Service
AMS Technologies AG - Key offerings
SWOT

15.5 Crystal Ltd.

Crystal Ltd. - Overview
Crystal Ltd. - Product / Service
Crystal Ltd. - Key offerings
SWOT

15.6 CustomChill Inc.

CustomChill Inc. - Overview
CustomChill Inc. - Product / Service
CustomChill Inc. - Key offerings
SWOT

15.7 EVERREDtronics

EVERREDtronics - Overview
EVERREDtronics - Product / Service
EVERREDtronics - Key offerings
SWOT

15.8 Ferrotec Holdings Corp.

Ferrotec Holdings Corp. - Overview
Ferrotec Holdings Corp. - Business segments
Ferrotec Holdings Corp. - Key offerings
Ferrotec Holdings Corp. - Segment focus
SWOT

15.9 Kryotherm

Kryotherm - Overview
Kryotherm - Product / Service
Kryotherm - Key offerings
SWOT

15.10 Phononic

Phononic - Overview
Phononic - Product / Service
Phononic - Key offerings
SWOT

15.11 RMT Ltd.

RMT Ltd. - Overview
RMT Ltd. - Product / Service
RMT Ltd. - Key offerings
SWOT

15.12 Sheetak Inc.

Sheetak Inc. - Overview
Sheetak Inc. - Product / Service
Sheetak Inc. - Key offerings
SWOT

15.13 Tark Thermal Solutions GmbH

Tark Thermal Solutions GmbH - Overview
Tark Thermal Solutions GmbH - Product / Service
Tark Thermal Solutions GmbH - Key offerings
SWOT

15.14 TE Technology Inc.

TE Technology Inc. - Overview
TE Technology Inc. - Product / Service
TE Technology Inc. - Key offerings
SWOT

15.15 TEC Microsystems GmbH

TEC Microsystems GmbH - Overview
TEC Microsystems GmbH - Product / Service
TEC Microsystems GmbH - Key offerings
SWOT

15.16 Tellurex Corp.

Tellurex Corp. - Overview
Tellurex Corp. - Product / Service
Tellurex Corp. - Key offerings
SWOT

15.17 Wellen Technology Co. Ltd.

Wellen Technology Co. Ltd. - Overview
Wellen Technology Co. Ltd. - Product / Service
Wellen Technology Co. Ltd. - Key offerings
SWOT

15.18 XIDAS Inc.

XIDAS Inc. - Overview
XIDAS Inc. - Product / Service
XIDAS Inc. - Key offerings
SWOT

16. Appendix

16.1 Scope of the report

Market definition
Objectives
Notes and caveats

16.2 Inclusions and exclusions checklist

Inclusions checklist
Exclusions checklist

16.3 Currency conversion rates for US$

16.4 Research methodology

16.5 Data procurement

Information sources

16.6 Data validation

16.7 Validation techniques employed for market sizing

16.8 Data synthesis

16.9 360 degree market analysis

16.10 List of abbreviations

Research Methodology

Technavio presents a detailed picture of the market by way of study, synthesis, and summation of data from multiple sources. The analysts have presented the various facets of the market with a particular focus on identifying the key industry influencers. The data thus presented is comprehensive, reliable, and the result of extensive research, both primary and secondary.

INFORMATION SOURCES

Primary sources

  • Manufacturers and suppliers
  • Channel partners
  • Industry experts
  • Strategic decision makers

Secondary sources

  • Industry journals and periodicals
  • Government data
  • Financial reports of key industry players
  • Historical data
  • Press releases

DATA ANALYSIS

Data Synthesis

  • Collation of data
  • Estimation of key figures
  • Analysis of derived insights

Data Validation

  • Triangulation with data models
  • Reference against proprietary databases
  • Corroboration with industry experts

REPORT WRITING

Qualitative

  • Market drivers
  • Market challenges
  • Market trends
  • Five forces analysis

Quantitative

  • Market size and forecast
  • Market segmentation
  • Geographical insights
  • Competitive landscape

Interested in this report?

Get your sample now to see our research methodology and insights!

Download Now

Frequently Asked Questions

Solid-state Cooling market growth will increase by USD 399.6 million during 2026-2030.

The Solid-state Cooling market is expected to grow at a CAGR of 8.1% during 2026-2030.

Solid-state Cooling market is segmented by Type (Single stage, Multi stage) End-user (Automotive, Semiconductor and electronics, Healthcare, Consumer) Technology (Electrocaloric cooling, Magnetocaloric cooling)

AMS Technologies AG, Crystal Ltd., CustomChill Inc., EVERREDtronics, Ferrotec Holdings Corp., Kryotherm, Phononic, RMT Ltd., Sheetak Inc., Tark Thermal Solutions GmbH, TE Technology Inc., TEC Microsystems GmbH, Tellurex Corp., Wellen Technology Co. Ltd., XIDAS Inc. are a few of the key vendors in the Solid-state Cooling market.

APAC will register the highest growth rate of 43.7% among the other regions. Therefore, the Solid-state Cooling market in APAC is expected to garner significant business opportunities for the vendors during the forecast period.

China, Japan, India, South Korea, Australia, Indonesia, US, Canada, Mexico, Germany, UK, France, Italy, Spain, The Netherlands, Saudi Arabia, UAE, South Africa, Turkey, Israel, Brazil, Argentina, Colombia

  • Surging demand for energy-efficient and environmentally conscious cooling technologies is the driving factor this market.

The Solid-state Cooling market vendors should focus on grabbing business opportunities from the Type segment as it accounted for the largest market share in the base year.