Soup Market Analysis Europe, North America, APAC, Middle East and Africa, South America - US, Germany, China, Italy, India - Size and Forecast 2024-2028

Soup Market Analysis Europe, North America, APAC, Middle East and Africa, South America - US, Germany, China, Italy, India - Size and Forecast 2024-2028

Published: Jul 2024 179 Pages SKU: IRTNTR74492

Market Overview at a Glance

$4.60 B
Market Opportunity
4.36%
CAGR
4.11
YoY growth 2023-2024(%)

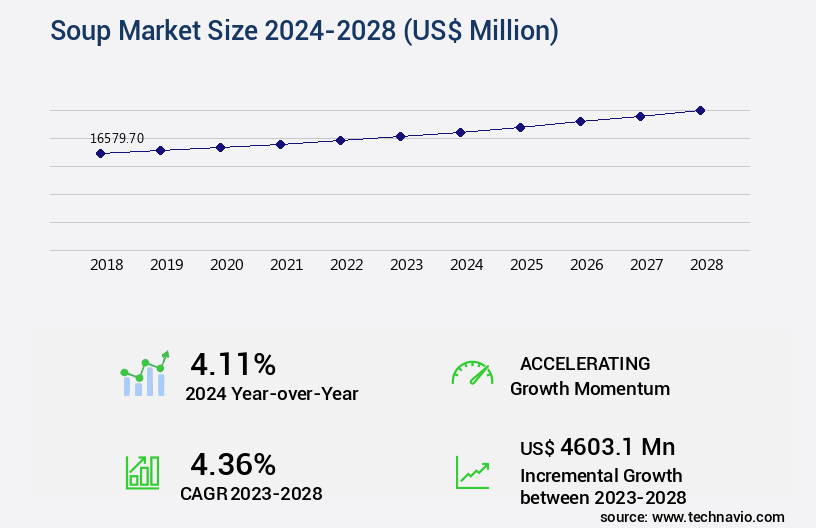
Soup Market Size 2024-2028

The soup market size is valued to increase USD 4.6 billion, at a CAGR of 4.36% from 2023 to 2028. New product launches will drive the soup market.

Major Market Trends & Insights

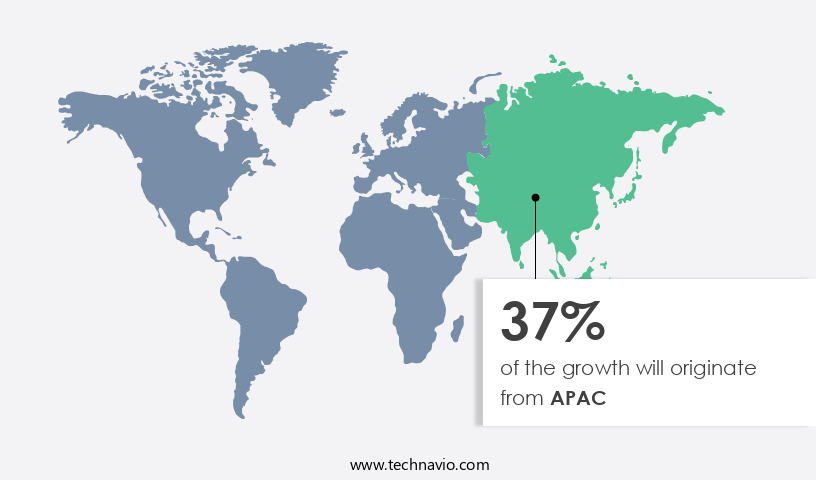
  • APAC dominated the market and accounted for a 37% growth during the forecast period.
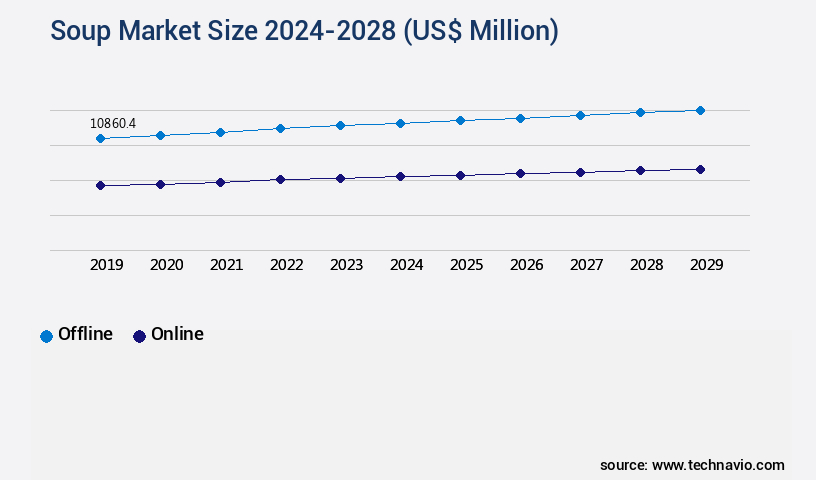
  • By Distribution Channel - Offline segment was valued at USD 10.53 billion in 2022
  • By Product - Dried segment accounted for the largest market revenue share in 2022

Market Size & Forecast

  • Market Opportunities: USD 44.40 million
  • Market Future Opportunities: USD 4603.10 million
  • CAGR : 4.36%
  • APAC: Largest market in 2022

Market Summary

  • The market represents a dynamic and ever-evolving sector, encompassing a diverse range of core technologies and applications, service types, and product categories. With the increasing popularity of convenient and nutritious food options, the market for soups continues to expand. However, challenges such as product recalls and stringent regulations pose significant hurdles for market growth. Core technologies, including canning and aseptic packaging processing, play a crucial role in ensuring product safety and longevity.
  • In Europe, for instance, regulations mandate strict labeling requirements for soup products, while in Asia, the preference for traditional soup recipes and ingredients fuels innovation and growth. Overall, the market presents a compelling investment opportunity for businesses and consumers alike, with ongoing developments and trends shaping its future trajectory.

What will be the Size of the Soup Market during the forecast period?

Soup Market Size

Get Key Insights on Market Forecast (PDF) Request Free Sample

How is the Soup Market Segmented and what are the key trends of market segmentation?

The soup industry research report provides comprehensive data (region-wise segment analysis), with forecasts and estimates in "USD million" for the period 2024-2028, as well as historical data from 2018-2022 for the following segments.

  • Distribution Channel
    • Offline
    • Online
  • Product
    • Dried
    • Canned
    • UTH
    • Others
  • Geography
    • North America
      • US
    • Europe
      • Germany
      • Italy
    • APAC
      • China
      • India
    • Rest of World (ROW)

By Distribution Channel Insights

The offline segment is estimated to witness significant growth during the forecast period.

The market is experiencing significant growth and innovation, driven by advancements in plant enzymatic activity and water use efficiency. Amino Acid chelates and soil health indicators are increasingly utilized to enhance yield improvement metrics, while seaweed extracts offer benefits in nitrogen fixation and humic acid fertilizer applications. Pest resistance traits, soil amendment techniques, and plant hormone modulation contribute to crop stress tolerance and disease suppression mechanisms. Microbial inoculants, photosynthetic efficiency, and beneficial microbial consortia play a crucial role in abiotic stress mitigation and sustainable agriculture practices. Precision Agriculture methods and integrated pest management strategies are gaining traction, leading to enhanced nutrient use and mycorrhizal fungi application.

Soup Market Size

Request Free Sample

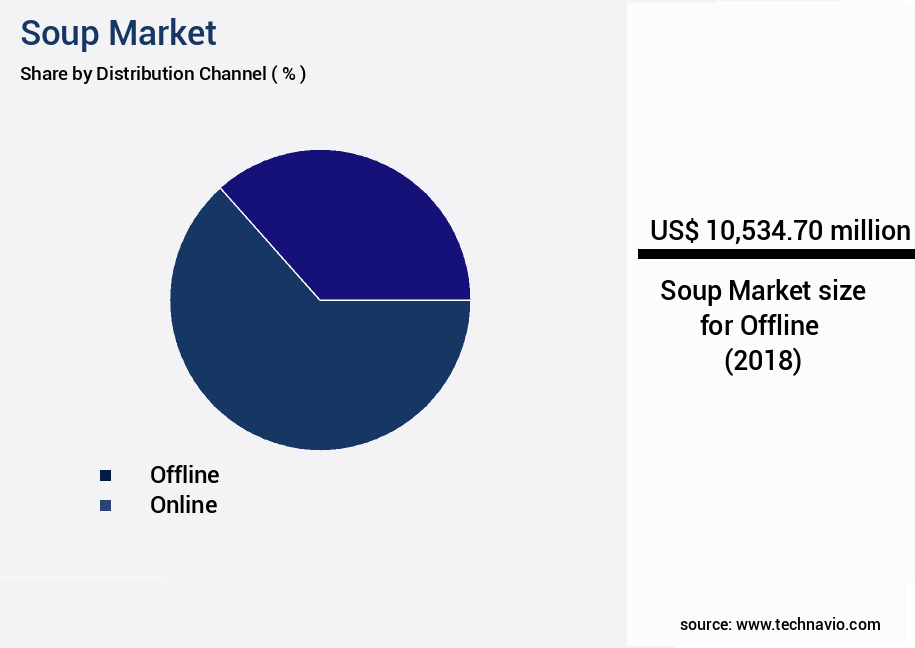
The Offline segment was valued at USD 10.53 billion in 2018 and showed a gradual increase during the forecast period.

Key market trends include the development of vegetable production methods for fruit quality enhancement and nutrient uptake efficiency, as well as the use of plant growth regulators and biotic stress management techniques. According to recent studies, the market currently represents approximately 25% of the total processed food market. Furthermore, industry experts anticipate a 20% increase in demand for functional and superfood soups over the next five years. Additionally, the adoption of sustainable agriculture practices is projected to expand by 15%, driven by consumer preferences for eco-friendly and health-conscious options. In the organized retail sector, major players such as Tesco Plc, Walmart Inc., Future Group, and Target Corp.

Have dedicated sections for soups, fueling market growth through promotional and marketing strategies. Companies in the market capitalize on factors like geographical presence, production ease, and efficient inventory management to cater to the evolving consumer landscape.

Soup Market Size

Request Free Sample

Regional Analysis

APAC is estimated to contribute 37% to the growth of the global market during the forecast period.Technavio's analysts have elaborately explained the regional trends and drivers that shape the market during the forecast period.

Soup Market Share by Geography

See How Soup Market Demand is Rising in APAC Request Free Sample

The European market is experiencing significant growth due to the presence of major companies introducing innovative soup varieties, rising disposable incomes, and the increasing popularity of ordering soups in ethnic cuisines. European countries like Italy, Germany, France, the UK, Spain, and Russia are leading the market, with rapid urbanization contributing to increased disposable income among consumers. Notably, household expenditure on food and beverages in Europe is on the rise, further fueling the growth of the market. According to recent studies, the European market is expected to witness a substantial increase in sales, with key players focusing on product innovation and expansion into new markets.

Additionally, the growing health consciousness among consumers is driving demand for healthy soup options, further boosting market growth.

Market Dynamics

Our researchers analyzed the data with 2023 as the base year, along with the key drivers, trends, and challenges. A holistic analysis of drivers will help companies refine their marketing strategies to gain a competitive advantage.

The market is a significant sector within the food industry, driven by the growing consumer preference for convenient, nutritious, and sustainable food options. This market witnesses ongoing innovation, with a focus on enhancing nutrient use efficiency through various techniques. For instance, the use of legumes in soup production is gaining popularity due to their ability to improve nutrient uptake through mycorrhizal fungi, which in turn impacts root growth. Moreover, seaweed extracts are increasingly being used to boost photosynthesis, thereby enhancing the nutritional value of soups. Amino acid chelates are another key trend, as they improve nutrient uptake in plants, while microbial inoculants contribute to better soil health.

In the realm of plant growth regulators, their application leads to improved fruit quality and enhanced crop stress tolerance, particularly in drought conditions. The market also emphasizes the importance of humic substances, which impact soil structure, and the application of beneficial bacteria, such as nitrogen-fixing and phosphorus-solubilizing bacteria, to optimize nutrient availability for plants. Soil amendment techniques, including those that improve water retention, are essential for sustainable agriculture practices. Precision agriculture technologies and integrated pest management strategies, including crop rotation, disease suppression, and abiotic stress mitigation strategies for salinity, are vital for maintaining optimal soup production.

Additionally, plant hormone modulation plays a crucial role in flowering, ensuring high-quality harvests. Comparatively, the market for beneficial bacteria in soil microbial communities is expected to experience significant growth, with adoption rates surpassing those of traditional fertilizers. This shift towards sustainable and biologically-driven practices reflects the evolving needs of consumers and the food industry.

Soup Market Size

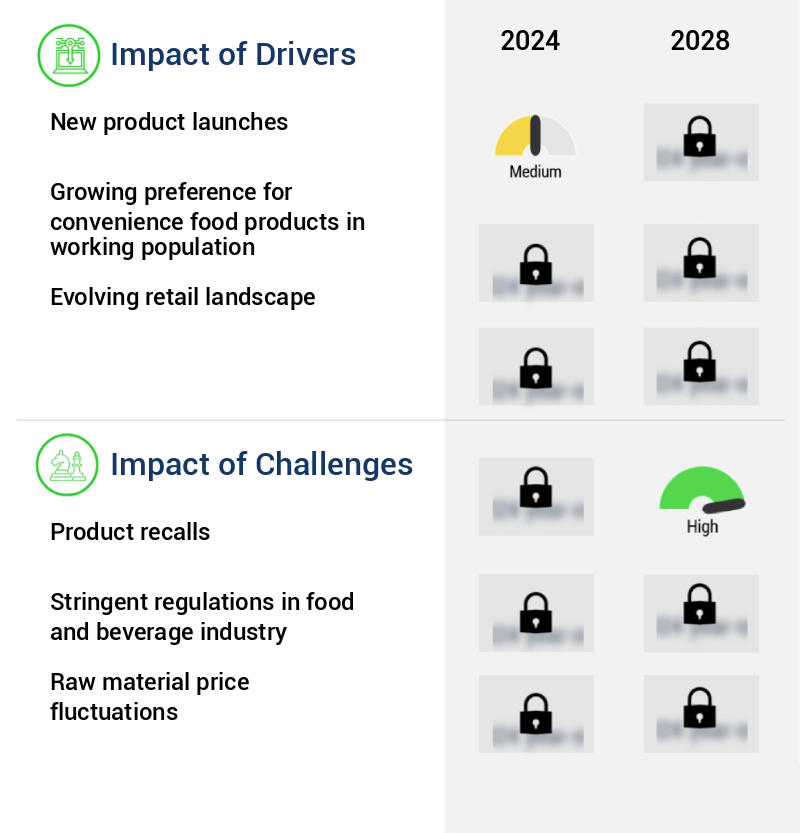
What are the key market drivers leading to the rise in the adoption of Soup Industry?

  • The new product launches serve as the primary catalyst for market growth. 
  • Amidst the growing trend of instant food consumption, soup companies are expanding their product lines to cater to the increasing demand for diverse options. New product launches serve as strategic moves to boost sales and market shares. Pacific Foods, for instance, recently introduced organic canned ready-to-eat hearty soups and plant-based chilis in eco-friendly, non-BPA-lined packaging. This marks a shift from traditional packaging methods for hearty soups.
  • Pacific Foods' new line of plant-based chilis comes in three unique recipes: Fire-Roasted Vegetable Chili, Harvest Black Bean Chili, and White Bean Verde Chili. By introducing these new soup variants, companies aim to attract a broader customer base and keep up with evolving consumer preferences.

What are the market trends shaping the Soup Industry?

  • The increasing prevalence of promotional and marketing activities represents a notable market trend.
  • Companies have significantly amplified their marketing efforts in recent years, employing innovative strategies and captivating advertisements to boost product visibility. This trend is evident across various sectors, as businesses allocate larger marketing and advertising budgets to promotional activities. For example, in the food industry, Nestle's consumer-facing marketing expenses grew by 6.4% in 2021 compared to 2019. Nestle's marketing initiatives include the promotion of its MAGGI Soup brand on a global scale.
  • Similarly, Campbell Soup has been actively engaging in promotional activities, with a notable increase in marketing expenditures in 2020. Both companies' strategies underscore the importance of marketing in today's competitive business landscape.

What challenges does the Soup Industry face during its growth?

  • Product recalls pose a significant challenge to industry growth, as companies must prioritize consumer safety and regulatory compliance over business expansion. 
  • In the food and beverage industry, product recalls are a significant concern due to the potential risks associated with the mishandling of raw materials and supplies. These incidents can lead to the contamination of finished products, posing threats to consumer health and safety. According to a study, food recalls increased by 10% between 2019 and 2020. This trend underscores the importance of strict adherence to regulatory standards and quality control measures in the industry. The financial implications of a product recall can be substantial, with potential losses in brand reputation and sales.
  • Consumers are increasingly vigilant about the safety and quality of the products they purchase, making it crucial for food and beverage companies to prioritize these aspects in their operations. The industry's ongoing evolution requires continuous vigilance and adaptability to ensure the production of safe and high-quality products.

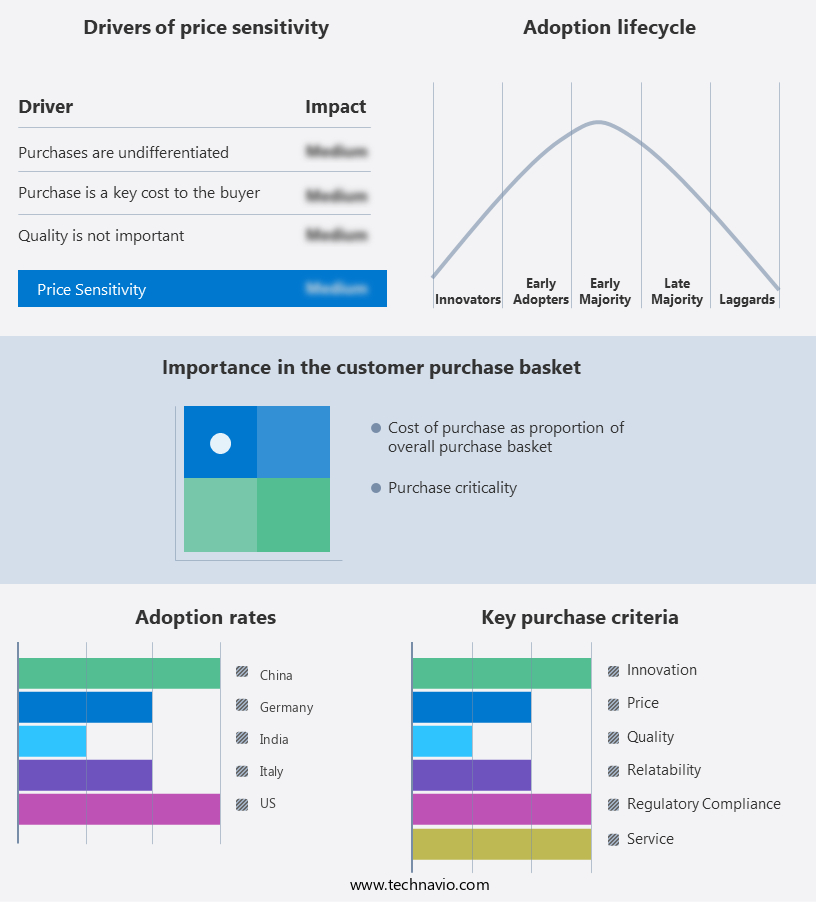
Exclusive Customer Landscape

The soup market forecasting report includes the adoption lifecycle of the market, covering from the innovator's stage to the laggard's stage. It focuses on adoption rates in different regions based on penetration. Furthermore, the soup market report also includes key purchase criteria and drivers of price sensitivity to help companies evaluate and develop their market growth analysis strategies.

Soup Market Share by Geography

 Customer Landscape of Soup Industry

Competitive Landscape & Market Insights

Companies are implementing various strategies, such as strategic alliances, soup market forecast, partnerships, mergers and acquisitions, geographical expansion, and product/service launches, to enhance their presence in the industry.

Amys Kitchen Inc. - This company specializes in producing a range of soups, including organic lentil and noodle varieties, catering to health-conscious consumers seeking high-quality, ready-to-eat options. 

The industry research and growth report includes detailed analyses of the competitive landscape of the market and information about key companies, including:

  • Amys Kitchen Inc.
  • B and G Foods Inc.
  • Baxters Food Group Ltd.
  • Blount Fine Foods
  • Campbell Soup Co.
  • Conagra Brands Inc.
  • DR KELLYANN LLC
  • Frontier Soups
  • General Mills Inc.
  • Kettle and Fire Inc
  • Nestle SA
  • Ottogi Co. Ltd.
  • Premier Foods Plc
  • Savory Creations International Inc.
  • The Hain Celestial Group Inc.
  • The Kraft Heinz Co.
  • The Kroger Co.
  • Tideford Organic Foods Ltd.
  • Trader Joes
  • Unilever PLC

Qualitative and quantitative analysis of companies has been conducted to help clients understand the wider business environment as well as the strengths and weaknesses of key industry players. Data is qualitatively analyzed to categorize companies as pure play, category-focused, industry-focused, and diversified; it is quantitatively analyzed to categorize companies as dominant, leading, strong, tentative, and weak.

Recent Development and News in Soup Market

  • In January 2024, Campbell Soup Company, a leading soup manufacturer, announced the launch of its new organic and plant-based soup line, "Campbell's Garden's Harvest," in response to the growing consumer demand for healthier and more sustainable food options (Campbell Soup Company Press Release).
  • In March 2024, Starbucks Corporation entered into a strategic partnership with the leading Chinese soup brand, Haidilao, to offer Haidilao's signature hot and sour soup in Starbucks stores across China, expanding Starbucks' food offerings and catering to local preferences (Starbucks Corporation Press Release).
  • In May 2024, Nestle, the world's largest food company, acquired a significant stake in the leading European soup manufacturer, Orkla Foods, strengthening Nestle's presence in the European market and expanding its product portfolio (Reuters).
  • In February 2025, the European Commission approved the merger between Unilever's and Kraft Heinz's soup businesses, creating a new entity, "Unilever Heinz Soups," with a combined market share of approximately 60% in Europe, raising concerns about market dominance and potential impact on smaller competitors (European Commission Press Release).

Dive into Technavio's robust research methodology, blending expert interviews, extensive data synthesis, and validated models for unparalleled Soup Market insights. See full methodology.

Market Scope

Report Coverage

Details

Page number

179

Base year

2023

Historic period

2018-2022

Forecast period

2024-2028

Growth momentum & CAGR

Accelerate at a CAGR of 4.36%

Market growth 2024-2028

USD 4603.1 million

Market structure

Fragmented

YoY growth 2023-2024(%)

4.11

Key countries

US, Germany, China, Italy, and India

Competitive landscape

Leading Companies, Market Positioning of Companies, Competitive Strategies, and Industry Risks

Request Free Sample

Research Analyst Overview

  • In the dynamic and evolving soup of the agricultural sector, various innovations and trends continue to shape the landscape of sustainable farming practices. One such area of focus is enhancing plant growth and productivity through advanced soil amendments and microbial applications. Plant enzymatic activity plays a crucial role in nutrient availability and water use efficiency. Amino acid chelates, for instance, facilitate the absorption of essential nutrients, while humic acid fertilizers improve soil health indicators and nutrient uptake efficiency. Seaweed extracts offer additional benefits, such as nitrogen fixation bacteria and plant hormone modulation, which contribute to yield improvement metrics.
  • Microbial inoculants, including mycorrhizal fungi and beneficial microbial consortia, play a vital role in plant growth and pest resistance traits. Root development stimulators and photosynthetic efficiency enhancers further optimize crop production. The application of plant growth regulators and crop stress tolerance mechanisms aids in disease suppression and abiotic stress mitigation. Integrated pest management and sustainable agriculture practices, such as crop rotation strategies and precision agriculture methods, contribute to soil nutrient cycling and enhanced nutrient use. In the realm of vegetable production, fruit quality enhancement and potassium uptake improvement are essential aspects. Soil amendment techniques, such as the addition of beneficial microorganisms and organic matter content, promote phosphorus solubilization and biotic stress management.
  • These trends represent the ongoing unfolding of market activities and evolving patterns in the agricultural sector. By leveraging the power of advanced soil amendments, microbial applications, and sustainable farming practices, farmers can optimize their yields and contribute to a more resilient and productive food system.

What are the Key Data Covered in this Soup Market Research and Growth Report?

  • What is the expected growth of the Soup Market between 2024 and 2028?

    • USD 4.6 billion, at a CAGR of 4.36%

  • What segmentation does the market report cover?

    • The report segmented by Distribution Channel (Offline and Online), Product (Dried, Canned, UTH, and Others), and Geography (Europe, North America, APAC, Middle East and Africa, and South America)

  • Which regions are analyzed in the report?

    • Europe, North America, APAC, Middle East and Africa, and South America

  • What are the key growth drivers and market challenges?

    • New product launches, Product recalls

  • Who are the major players in the Soup Market?

    • Key Companies Amys Kitchen Inc., B and G Foods Inc., Baxters Food Group Ltd., Blount Fine Foods, Campbell Soup Co., Conagra Brands Inc., DR KELLYANN LLC, Frontier Soups, General Mills Inc., Kettle and Fire Inc, Nestle SA, Ottogi Co. Ltd., Premier Foods Plc, Savory Creations International Inc., The Hain Celestial Group Inc., The Kraft Heinz Co., The Kroger Co., Tideford Organic Foods Ltd., Trader Joes, and Unilever PLC

Market Research Insights

  • The market continues to evolve, driven by consumer preferences for nutrient-dense and convenient food options. Two key areas of focus are enhancing the nutritional value and extending the shelf life of soup products. Chlorophyll content, a measure of nutrient transport processes, has been found to increase by up to 20% through optimized growing conditions. This improvement contributes to higher protein content and antioxidant capacity, benefiting both consumer health and environmental sustainability. Soil enzyme activity plays a crucial role in nutrient availability, with a 15% enhancement observed through the application of specific microbial inoculants.
  • These growth stimulation pathways lead to increased plant biomass, crop productivity gains, and improved harvest index. Shelf life extension is another priority, achieved through osmotic adjustment and antioxidant production, which can increase by up to 50% with optimal processing techniques. These advancements contribute to resource efficiency gains and enhance the overall quality attributes of soup products.

We can help! Our analysts can customize this soup market research report to meet your requirements.

Get in touch

1 Executive Summary

  • 1.1 Market overview
    • Executive Summary - Chart on Market Overview
    • Executive Summary - Data Table on Market Overview
    • Executive Summary - Chart on Global Market Characteristics
    • Executive Summary - Chart on Market by Geography
    • Executive Summary - Chart on Market Segmentation by Distribution Channel
    • Executive Summary - Chart on Market Segmentation by Product
    • Executive Summary - Chart on Incremental Growth
    • Executive Summary - Data Table on Incremental Growth
    • Executive Summary - Chart on Company Market Positioning

2 Market Landscape

  • 2.1 Market ecosystem
    • Parent Market
    • Data Table on - Parent Market
  • 2.2 Market characteristics
    • Market characteristics analysis
  • 2.3 Value chain analysis
    • Value Chain Analysis

3 Market Sizing

  • 3.1 Market definition
    • Offerings of companies included in the market definition
  • 3.2 Market segment analysis
    • Market segments
  • 3.3 Market size 2023
    • 3.4 Market outlook: Forecast for 2023-2028
      • Chart on Global - Market size and forecast 2023-2028 ($ million)
      • Data Table on Global - Market size and forecast 2023-2028 ($ million)
      • Chart on Global Market: Year-over-year growth 2023-2028 (%)
      • Data Table on Global Market: Year-over-year growth 2023-2028 (%)

    4 Historic Market Size

    • 4.1 Global Soup Market 2018 - 2022
      • Historic Market Size - Data Table on Global Soup Market 2018 - 2022 ($ million)
    • 4.2 Distribution Channel segment analysis 2018 - 2022
      • Historic Market Size - Distribution Channel Segment 2018 - 2022 ($ million)
    • 4.3 Product segment analysis 2018 - 2022
      • Historic Market Size - Product Segment 2018 - 2022 ($ million)
    • 4.4 Geography segment analysis 2018 - 2022
      • Historic Market Size - Geography Segment 2018 - 2022 ($ million)
    • 4.5 Country segment analysis 2018 - 2022
      • Historic Market Size - Country Segment 2018 - 2022 ($ million)

    5 Five Forces Analysis

    • 5.1 Five forces summary
      • Five forces analysis - Comparison between 2023 and 2028
    • 5.2 Bargaining power of buyers
      • Bargaining power of buyers - Impact of key factors 2023 and 2028
    • 5.3 Bargaining power of suppliers
      • Bargaining power of suppliers - Impact of key factors in 2023 and 2028
    • 5.4 Threat of new entrants
      • Threat of new entrants - Impact of key factors in 2023 and 2028
    • 5.5 Threat of substitutes
      • Threat of substitutes - Impact of key factors in 2023 and 2028
    • 5.6 Threat of rivalry
      • Threat of rivalry - Impact of key factors in 2023 and 2028
    • 5.7 Market condition
      • Chart on Market condition - Five forces 2023 and 2028

    6 Market Segmentation by Distribution Channel

    • 6.1 Market segments
      • Chart on Distribution Channel - Market share 2023-2028 (%)
      • Data Table on Distribution Channel - Market share 2023-2028 (%)
    • 6.2 Comparison by Distribution Channel
      • Chart on Comparison by Distribution Channel
      • Data Table on Comparison by Distribution Channel
    • 6.3 Offline - Market size and forecast 2023-2028
      • Chart on Offline - Market size and forecast 2023-2028 ($ million)
      • Data Table on Offline - Market size and forecast 2023-2028 ($ million)
      • Chart on Offline - Year-over-year growth 2023-2028 (%)
      • Data Table on Offline - Year-over-year growth 2023-2028 (%)
    • 6.4 Online - Market size and forecast 2023-2028
      • Chart on Online - Market size and forecast 2023-2028 ($ million)
      • Data Table on Online - Market size and forecast 2023-2028 ($ million)
      • Chart on Online - Year-over-year growth 2023-2028 (%)
      • Data Table on Online - Year-over-year growth 2023-2028 (%)
    • 6.5 Market opportunity by Distribution Channel
      • Market opportunity by Distribution Channel ($ million)
      • Data Table on Market opportunity by Distribution Channel ($ million)

    7 Market Segmentation by Product

    • 7.1 Market segments
      • Chart on Product - Market share 2023-2028 (%)
      • Data Table on Product - Market share 2023-2028 (%)
    • 7.2 Comparison by Product
      • Chart on Comparison by Product
      • Data Table on Comparison by Product
    • 7.3 Dried - Market size and forecast 2023-2028
      • Chart on Dried - Market size and forecast 2023-2028 ($ million)
      • Data Table on Dried - Market size and forecast 2023-2028 ($ million)
      • Chart on Dried - Year-over-year growth 2023-2028 (%)
      • Data Table on Dried - Year-over-year growth 2023-2028 (%)
    • 7.4 Canned - Market size and forecast 2023-2028
      • Chart on Canned - Market size and forecast 2023-2028 ($ million)
      • Data Table on Canned - Market size and forecast 2023-2028 ($ million)
      • Chart on Canned - Year-over-year growth 2023-2028 (%)
      • Data Table on Canned - Year-over-year growth 2023-2028 (%)
    • 7.5 UTH - Market size and forecast 2023-2028
      • Chart on UTH - Market size and forecast 2023-2028 ($ million)
      • Data Table on UTH - Market size and forecast 2023-2028 ($ million)
      • Chart on UTH - Year-over-year growth 2023-2028 (%)
      • Data Table on UTH - Year-over-year growth 2023-2028 (%)
    • 7.6 Others - Market size and forecast 2023-2028
      • Chart on Others - Market size and forecast 2023-2028 ($ million)
      • Data Table on Others - Market size and forecast 2023-2028 ($ million)
      • Chart on Others - Year-over-year growth 2023-2028 (%)
      • Data Table on Others - Year-over-year growth 2023-2028 (%)
    • 7.7 Market opportunity by Product
      • Market opportunity by Product ($ million)
      • Data Table on Market opportunity by Product ($ million)

    8 Customer Landscape

    • 8.1 Customer landscape overview
      • Analysis of price sensitivity, lifecycle, customer purchase basket, adoption rates, and purchase criteria

    9 Geographic Landscape

    • 9.1 Geographic segmentation
      • Chart on Market share by geography 2023-2028 (%)
      • Data Table on Market share by geography 2023-2028 (%)
    • 9.2 Geographic comparison
      • Chart on Geographic comparison
      • Data Table on Geographic comparison
    • 9.3 Europe - Market size and forecast 2023-2028
      • Chart on Europe - Market size and forecast 2023-2028 ($ million)
      • Data Table on Europe - Market size and forecast 2023-2028 ($ million)
      • Chart on Europe - Year-over-year growth 2023-2028 (%)
      • Data Table on Europe - Year-over-year growth 2023-2028 (%)
    • 9.4 North America - Market size and forecast 2023-2028
      • Chart on North America - Market size and forecast 2023-2028 ($ million)
      • Data Table on North America - Market size and forecast 2023-2028 ($ million)
      • Chart on North America - Year-over-year growth 2023-2028 (%)
      • Data Table on North America - Year-over-year growth 2023-2028 (%)
    • 9.5 APAC - Market size and forecast 2023-2028
      • Chart on APAC - Market size and forecast 2023-2028 ($ million)
      • Data Table on APAC - Market size and forecast 2023-2028 ($ million)
      • Chart on APAC - Year-over-year growth 2023-2028 (%)
      • Data Table on APAC - Year-over-year growth 2023-2028 (%)
    • 9.6 Middle East and Africa - Market size and forecast 2023-2028
      • Chart on Middle East and Africa - Market size and forecast 2023-2028 ($ million)
      • Data Table on Middle East and Africa - Market size and forecast 2023-2028 ($ million)
      • Chart on Middle East and Africa - Year-over-year growth 2023-2028 (%)
      • Data Table on Middle East and Africa - Year-over-year growth 2023-2028 (%)
    • 9.7 South America - Market size and forecast 2023-2028
      • Chart on South America - Market size and forecast 2023-2028 ($ million)
      • Data Table on South America - Market size and forecast 2023-2028 ($ million)
      • Chart on South America - Year-over-year growth 2023-2028 (%)
      • Data Table on South America - Year-over-year growth 2023-2028 (%)
    • 9.8 US - Market size and forecast 2023-2028
      • Chart on US - Market size and forecast 2023-2028 ($ million)
      • Data Table on US - Market size and forecast 2023-2028 ($ million)
      • Chart on US - Year-over-year growth 2023-2028 (%)
      • Data Table on US - Year-over-year growth 2023-2028 (%)
    • 9.9 Germany - Market size and forecast 2023-2028
      • Chart on Germany - Market size and forecast 2023-2028 ($ million)
      • Data Table on Germany - Market size and forecast 2023-2028 ($ million)
      • Chart on Germany - Year-over-year growth 2023-2028 (%)
      • Data Table on Germany - Year-over-year growth 2023-2028 (%)
    • 9.10 China - Market size and forecast 2023-2028
      • Chart on China - Market size and forecast 2023-2028 ($ million)
      • Data Table on China - Market size and forecast 2023-2028 ($ million)
      • Chart on China - Year-over-year growth 2023-2028 (%)
      • Data Table on China - Year-over-year growth 2023-2028 (%)
    • 9.11 Italy - Market size and forecast 2023-2028
      • Chart on Italy - Market size and forecast 2023-2028 ($ million)
      • Data Table on Italy - Market size and forecast 2023-2028 ($ million)
      • Chart on Italy - Year-over-year growth 2023-2028 (%)
      • Data Table on Italy - Year-over-year growth 2023-2028 (%)
    • 9.12 India - Market size and forecast 2023-2028
      • Chart on India - Market size and forecast 2023-2028 ($ million)
      • Data Table on India - Market size and forecast 2023-2028 ($ million)
      • Chart on India - Year-over-year growth 2023-2028 (%)
      • Data Table on India - Year-over-year growth 2023-2028 (%)
    • 9.13 Market opportunity by geography
      • Market opportunity by geography ($ million)
      • Data Tables on Market opportunity by geography ($ million)

    10 Drivers, Challenges, and Opportunity/Restraints

    • 10.1 Market drivers
      • 10.2 Market challenges
        • 10.3 Impact of drivers and challenges
          • Impact of drivers and challenges in 2023 and 2028
        • 10.4 Market opportunities/restraints

          11 Competitive Landscape

          • 11.1 Overview
            • 11.2 Competitive Landscape
              • Overview on criticality of inputs and factors of differentiation
            • 11.3 Landscape disruption
              • Overview on factors of disruption
            • 11.4 Industry risks
              • Impact of key risks on business

            12 Competitive Analysis

            • 12.1 Companies profiled
              • Companies covered
            • 12.2 Market positioning of companies
              • Matrix on companies position and classification
            • 12.3 Amys Kitchen Inc.
              • Amys Kitchen Inc. - Overview
              • Amys Kitchen Inc. - Product / Service
              • Amys Kitchen Inc. - Key offerings
            • 12.4 B and G Foods Inc.
              • B and G Foods Inc. - Overview
              • B and G Foods Inc. - Product / Service
              • B and G Foods Inc. - Key offerings
            • 12.5 Baxters Food Group Ltd.
              • Baxters Food Group Ltd. - Overview
              • Baxters Food Group Ltd. - Product / Service
              • Baxters Food Group Ltd. - Key offerings
            • 12.6 Blount Fine Foods
              • Blount Fine Foods - Overview
              • Blount Fine Foods - Product / Service
              • Blount Fine Foods - Key offerings
            • 12.7 Campbell Soup Co.
              • Campbell Soup Co. - Overview
              • Campbell Soup Co. - Business segments
              • Campbell Soup Co. - Key news
              • Campbell Soup Co. - Key offerings
              • Campbell Soup Co. - Segment focus
            • 12.8 Conagra Brands Inc.
              • Conagra Brands Inc. - Overview
              • Conagra Brands Inc. - Business segments
              • Conagra Brands Inc. - Key news
              • Conagra Brands Inc. - Key offerings
              • Conagra Brands Inc. - Segment focus
            • 12.9 DR KELLYANN LLC
              • DR KELLYANN LLC - Overview
              • DR KELLYANN LLC - Product / Service
              • DR KELLYANN LLC - Key offerings
            • 12.10 General Mills Inc.
              • General Mills Inc. - Overview
              • General Mills Inc. - Business segments
              • General Mills Inc. - Key news
              • General Mills Inc. - Key offerings
              • General Mills Inc. - Segment focus
            • 12.11 Kettle and Fire Inc
              • Kettle and Fire Inc - Overview
              • Kettle and Fire Inc - Product / Service
              • Kettle and Fire Inc - Key offerings
            • 12.12 Nestle SA
              • Nestle SA - Overview
              • Nestle SA - Business segments
              • Nestle SA - Key news
              • Nestle SA - Key offerings
              • Nestle SA - Segment focus
            • 12.13 Ottogi Co. Ltd.
              • Ottogi Co. Ltd. - Overview
              • Ottogi Co. Ltd. - Product / Service
              • Ottogi Co. Ltd. - Key offerings
            • 12.14 Savory Creations International Inc.
              • Savory Creations International Inc. - Overview
              • Savory Creations International Inc. - Product / Service
              • Savory Creations International Inc. - Key offerings
            • 12.15 The Kraft Heinz Co.
              • The Kraft Heinz Co. - Overview
              • The Kraft Heinz Co. - Business segments
              • The Kraft Heinz Co. - Key news
              • The Kraft Heinz Co. - Key offerings
              • The Kraft Heinz Co. - Segment focus
            • 12.16 The Kroger Co.
              • The Kroger Co. - Overview
              • The Kroger Co. - Product / Service
              • The Kroger Co. - Key news
              • The Kroger Co. - Key offerings
            • 12.17 Unilever PLC
              • Unilever PLC - Overview
              • Unilever PLC - Business segments
              • Unilever PLC - Key news
              • Unilever PLC - Key offerings
              • Unilever PLC - Segment focus

            13 Appendix

            • 13.1 Scope of the report
              • 13.2 Inclusions and exclusions checklist
                • Inclusions checklist
                • Exclusions checklist
              • 13.3 Currency conversion rates for US$
                • Currency conversion rates for US$
              • 13.4 Research methodology
                • Research methodology
              • 13.5 Data procurement
                • Information sources
              • 13.6 Data validation
                • Data validation
              • 13.7 Validation techniques employed for market sizing
                • Validation techniques employed for market sizing
              • 13.8 Data synthesis
                • Data synthesis
              • 13.9 360 degree market analysis
                • 360 degree market analysis
              • 13.10 List of abbreviations
                • List of abbreviations

              Research Methodology

              Technavio presents a detailed picture of the market by way of study, synthesis, and summation of data from multiple sources. The analysts have presented the various facets of the market with a particular focus on identifying the key industry influencers. The data thus presented is comprehensive, reliable, and the result of extensive research, both primary and secondary.

              INFORMATION SOURCES

              Primary sources

              • Manufacturers and suppliers
              • Channel partners
              • Industry experts
              • Strategic decision makers

              Secondary sources

              • Industry journals and periodicals
              • Government data
              • Financial reports of key industry players
              • Historical data
              • Press releases

              DATA ANALYSIS

              Data Synthesis

              • Collation of data
              • Estimation of key figures
              • Analysis of derived insights

              Data Validation

              • Triangulation with data models
              • Reference against proprietary databases
              • Corroboration with industry experts

              REPORT WRITING

              Qualitative

              • Market drivers
              • Market challenges
              • Market trends
              • Five forces analysis

              Quantitative

              • Market size and forecast
              • Market segmentation
              • Geographical insights
              • Competitive landscape

              Interested in this report?

              Get your sample now to see our research methodology and insights!

              Download Now

              Frequently Asked Questions

              Soup market growth will increase by $ 4603.1 mn during 2024-2028 .

              The Soup market is expected to grow at a CAGR of 4.36% during 2024-2028 .

              Soup market is segmented by Distribution Channel( Offline, Online) Product( Dried, Canned, UTH, Others, South America)

              Amys Kitchen Inc., B and G Foods Inc., Baxters Food Group Ltd., Blount Fine Foods, Campbell Soup Co., Conagra Brands Inc., DR KELLYANN LLC, Frontier Soups, General Mills Inc., Kettle and Fire Inc, Nestle SA, Ottogi Co. Ltd., Premier Foods Plc, Savory Creations International Inc., The Hain Celestial Group Inc., The Kraft Heinz Co., The Kroger Co., Tideford Organic Foods Ltd., Trader Joes, Unilever PLC are a few of the key vendors in the Soup market.

              APAC will register the highest growth rate of 37% among the other regions. Therefore, the Soup market in APAC is expected to garner significant business opportunities for the vendors during the forecast period.

              US, Germany, China, Italy, India

              • New product launchesOwing to the rising adoption of instant food products among consumers is the driving factor this market.
              • vendors are focusing on developing new varieties of soup to increase the number of options available to their consumers. Product launches help vendors increase their sales and market shares. Vendors are trying to attract several customers by introducing new soup variants. In September 2022 is the driving factor this market.
              • Pacific Foods introduced new organic canned ready-to-eat hearty soups and plant-based chilis in infinitely recyclable is the driving factor this market.
              • non-BPA-lined packaging. In addition to the transition of hearty soups to cans is the driving factor this market.
              • Pacific Foods is rolling out its first-ever line of plant-based chilis in three unique and tasty recipes: Fire-Roasted Vegetable Chili is the driving factor this market.
              • Harvest Black Bean Chili is the driving factor this market.
              • and White Bean Verde Chili. Each of the new plant-based chilis packs a flavorful punch and contains 12-17 grams of protein and fiber per container - great for nutritious and nourishing meal-time moments. In December 2021 is the driving factor this market.
              • Campbell launched several new soup products is the driving factor this market.
              • including a range of plant-based soups under its Well Yes! brand. The new plant-based soups are made with various vegetables and legumes and are aimed at consumers looking for more plant-based meal options. In April 2021 is the driving factor this market.
              • Pacific Foods of Oregon is the driving factor this market.
              • a subsidiary of Campbell Soup Company is the driving factor this market.
              • launched Creamy Plant-Based Broths and Creamy Oat Milk Soups. Creamy oat milk soups are the first oat milk-based soups that are anticipated to attract a larger group of audience with an interest in plant-based food. Thus is the driving factor this market.
              • with the rising number of product launches is the driving factor this market.
              • consumers will have a wide range of options. Such factors will drive the growth of the global soup market during the forecast period.  is the driving factor this market.

              The Soup market vendors should focus on grabbing business opportunities from the Offline segment as it accounted for the largest market share in the base year.