
Spain Industrial Energy Efficiency Services Market Size 2025-2029
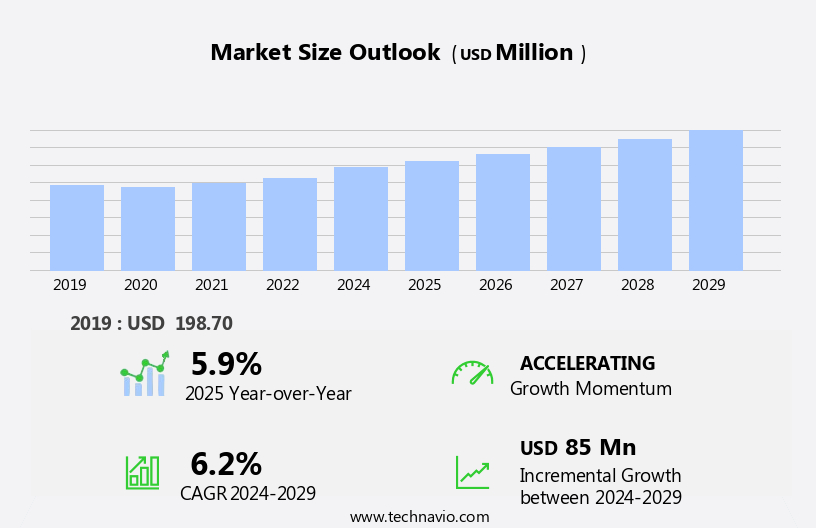
The Spain industrial energy efficiency services market size is forecast to increase by USD 85 million at a CAGR of 6.2% between 2024 and 2029.
- The Industrial Energy Efficiency Services Market is experiencing significant growth due to escalating energy costs, which have become a major concern for industries worldwide. Energy efficiency services have emerged as a strategic priority for businesses seeking to reduce operational expenses and improve sustainability. A key trend driving market expansion is the increasing number of partnerships and collaborations between energy efficiency service providers and industries, leading to innovative solutions and shared risk. However, the long payback period associated with energy efficiency investments remains a significant challenge, necessitating companies' careful planning and financial management. The integration of renewable energy sources and energy storage systems has also been a popular trend in the data center industry.
- To capitalize on this market opportunity, businesses should focus on implementing energy efficiency measures that offer quick returns on investment and explore financing options such as energy performance contracts and energy service performance agreements. Additionally, collaborating with energy efficiency service providers and leveraging advanced technologies like IoT, AI, and machine learning can help industries optimize energy usage and reduce wastage. Overall, the Industrial Energy Efficiency Services Market presents a substantial growth opportunity for companies that can navigate the challenges and deliver effective energy efficiency solutions to industries.
What will be the size of the Spain Industrial Energy Efficiency Services Market during the forecast period?
- In today's business landscape, the importance of energy efficiency continues to gain momentum. Heat recovery, energy efficiency retrofits, and variable frequency drives are among the key strategies companies employ to reduce energy consumption and costs. Energy efficiency awareness programs and training are essential for workforces to understand the importance of this initiative. Energy performance monitoring and analysis enable businesses to identify areas for improvement and make informed investment decisions. Energy benchmarking and life cycle assessments provide valuable insights for green building design and sustainable manufacturing processes. An energy efficiency roadmap and strategy are crucial for organizations to set targets and track progress. Energy efficiency hardware, such as sensors and controllers, is an essential component of IoT systems, providing data for energy data analytics and process optimization.
- Energy efficiency reporting is essential for transparency and accountability. The circular economy concept is gaining traction as a sustainable approach to resource management. Process automation and energy efficiency audits help streamline operations and optimize energy usage. LEED certification and energy efficiency assessments are important benchmarks for demonstrating a company's commitment to sustainability. Circular economy principles, sustainable manufacturing practices, and process automation are driving the evolution of energy efficiency services. Energy efficiency services providers offer a range of solutions, from energy efficiency audits to training and analysis, to help businesses reduce their energy footprint and stay competitive.
How is this market segmented?
The market research report provides comprehensive data (region-wise segment analysis), with forecasts and estimates in "USD million" for the period 2025-2029, as well as historical data from 2019-2023 for the following segments.
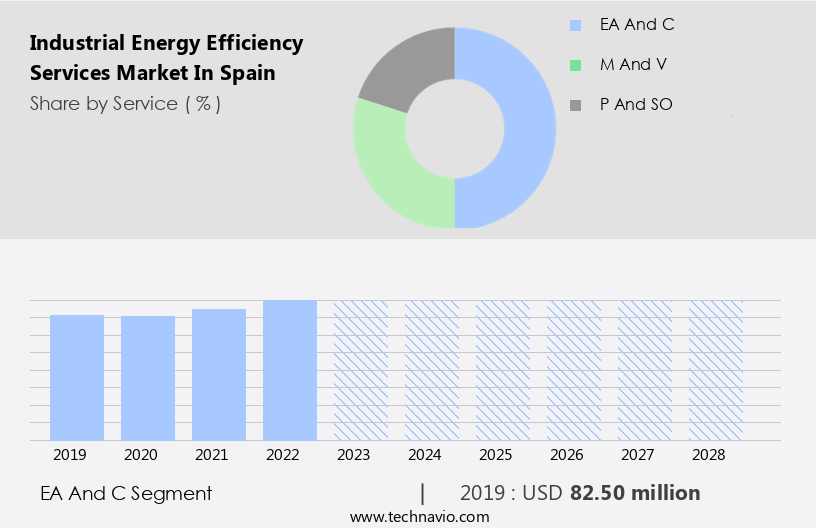
- Service
- EA and C
- M and V
- P and SO
- End-user
- Petrochemicals and chemicals
- Power
- Oil and gas
- Others
- Deployment
- On-premises
- Cloud-based
- Geography
- North America
- Europe
- Spain
- Middle East and Africa
- APAC
- South America
- Rest of World (ROW)
- North America
By Service Insights
The EA and C segments are estimated to witness significant growth during the forecast period. In the realm of industrial energy efficiency services, energy audits and consulting (EA and C) play a pivotal role in the Spanish market. These services enable businesses to identify energy inefficiencies and optimize their energy consumption. Energy audits entail a comprehensive evaluation of a facility's energy usage, assessing consumption patterns, equipment performance, and proposing cost-effective solutions for energy savings. Consulting services extend further, offering customized strategies for implementing energy-saving measures.
These may include the integration of renewable energy systems, energy-efficient equipment, and process improvements to reduce operational costs and align with sustainability objectives. Energy efficiency implementation spans various sectors, such as power generation, renewable energy integration, industrial energy efficiency, and energy management systems. Energy efficiency software and energy performance contracts further facilitate the adoption of energy-saving measures, while demand response programs optimize energy usage in response to grid conditions.
Get a glance at the market share of various segments Request Free Sample
The EA and C segment was valued at USD 82.50 million in 2019 and showed a gradual increase during the forecast period.
Market Dynamics
Our researchers analyzed the data with 2024 as the base year, along with the key drivers, trends, and challenges. A holistic analysis of drivers will help companies refine their marketing strategies to gain a competitive advantage.
What are the key market drivers leading to the rise in adoption of Spain Industrial Energy Efficiency Services Market?
- Rising energy costs are the key driver of the market. The industrial energy efficiency services market in Europe, specifically in Spain, is experiencing significant growth due to increasing energy costs. Over the past decade, fluctuating electricity and gas prices, global supply chain disruptions, and geopolitical tensions have placed a heavy financial burden on energy-intensive industries in Spain. According to the National Institute of Statistics (INE), rates of oil, gas, and electrical power increased by 7.5% in Spain in 2024, following a contraction of 20.6% in 2023. Sectors such as steel, cement, ceramics, and food processing are particularly affected, as they rely heavily on stable and affordable energy supplies for production continuity and profitability.
- The transition to renewable energy sources further complicates matters, as these industries require reliable backup power sources to maintain operations during periods of intermittent renewable energy generation. The financial strain caused by rising energy costs is driving demand for energy efficiency services, as companies seek to reduce their energy consumption and lower their operational expenses.
What are the market trends shaping the Spain Industrial Energy Efficiency Services Market?
- The increasing number of partnerships and collaborations is the upcoming trend in the market. The industrial energy efficiency services market is witnessing an increasing trend of partnerships and collaborations. These alliances enable organizations to combine their strengths and provide comprehensive energy solutions to the industrial sector. On April 13, 2023, Schneider Electric and GreenYellow announced a strategic partnership to launch Energy-as-a-Service (EaaS) microgrid solutions across Europe, with a focus on Spain's industrial energy efficiency needs.
- This collaboration caters to commercial and industrial sectors, including manufacturing plants and logistics centers. The partnership aims to improve energy resilience, reduce costs, and help businesses meet sustainability goals without requiring upfront investment. By joining forces, these companies can deliver advanced energy solutions, ensuring industrial clients benefit from the latest technology and expertise.
What challenges does Spain Industrial Energy Efficiency Services Market face during the growth?
- A long payback period is a key challenge that affects market growth. The market faces a notable challenge due to the lengthy payback period for energy efficiency projects. Financing these initiatives can be intricate, with options including financial institutions or Energy Service Companies (ESCOs) that self-finance projects. When financial institutions are involved, the creditworthiness of end-users serves as collateral for repayment, which deters investors due to perceived financial risks.
- Companies providing industrial energy efficiency services, such as automation hardware manufacturers, utility companies, and non-utility service providers, frequently need substantial equity funds to self-finance these projects. The extended payback period can negatively impact these companies' cash flow, constraining their capacity to fully invest in energy efficiency projects.
How can Technavio assist you in making critical decisions?
Key Companies & Market Insights
Companies are implementing various strategies, such as strategic alliances, market forecast partnerships, mergers and acquisitions, geographical expansion, and product/service launches, to enhance their presence in the market.
The market research and growth report includes detailed analyses of the competitive landscape of the market and information about key companies, including:
- Acciona SA
- Ameresco Inc.
- Articae Smart technologies S.L.
- EDP S.A.
- Electricite de France SA
- ENGIE SA
- Fenie Energia
- GE Vernova Inc.
- Honeywell International Inc.
- Iberdrola SA
- Inergy
- Repsol SA
- Schneider Electric SE
- Siemens Gamesa Renewable Energy SA
- The Predictive Co
- Veolia Environnement SA
Qualitative and quantitative analysis of companies has been conducted to help clients understand the wider business environment as well as the strengths and weaknesses of key market players. Data is qualitatively analyzed to categorize companies as pure play, category-focused, industry-focused, and diversified; it is quantitatively analyzed to categorize companies as dominant, leading, strong, tentative, and weak.
Research Analyst Overview
Industrial energy efficiency services have gained significant attention in recent years as businesses strive to reduce their carbon footprint and operational costs. The integration of renewable energy sources into power generation systems and the implementation of energy management systems have been key drivers in this market. Energy efficiency implementation in industries encompasses various aspects, including lighting retrofits, energy efficiency monitoring, smart grids, and process optimization. The oil and gas sector, a significant consumer of energy, has been actively investing in energy efficiency technologies to improve operational efficiency and reduce greenhouse gas emissions. The Internet of Things (IoT) has revolutionized energy management by enabling real-time monitoring and analysis of energy usage.
Sustainability initiatives and energy efficiency standards have set new benchmarks for industries to meet, driving the demand for energy efficiency consulting and energy audits. Energy efficiency financing and incentives have also played a crucial role in facilitating the adoption of energy efficiency solutions. Heavy industry sectors, such as food and beverage, have been focusing on energy efficiency upgrades, including HVAC optimization, motor efficiency, and steam systems. Building retrofits and energy storage have also gained traction as industries seek to enhance their operational efficiency and reduce energy consumption.
Energy efficiency regulations have been implemented across various industries, driving the need for compliance and the adoption of energy efficiency solutions. Energy efficiency verification services have emerged to help businesses ensure they meet regulatory requirements and optimize their energy usage. Data centers, a significant consumer of energy, have been investing in energy efficiency technologies, such as energy performance contracts and demand response, to reduce their carbon footprint and operational costs. The market for industrial energy efficiency services is expected to continue growing as businesses seek to reduce their energy consumption, optimize their operations, and comply with regulations. The evolving market dynamics, including technological advancements and regulatory requirements, will shape the future of this market.
|
Market Scope |
|
|
Report Coverage |
Details |
|
Page number |
178 |
|
Base year |
2024 |
|
Historic period |
2019-2023 |
|
Forecast period |
2025-2029 |
|
Growth momentum & CAGR |
Accelerate at a CAGR of 6.2% |
|
Market growth 2025-2029 |
USD 85 million |
|
Market structure |
Fragmented |
|
YoY growth 2024-2025(%) |
5.9 |
|
Competitive landscape |
Leading Companies, Market Positioning of Companies, Competitive Strategies, and Industry Risks |
What are the Key Data Covered in this Market Report?
- CAGR of the market during the market forecasting period
- Detailed information on factors that will drive the market growth and forecasting between 2025 and 2029
- Precise estimation of the size of the market and its contribution of the market in focus to the parent market
- Accurate predictions about upcoming market growth and trends and changes in consumer behaviour
- Growth of the market across Spain
- Thorough analysis of the market's competitive landscape and detailed information about companies
- Comprehensive analysis of factors that will challenge the market growth analysis
We can help! Our analysts can customize this market research report to meet your requirements Get in touch
 RIA -
RIA - 
