Spices Market Analysis, Size, and Forecast 2025-2029: North America (US, Canada, and Mexico), Europe (France, Germany, and UK), APAC (China, India, and Japan), South America (Brazil), and Rest of World (ROW)

Spices Market Analysis, Size, and Forecast 2025-2029:
North America (US, Canada, and Mexico), Europe (France, Germany, and UK), APAC (China, India, and Japan), South America (Brazil), and Rest of World (ROW)

Published: Jun 2025 220 Pages SKU: IRTNTR71633

Market Overview at a Glance

$4.01 B
Market Opportunity
7.4%
CAGR
6.8
YoY growth 2024-2025(%)

Spices Market Size 2025-2029

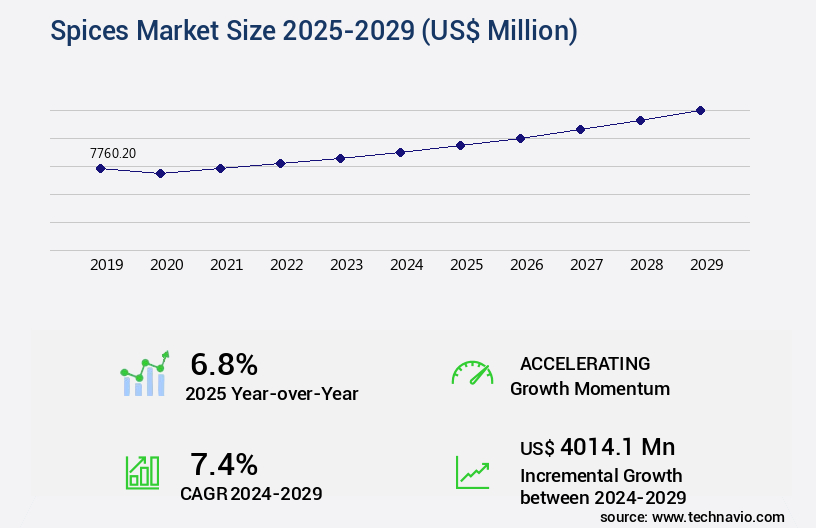
The spices market size is valued to increase USD 4.01 billion, at a CAGR of 7.4% from 2024 to 2029. Growing awareness of the medical benefits of spices will drive the spices market.

Major Market Trends & Insights

  • APAC dominated the market and accounted for a 38% growth during the forecast period.
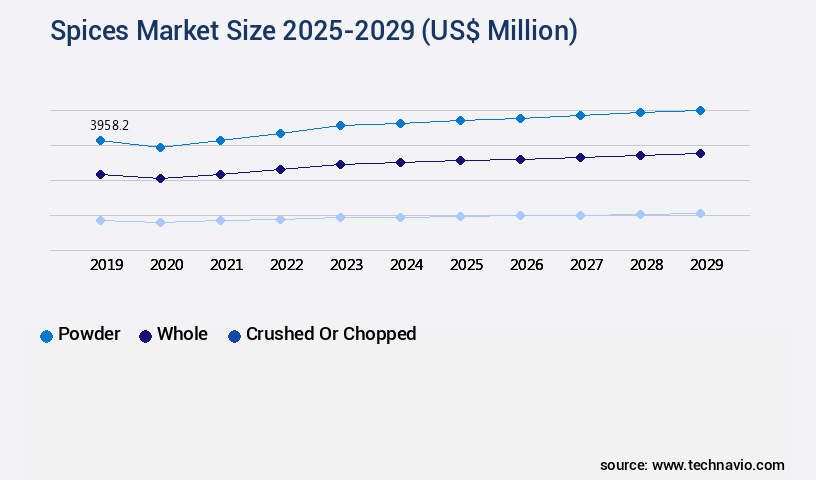
  • By Product Type - Powder segment was valued at USD 3.96 billion in 2023
  • By End-user - Household segment accounted for the largest market revenue share in 2023

Market Size & Forecast

  • Market Opportunities: USD 72.11 million
  • Market Future Opportunities: USD 4014.10 million
  • CAGR from 2024 to 2029 : 7.4%

Market Summary

  • The market is experiencing significant expansion, driven by increasing consumer awareness of the health benefits associated with their use. According to recent industry reports, the market value surpassed USD 15 billion in 2020, with a steady growth trajectory projected. Strategic acquisitions among major players have been a key trend, as companies seek to expand their product offerings and strengthen their market positions. However, the industry faces challenges, including occasional product recalls due to contamination concerns. Despite these hurdles, the future of the market remains bright, with continued innovation and a focus on sustainability expected to shape its evolution.
  • The market's global reach extends to every corner of the world, with key producers including India, China, and Sri Lanka. Consumers and businesses alike value the diverse flavors and health benefits that spices provide, making this a dynamic and ever-evolving sector.

What will be the Size of the Spices Market during the forecast period?

Spices Market Size

Get Key Insights on Market Forecast (PDF) Request Free Sample

How is the Spices Market Segmented ?

The spices industry research report provides comprehensive data (region-wise segment analysis), with forecasts and estimates in "USD million" for the period 2025-2029, as well as historical data from 2019-2023 for the following segments.

  • Product Type
    • Powder
    • Whole
    • Crushed or chopped
  • End-user
    • Household
    • Food service
    • Industrial
  • Distribution Channel
    • Retail
    • Online retail
    • Direct sales
  • Application
    • Culinary
    • Food Processing
    • Pharmaceuticals
  • Geography
    • North America
      • US
      • Canada
    • Europe
      • France
      • Germany
      • Italy
      • UK
    • Middle East and Africa
      • Egypt
      • KSA
      • Oman
      • UAE
    • APAC
      • China
      • India
      • Japan
    • South America
      • Argentina
      • Brazil
    • Rest of World (ROW)

By Product Type Insights

The powder segment is estimated to witness significant growth during the forecast period.

The market encompasses a diverse range of finely ground powdered spices, including chili powder, turmeric, and garam masala. Garam masala, a popular Indian spice blend, is a complex mix of cardamom, cinnamon, cloves, and peppercorns, among other ingredients. This warming spice blend is integral to South Asian cuisine, particularly in India, Nepal, and China. Its sensory attributes are subject to continuous evaluation through methods such as phytochemical analysis and sensory profile mapping. Distribution channels are managed to ensure product freshness, with storage conditions optimized to maintain food safety regulations and extend shelf life. Spice adulteration detection and ingredient standardization are crucial for maintaining quality assurance systems.

Spices Market Size

Request Free Sample

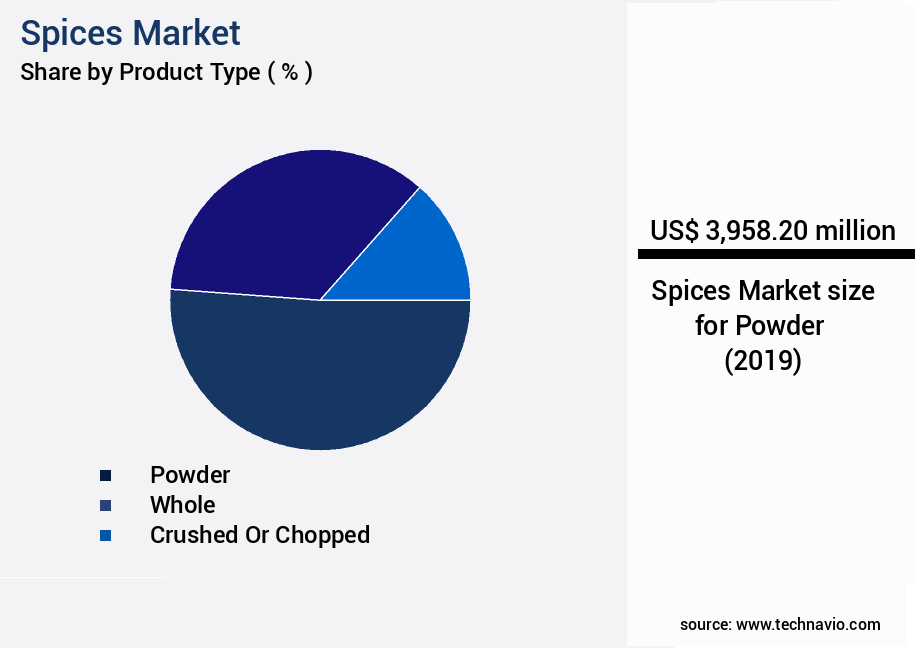
The Powder segment was valued at USD 3.96 billion in 2019 and showed a gradual increase during the forecast period.

Oleoresin extraction and food processing technology are employed for flavor stability studies and active compound identification. Extraction yield optimization, nutritional composition analysis, and heavy metal contamination testing are essential for ingredient sourcing practices. Pesticide residue analysis and microbial contamination control are critical for maintaining product safety. Grinding and milling techniques are optimized to preserve aroma profiles, while supply chain traceability and thermal processing effects are considered for overall quality. The spice industry is a dynamic and evolving field, with ongoing research focusing on improving flavor stability, extending shelf life, and enhancing nutritional value. For instance, recent studies have identified the antioxidant capacity of certain spices, which can contribute to their health benefits.

These advancements are facilitated by ongoing research and development in food processing technology, sensory evaluation methods, and quality control procedures.

Spices Market Size

Request Free Sample

Regional Analysis

APAC is estimated to contribute 38% to the growth of the global market during the forecast period. Technavio's analysts have elaborately explained the regional trends and drivers that shape the market during the forecast period.

Spices Market Share by Geography

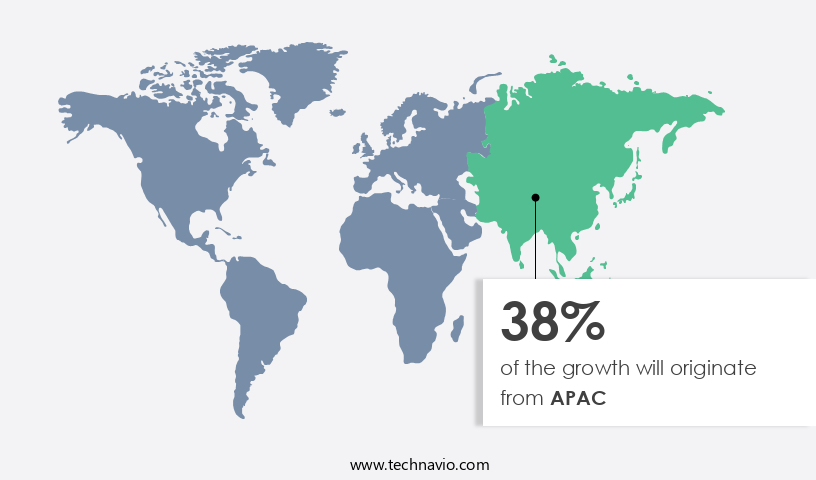
See How Spices Market Demand is Rising in APAC Request Free Sample

The APAC market is experiencing a notable expansion during the forecast period, despite currently holding the third-largest revenue share globally. Key contributors to this growth include India, China, Japan, South Korea, Australia, Thailand, and Singapore. Factors propelling the market's advancement include heightened health consciousness, expanding awareness of diverse spice types, increasing consumer spending from the millennial, Generation X, and Baby Boomer demographics, and the emergence of global spice brands.

Additionally, the adoption of traditional recipes continues to fuel market growth in APAC.

Market Dynamics

Our researchers analyzed the data with 2024 as the base year, along with the key drivers, trends, and challenges. A holistic analysis of drivers will help companies refine their marketing strategies to gain a competitive advantage.

The market is a significant sector in the food industry, with various spices such as chili peppers, cardamom, turmeric, black pepper, cinnamon, clove, ginger, nutmeg, and others, contributing to its growth. In the chili pepper segment, the determination of capsaicinoid content is crucial for ensuring product consistency and quality. This analysis is typically conducted using high-performance liquid chromatography (HPLC) or gas chromatography (GC). Moving on to cardamom, essential oil composition analysis using GC-MS plays a vital role in understanding its quality. The essential oil of cardamom contains various volatile compounds, which contribute to its unique aroma and flavor. Turmeric, another essential spice, is known for its curcumin content. Accurate quantification of curcumin is crucial for food and pharmaceutical applications. HPLC is commonly used for this purpose. Black pepper, a widely used spice, is rich in piperine. Extraction methods such as solvent extraction and supercritical fluid extraction are employed to obtain piperine. The bioavailability of piperine is also a topic of interest, as it enhances the absorption of other nutrients. Cinnamon is known for its antimicrobial properties. The essential oil extracted from cinnamon bark is analyzed for its antimicrobial activity using various methods. Clove, another important spice, is analyzed for its eugenol content using techniques such as GC. The volatile compounds and aroma profile of cloves are also studied to ensure quality. Ginger rhizome processing is optimized to maximize oleoresin extraction efficiency. The extracted oleoresin is analyzed for its bioactive compounds using techniques such as GC-MS and HPLC. Nutmeg is analyzed for its volatile compounds using GC. The essential oil composition variability is also studied to ensure consistent quality. In conclusion, the market is a dynamic and complex industry. The analysis of various compounds, such as capsaicinoids, curcumin, piperine, eugenol, and volatile compounds using techniques such as GC, GC-MS, HPLC, and others, plays a crucial role in ensuring product quality and consistency. Additionally, understanding the antimicrobial activity, antioxidant capacity, and aroma profile of various spices is essential for meeting the evolving consumer demands.

In the diverse and expanding Spices Market, scientific analysis and processing optimization play a critical role in ensuring product quality, potency, and consumer appeal. One of the foundational studies involves capsaicinoid content determination in chili peppers, as these compounds are responsible for the heat intensity and have growing interest for their potential health benefits. Accurate measurement is essential for standardizing spice blends and ensuring consistent product performance. Analytical methods also extend to the essential oil composition of cardamom by GC-MS, which provides detailed insights into its aromatic and therapeutic constituents. This technique allows producers to evaluate purity and origin while tailoring product formulations to meet market expectations.

In turmeric, the focus is often on turmeric curcumin content quantification. Curcumin, the primary bioactive compound, is not only valued for its color and flavor but also for its anti-inflammatory properties, making accurate quantification essential for both culinary and nutraceutical applications. Similarly, black pepper piperine extraction methods are continuously refined to maximize yield and purity. Piperine enhances both flavor and nutrient absorption, and optimizing its extraction supports both food and supplement markets. The black pepper piperine bioavailability is another important consideration, with ongoing research into delivery systems that enhance its absorption in the human body. In cinnamon, interest centers on cinnamon essential oil antimicrobial activity. Studies show that its key components, such as cinnamaldehyde, offer strong microbial inhibition, making cinnamon a functional ingredient in food preservation and natural health products.

The clove eugenol content analysis remains a benchmark for quality control, as eugenol contributes both to the distinctive aroma and therapeutic effects. This is closely linked to broader research on cloves volatile compounds and aroma profile, where comprehensive profiling helps differentiate between varieties and optimize flavor formulations. In ginger, ongoing research targets ginger rhizome processing optimization, focusing on drying, slicing, and milling conditions that preserve bioactives while improving shelf stability. Additionally, ginger oleoresin extraction efficiency is a key concern for industrial processors aiming to concentrate flavor and functional compounds in a cost-effective manner.

Nutmeg also garners attention for its unique sensory profile, with nutmeg volatile compounds identification providing insights into the constituents that define its flavor and fragrance. This knowledge supports quality grading and product differentiation in premium spice lines. Finally, the chili pepper capsaicin stability is a major factor in product formulation and storage. Capsaicin can degrade under heat or light, so understanding its stability helps ensure consistent pungency and efficacy in both food and topical applications.

Together, these technical areas are driving quality assurance, innovation, and value creation in the spices market, enabling producers to meet increasing consumer demand for both flavor and functional benefits.

Spices Market Size

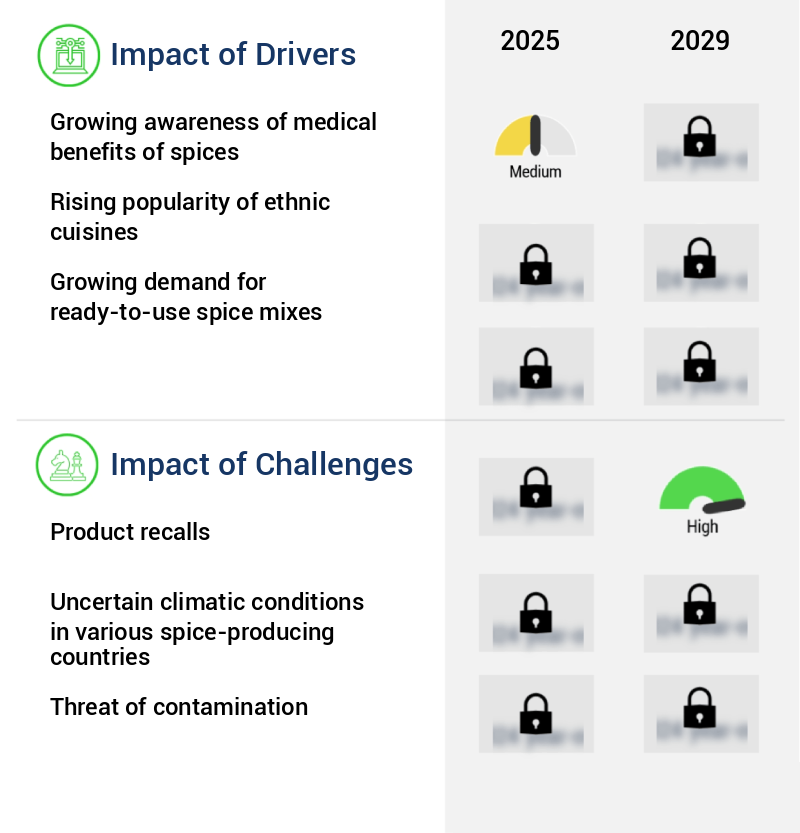
What are the key market drivers leading to the rise in the adoption of Spices Industry?

  • The increasing recognition of spices' medicinal properties serves as the primary catalyst for market growth. 
  • Spices have expanded their role in the culinary world, offering not only taste and flavor enhancement but also significant health benefits. Antioxidant-rich turmeric is known for its disease-fighting properties, aiding in the prevention and treatment of health issues like Alzheimer's, cancer, and joint inflammation. Cumin seeds, with their antiseptic qualities, contribute to immune system strengthening and can even be used as alternatives for beauty products and medicines.
  • Black pepper, a common household spice, is used in various medicinal applications, including treating stomach upsets, bronchitis, and cancer. It is also applied topically for nerve pain (neuralgia) and skin diseases like scabies. These spices' versatility extends beyond the kitchen, making them essential components in various industries, from pharmaceuticals to cosmetics.

What are the market trends shaping the Spices Industry?

  • Major players in the market are increasingly making strategic acquisitions. This trend is set to continue.
  • The dynamic market landscape is marked by continuous evolution and growth, with numerous acquisitions shaping its trajectory. For instance, Tata Consumer Products' acquisition of Organic India, valued at approximately INR 17,000 crores (USD 228 million), bolsters its presence in the wellness and premiumization segments. Likewise, Twelve31 Spice Ventures' acquisition of Frisco Spices, founded in 1928, paved the way for Frisco Brands Inc. These strategic moves underscore companies' efforts to expand into new geographies and segments, embracing innovative technologies and catering to diverse customer bases.

What challenges does the Spices Industry face during its growth?

  • Product recalls pose a significant challenge to industry growth, as companies must efficiently manage the withdrawal of defective products from the market to protect consumer safety and maintain brand reputation. 
  • The presence of contaminants in spices poses significant health risks, leading to numerous product recalls that can negatively impact companies' reputations and finances. In 2023, Wismettac Asian Foods, Inc. recalled Shirakiku brand Spice Seasoning products due to undeclared sesame allergens. In the following year, Curio Spice Co. recalled its Korerima Grains of Paradise spice due to potential mold contamination. More recently, in August 2024, El Servidor Corp.
  • And Gutierrez recalled ground cinnamon due to elevated lead levels. These incidents underscore the importance of maintaining stringent manufacturing and packaging standards to prevent contamination and ensure consumer safety. The continuous evolution of the spice industry necessitates ongoing vigilance and adaptability to mitigate risks and maintain market growth.

Exclusive Technavio Analysis on Customer Landscape

The spices market forecasting report includes the adoption lifecycle of the market, covering from the innovator's stage to the laggard's stage. It focuses on adoption rates in different regions based on penetration. Furthermore, the spices market report also includes key purchase criteria and drivers of price sensitivity to help companies evaluate and develop their market growth analysis strategies.

Spices Market Share by Geography

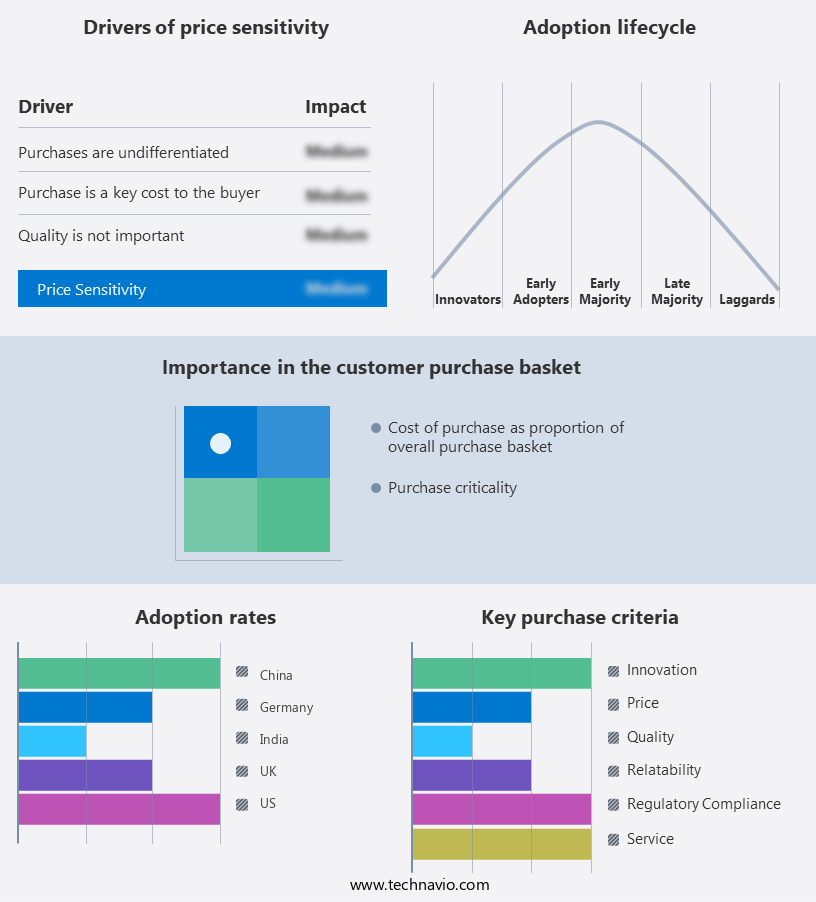
 Customer Landscape of Spices Industry

Competitive Landscape

Companies are implementing various strategies, such as strategic alliances, spices market forecast, partnerships, mergers and acquisitions, geographical expansion, and product/service launches, to enhance their presence in the industry.

Ajinomoto Co. Inc. - This company specializes in providing a diverse range of spice products, including AJITIDE and Hapima Fried Rice Mix, catering to various culinary needs and preferences. 

The industry research and growth report includes detailed analyses of the competitive landscape of the market and information about key companies, including:

  • Ajinomoto Co. Inc.
  • BARIA SPICES Co. Ltd.
  • British Pepper and Spice Co. Ltd.
  • Dohler GmbH
  • DS Group
  • Elite Spice Inc.
  • EVEREST Food Products Pvt. Ltd.
  • Kerry Group Plc
  • Kikkoman Corp.
  • Mahashian Di Hatti Pvt. Ltd.
  • Master of Spices
  • McCormick and Co. Inc.
  • Olam Group Ltd.
  • Paulig Ltd.
  • Royal Spices
  • SOLINA
  • The Bart Ingredients Co.
  • The Speculaas Spice Co. Ltd.
  • Touton SA
  • UK Blending Ltd.

Qualitative and quantitative analysis of companies has been conducted to help clients understand the wider business environment as well as the strengths and weaknesses of key industry players. Data is qualitatively analyzed to categorize companies as pure play, category-focused, industry-focused, and diversified; it is quantitatively analyzed to categorize companies as dominant, leading, strong, tentative, and weak.

Recent Development and News in Spices Market

  • In January 2024, McCormick & Company, a leading spice manufacturer, announced the launch of its new product line, "FlavorWorks by McCormick," catering to professional chefs and foodservice operators (McCormick Press Release, 2024). This expansion aimed to strengthen McCormick's presence in the foodservice industry.
  • In March 2024, Dohler, a global manufacturer of food ingredients, entered into a strategic partnership with Spice India, a leading Indian spice producer, to expand its product portfolio and enhance its presence in the Asian market (Dohler Press Release, 2024). This collaboration marked Dohler's first significant investment in the Indian spices sector.
  • In May 2024, The Spice Trade Company, a prominent spice importer and distributor, secured a major regulatory approval from the European Union for its new production facility in India, enabling it to export spices directly to European markets (The Spice Trade Company Press Release, 2024). This approval significantly increased the company's production capacity and market reach.
  • In April 2025, Kerry Group, a global taste and nutrition company, completed the acquisition of Bio-Techne Corporation's Spice Business, expanding its portfolio of natural and Organic spices and seasonings (Kerry Group Press Release, 2025). This acquisition strengthened Kerry's position in the natural and organic food segment, making it a key player in the market.

Dive into Technavio's robust research methodology, blending expert interviews, extensive data synthesis, and validated models for unparalleled Spices Market insights. See full methodology.

Market Scope

Report Coverage

Details

Page number

220

Base year

2024

Historic period

2019-2023

Forecast period

2025-2029

Growth momentum & CAGR

Accelerate at a CAGR of 7.4%

Market growth 2025-2029

USD 4014.1 million

Market structure

Fragmented

YoY growth 2024-2025(%)

6.8

Key countries

US, Canada, Germany, UK, Italy, France, China, India, Japan, Brazil, Egypt, UAE, Oman, Argentina, KSA, UAE, Brazil, and Rest of World (ROW)

Competitive landscape

Leading Companies, Market Positioning of Companies, Competitive Strategies, and Industry Risks

Request Free Sample

Research Analyst Overview

  • The market continues to evolve, driven by the constant quest for superior quality and authenticity. Phytochemical analysis and sensory attributes evaluation are essential tools in ensuring the authenticity and quality of spices. Distribution channel management plays a pivotal role in reaching consumers, with e-commerce platforms increasingly dominating sales channels. Spice adulteration detection is a critical concern, with advanced technologies such as spectroscopy and chromatography used to identify adulterants. Storage condition optimization and food safety regulations are key factors in maintaining product integrity and consumer trust. Sensory profile mapping and oleoresin extraction are essential for understanding the unique characteristics of different spices and developing new food processing technologies.
  • Active compound identification and shelf-life extension techniques are crucial for enhancing the value proposition of spices. Product formulation development and flavor stability studies are essential for creating innovative food and beverage products. Quality assurance systems and sensory evaluation methods are used to ensure consistent product quality. Antioxidant capacity measurement and ingredient standardization are important for understanding the nutritional benefits of spices. Drying process optimization and heavy metal contamination control are essential for maintaining the safety and purity of spices. Flavor compound isolation and pesticide residue analysis are crucial for developing high-quality spice essential oils.
  • Ingredient sourcing practices, packaging material selection, and microbial contamination control are essential for ensuring a reliable and sustainable supply chain. Extraction yield optimization and color stability assessment are important for maximizing the value of spices and maintaining their visual appeal. The market is expected to grow at a robust rate, driven by increasing demand for natural and organic products and the continuous innovation in food processing technologies. For instance, the market for turmeric, a popular spice, is projected to reach USD 10.6 billion by 2027.

What are the Key Data Covered in this Spices Market Research and Growth Report?

  • What is the expected growth of the Spices Market between 2025 and 2029?

    • USD 4.01 billion, at a CAGR of 7.4%

  • What segmentation does the market report cover?

    • The report is segmented by Product Type (Powder, Whole, and Crushed or chopped), End-user (Household, Food service, and Industrial), Distribution Channel (Retail, Online retail, and Direct sales), Geography (APAC, North America, Europe, South America, and Middle East and Africa), and Application (Culinary, Food Processing, and Pharmaceuticals)

  • Which regions are analyzed in the report?

    • APAC, North America, Europe, South America, and Middle East and Africa

  • What are the key growth drivers and market challenges?

    • Growing awareness of medical benefits of spices, Product recalls

  • Who are the major players in the Spices Market?

    • Ajinomoto Co. Inc., BARIA SPICES Co. Ltd., British Pepper and Spice Co. Ltd., Dohler GmbH, DS Group, Elite Spice Inc., EVEREST Food Products Pvt. Ltd., Kerry Group Plc, Kikkoman Corp., Mahashian Di Hatti Pvt. Ltd., Master of Spices, McCormick and Co. Inc., Olam Group Ltd., Paulig Ltd., Royal Spices, SOLINA, The Bart Ingredients Co., The Speculaas Spice Co. Ltd., Touton SA, and UK Blending Ltd.

Market Research Insights

  • The market for spices is a dynamic and ever-evolving industry, characterized by continuous innovation and adaptation to consumer preferences. According to recent reports, the market size was valued at over 12 million metric tons in 2020. For instance, the demand for organic and natural spices has seen a significant increase, with sales of organic spices growing by over 15% in the past year.
  • Furthermore, the industry is witnessing a shift towards sustainable farming practices, traceability systems, and good manufacturing processes to meet the evolving demands of consumers and regulatory bodies. These trends are expected to drive the growth of the market in the coming years.

We can help! Our analysts can customize this spices market research report to meet your requirements.

Get in touch

1 Executive Summary

  • 1.1 Market overview
    • Executive Summary - Chart on Market Overview
    • Executive Summary - Data Table on Market Overview
    • Executive Summary - Chart on Global Market Characteristics
    • Executive Summary - Chart on Market by Geography
    • Executive Summary - Chart on Market Segmentation by Product Type
    • Executive Summary - Chart on Market Segmentation by End-user
    • Executive Summary - Chart on Market Segmentation by Distribution Channel
    • Executive Summary - Chart on Incremental Growth
    • Executive Summary - Data Table on Incremental Growth
    • Executive Summary - Chart on Company Market Positioning

2 Technavio Analysis

  • 2.1 Analysis of price sensitivity, lifecycle, customer purchase basket, adoption rates, and purchase criteria
    • Analysis of price sensitivity, lifecycle, customer purchase basket, adoption rates, and purchase criteria
  • 2.2 Criticality of inputs and Factors of differentiation
    • Overview on criticality of inputs and factors of differentiation
  • 2.3 Factors of disruption
    • Overview on factors of disruption
  • 2.4 Impact of drivers and challenges
    • Impact of drivers and challenges in 2024 and 2029

3 Market Landscape

  • 3.1 Market ecosystem
    • Parent Market
    • Data Table on - Parent Market
  • 3.2 Market characteristics
    • Market characteristics analysis
  • 3.3 Value chain analysis
    • Value chain analysis

4 Market Sizing

  • 4.1 Market definition
    • Offerings of companies included in the market definition
  • 4.2 Market segment analysis
    • Market segments
  • 4.3 Market size 2024
    • 4.4 Market outlook: Forecast for 2024-2029
      • Chart on Global - Market size and forecast 2024-2029 ($ million)
      • Data Table on Global - Market size and forecast 2024-2029 ($ million)
      • Chart on Global Market: Year-over-year growth 2024-2029 (%)
      • Data Table on Global Market: Year-over-year growth 2024-2029 (%)

    5 Historic Market Size

    • 5.1 Global Spices Market 2019 - 2023
      • Historic Market Size - Data Table on Global Spices Market 2019 - 2023 ($ million)
    • 5.2 Product Type segment analysis 2019 - 2023
      • Historic Market Size - Product Type Segment 2019 - 2023 ($ million)
    • 5.3 End-user segment analysis 2019 - 2023
      • Historic Market Size - End-user Segment 2019 - 2023 ($ million)
    • 5.4 Distribution Channel segment analysis 2019 - 2023
      • Historic Market Size - Distribution Channel Segment 2019 - 2023 ($ million)
    • 5.5 Geography segment analysis 2019 - 2023
      • Historic Market Size - Geography Segment 2019 - 2023 ($ million)
    • 5.6 Country segment analysis 2019 - 2023
      • Historic Market Size - Country Segment 2019 - 2023 ($ million)

    6 Qualitative Analysis

    • 6.1 Impact of AI on global spices market

      7 Five Forces Analysis

      • 7.1 Five forces summary
        • Five forces analysis - Comparison between 2024 and 2029
      • 7.2 Bargaining power of buyers
        • Bargaining power of buyers - Impact of key factors 2024 and 2029
      • 7.3 Bargaining power of suppliers
        • Bargaining power of suppliers - Impact of key factors in 2024 and 2029
      • 7.4 Threat of new entrants
        • Threat of new entrants - Impact of key factors in 2024 and 2029
      • 7.5 Threat of substitutes
        • Threat of substitutes - Impact of key factors in 2024 and 2029
      • 7.6 Threat of rivalry
        • Threat of rivalry - Impact of key factors in 2024 and 2029
      • 7.7 Market condition
        • Chart on Market condition - Five forces 2024 and 2029

      8 Market Segmentation by Product Type

      • 8.1 Market segments
        • Chart on Product Type - Market share (2024-2029) (%)
        • Data Table on Product Type - Market share (2024-2029) (%)
      • 8.2 Comparison by Product Type
        • Chart on Comparison by Product Type
        • Data Table on Comparison by Product Type
      • 8.3 Powder - Market size and forecast (2024-2029)
        • Chart on Powder - Market size and forecast (2024-2029) ($ million)
        • Data Table on Powder - Market size and forecast (2024-2029) ($ million)
        • Chart on Powder - Year-over-year growth (2024-2029) (%)
        • Data Table on Powder - Year-over-year growth (2024-2029) (%)
      • 8.4 Whole - Market size and forecast (2024-2029)
        • Chart on Whole - Market size and forecast (2024-2029) ($ million)
        • Data Table on Whole - Market size and forecast (2024-2029) ($ million)
        • Chart on Whole - Year-over-year growth (2024-2029) (%)
        • Data Table on Whole - Year-over-year growth (2024-2029) (%)
      • 8.5 Crushed or chopped - Market size and forecast (2024-2029)
        • Chart on Crushed or chopped - Market size and forecast (2024-2029) ($ million)
        • Data Table on Crushed or chopped - Market size and forecast (2024-2029) ($ million)
        • Chart on Crushed or chopped - Year-over-year growth (2024-2029) (%)
        • Data Table on Crushed or chopped - Year-over-year growth (2024-2029) (%)
      • 8.6 Market opportunity by Product Type
        • Market opportunity by Product Type ($ million)
        • Data Table on Market opportunity by Product Type ($ million)

      9 Market Segmentation by End-user

      • 9.1 Market segments
        • Chart on End-user - Market share (2024-2029) (%)
        • Data Table on End-user - Market share (2024-2029) (%)
      • 9.2 Comparison by End-user
        • Chart on Comparison by End-user
        • Data Table on Comparison by End-user
      • 9.3 Household - Market size and forecast (2024-2029)
        • Chart on Household - Market size and forecast (2024-2029) ($ million)
        • Data Table on Household - Market size and forecast (2024-2029) ($ million)
        • Chart on Household - Year-over-year growth (2024-2029) (%)
        • Data Table on Household - Year-over-year growth (2024-2029) (%)
      • 9.4 Food service - Market size and forecast (2024-2029)
        • Chart on Food service - Market size and forecast (2024-2029) ($ million)
        • Data Table on Food service - Market size and forecast (2024-2029) ($ million)
        • Chart on Food service - Year-over-year growth (2024-2029) (%)
        • Data Table on Food service - Year-over-year growth (2024-2029) (%)
      • 9.5 Industrial - Market size and forecast (2024-2029)
        • Chart on Industrial - Market size and forecast (2024-2029) ($ million)
        • Data Table on Industrial - Market size and forecast (2024-2029) ($ million)
        • Chart on Industrial - Year-over-year growth (2024-2029) (%)
        • Data Table on Industrial - Year-over-year growth (2024-2029) (%)
      • 9.6 Market opportunity by End-user
        • Market opportunity by End-user ($ million)
        • Data Table on Market opportunity by End-user ($ million)

      10 Market Segmentation by Distribution Channel

      • 10.1 Market segments
        • Chart on Distribution Channel - Market share (2024-2029) (%)
        • Data Table on Distribution Channel - Market share (2024-2029) (%)
      • 10.2 Comparison by Distribution Channel
        • Chart on Comparison by Distribution Channel
        • Data Table on Comparison by Distribution Channel
      • 10.3 Retail - Market size and forecast (2024-2029)
        • Chart on Retail - Market size and forecast (2024-2029) ($ million)
        • Data Table on Retail - Market size and forecast (2024-2029) ($ million)
        • Chart on Retail - Year-over-year growth (2024-2029) (%)
        • Data Table on Retail - Year-over-year growth (2024-2029) (%)
      • 10.4 Online retail - Market size and forecast (2024-2029)
        • Chart on Online retail - Market size and forecast (2024-2029) ($ million)
        • Data Table on Online retail - Market size and forecast (2024-2029) ($ million)
        • Chart on Online retail - Year-over-year growth (2024-2029) (%)
        • Data Table on Online retail - Year-over-year growth (2024-2029) (%)
      • 10.5 Direct sales - Market size and forecast (2024-2029)
        • Chart on Direct sales - Market size and forecast (2024-2029) ($ million)
        • Data Table on Direct sales - Market size and forecast (2024-2029) ($ million)
        • Chart on Direct sales - Year-over-year growth (2024-2029) (%)
        • Data Table on Direct sales - Year-over-year growth (2024-2029) (%)
      • 10.6 Market opportunity by Distribution Channel
        • Market opportunity by Distribution Channel ($ million)
        • Data Table on Market opportunity by Distribution Channel ($ million)

      11 Market Segmentation by Application

      • 11.1 Market segments
        • Chart on Application - Market share (2024-2029) (%)
        • Data Table on Application - Market share (2024-2029) (%)
      • 11.2 Comparison by Application
        • Chart on Comparison by Application
        • Data Table on Comparison by Application
      • 11.3 Culinary - Market size and forecast (2024-2029)
        • Chart on Culinary - Market size and forecast (2024-2029) ($ million)
        • Data Table on Culinary - Market size and forecast (2024-2029) ($ million)
        • Chart on Culinary - Year-over-year growth (2024-2029) (%)
        • Data Table on Culinary - Year-over-year growth (2024-2029) (%)
      • 11.4 Food Processing - Market size and forecast (2024-2029)
        • Chart on Food Processing - Market size and forecast (2024-2029) ($ million)
        • Data Table on Food Processing - Market size and forecast (2024-2029) ($ million)
        • Chart on Food Processing - Year-over-year growth (2024-2029) (%)
        • Data Table on Food Processing - Year-over-year growth (2024-2029) (%)
      • 11.5 Pharmaceuticals - Market size and forecast (2024-2029)
        • Chart on Pharmaceuticals - Market size and forecast (2024-2029) ($ million)
        • Data Table on Pharmaceuticals - Market size and forecast (2024-2029) ($ million)
        • Chart on Pharmaceuticals - Year-over-year growth (2024-2029) (%)
        • Data Table on Pharmaceuticals - Year-over-year growth (2024-2029) (%)
      • 11.6 Market opportunity by Application
        • Market opportunity by Application ($ million)
        • Data Table on Market opportunity by Application ($ million)

      12 Customer Landscape

      • 12.1 Customer landscape overview
        • Analysis of price sensitivity, lifecycle, customer purchase basket, adoption rates, and purchase criteria

      13 Geographic Landscape

      • 13.1 Geographic segmentation
        • Chart on Market share by geography 2024-2029 (%)
        • Data Table on Market share by geography 2024-2029 (%)
      • 13.2 Geographic comparison
        • Chart on Geographic comparison
        • Data Table on Geographic comparison
      • 13.3 APAC - Market size and forecast 2024-2029
        • Chart on APAC - Market size and forecast 2024-2029 ($ million)
        • Data Table on APAC - Market size and forecast 2024-2029 ($ million)
        • Chart on APAC - Year-over-year growth 2024-2029 (%)
        • Data Table on APAC - Year-over-year growth 2024-2029 (%)
      • 13.4 North America - Market size and forecast 2024-2029
        • Chart on North America - Market size and forecast 2024-2029 ($ million)
        • Data Table on North America - Market size and forecast 2024-2029 ($ million)
        • Chart on North America - Year-over-year growth 2024-2029 (%)
        • Data Table on North America - Year-over-year growth 2024-2029 (%)
      • 13.5 Europe - Market size and forecast 2024-2029
        • Chart on Europe - Market size and forecast 2024-2029 ($ million)
        • Data Table on Europe - Market size and forecast 2024-2029 ($ million)
        • Chart on Europe - Year-over-year growth 2024-2029 (%)
        • Data Table on Europe - Year-over-year growth 2024-2029 (%)
      • 13.6 South America - Market size and forecast 2024-2029
        • Chart on South America - Market size and forecast 2024-2029 ($ million)
        • Data Table on South America - Market size and forecast 2024-2029 ($ million)
        • Chart on South America - Year-over-year growth 2024-2029 (%)
        • Data Table on South America - Year-over-year growth 2024-2029 (%)
      • 13.7 Middle East and Africa - Market size and forecast 2024-2029
        • Chart on Middle East and Africa - Market size and forecast 2024-2029 ($ million)
        • Data Table on Middle East and Africa - Market size and forecast 2024-2029 ($ million)
        • Chart on Middle East and Africa - Year-over-year growth 2024-2029 (%)
        • Data Table on Middle East and Africa - Year-over-year growth 2024-2029 (%)
      • 13.8 US - Market size and forecast 2024-2029
        • Chart on US - Market size and forecast 2024-2029 ($ million)
        • Data Table on US - Market size and forecast 2024-2029 ($ million)
        • Chart on US - Year-over-year growth 2024-2029 (%)
        • Data Table on US - Year-over-year growth 2024-2029 (%)
      • 13.9 China - Market size and forecast 2024-2029
        • Chart on China - Market size and forecast 2024-2029 ($ million)
        • Data Table on China - Market size and forecast 2024-2029 ($ million)
        • Chart on China - Year-over-year growth 2024-2029 (%)
        • Data Table on China - Year-over-year growth 2024-2029 (%)
      • 13.10 India - Market size and forecast 2024-2029
        • Chart on India - Market size and forecast 2024-2029 ($ million)
        • Data Table on India - Market size and forecast 2024-2029 ($ million)
        • Chart on India - Year-over-year growth 2024-2029 (%)
        • Data Table on India - Year-over-year growth 2024-2029 (%)
      • 13.11 Canada - Market size and forecast 2024-2029
        • Chart on Canada - Market size and forecast 2024-2029 ($ million)
        • Data Table on Canada - Market size and forecast 2024-2029 ($ million)
        • Chart on Canada - Year-over-year growth 2024-2029 (%)
        • Data Table on Canada - Year-over-year growth 2024-2029 (%)
      • 13.12 Japan - Market size and forecast 2024-2029
        • Chart on Japan - Market size and forecast 2024-2029 ($ million)
        • Data Table on Japan - Market size and forecast 2024-2029 ($ million)
        • Chart on Japan - Year-over-year growth 2024-2029 (%)
        • Data Table on Japan - Year-over-year growth 2024-2029 (%)
      • 13.13 UK - Market size and forecast 2024-2029
        • Chart on UK - Market size and forecast 2024-2029 ($ million)
        • Data Table on UK - Market size and forecast 2024-2029 ($ million)
        • Chart on UK - Year-over-year growth 2024-2029 (%)
        • Data Table on UK - Year-over-year growth 2024-2029 (%)
      • 13.14 Germany - Market size and forecast 2024-2029
        • Chart on Germany - Market size and forecast 2024-2029 ($ million)
        • Data Table on Germany - Market size and forecast 2024-2029 ($ million)
        • Chart on Germany - Year-over-year growth 2024-2029 (%)
        • Data Table on Germany - Year-over-year growth 2024-2029 (%)
      • 13.15 Brazil - Market size and forecast 2024-2029
        • Chart on Brazil - Market size and forecast 2024-2029 ($ million)
        • Data Table on Brazil - Market size and forecast 2024-2029 ($ million)
        • Chart on Brazil - Year-over-year growth 2024-2029 (%)
        • Data Table on Brazil - Year-over-year growth 2024-2029 (%)
      • 13.16 Mexico - Market size and forecast 2024-2029
        • Chart on Mexico - Market size and forecast 2024-2029 ($ million)
        • Data Table on Mexico - Market size and forecast 2024-2029 ($ million)
        • Chart on Mexico - Year-over-year growth 2024-2029 (%)
        • Data Table on Mexico - Year-over-year growth 2024-2029 (%)
      • 13.17 France - Market size and forecast 2024-2029
        • Chart on France - Market size and forecast 2024-2029 ($ million)
        • Data Table on France - Market size and forecast 2024-2029 ($ million)
        • Chart on France - Year-over-year growth 2024-2029 (%)
        • Data Table on France - Year-over-year growth 2024-2029 (%)
      • 13.18 Market opportunity by geography
        • Market opportunity by geography ($ million)
        • Data Tables on Market opportunity by geography ($ million)
      • 13.19 Italy - Market size and forecast (2024-2029)
        • Chart on Italy - Market size and forecast (2024-2029) ($ million)
        • Data Table on Italy - Market size and forecast (2024-2029) ($ million)
        • Chart on Italy - Year-over-year growth (2024-2029) (%)
        • Data Table on Italy - Year-over-year growth (2024-2029) (%)
      • 13.20 Egypt - Market size and forecast (2024-2029)
        • Chart on Egypt - Market size and forecast (2024-2029) ($ million)
        • Data Table on Egypt - Market size and forecast (2024-2029) ($ million)
        • Chart on Egypt - Year-over-year growth (2024-2029) (%)
        • Data Table on Egypt - Year-over-year growth (2024-2029) (%)
      • 13.21 UAE - Market size and forecast (2024-2029)
        • Chart on UAE - Market size and forecast (2024-2029) ($ million)
        • Data Table on UAE - Market size and forecast (2024-2029) ($ million)
        • Chart on UAE - Year-over-year growth (2024-2029) (%)
        • Data Table on UAE - Year-over-year growth (2024-2029) (%)
      • 13.22 Oman - Market size and forecast (2024-2029)
        • Chart on Oman - Market size and forecast (2024-2029) ($ million)
        • Data Table on Oman - Market size and forecast (2024-2029) ($ million)
        • Chart on Oman - Year-over-year growth (2024-2029) (%)
        • Data Table on Oman - Year-over-year growth (2024-2029) (%)
      • 13.23 Argentina - Market size and forecast (2024-2029)
        • Chart on Argentina - Market size and forecast (2024-2029) ($ million)
        • Data Table on Argentina - Market size and forecast (2024-2029) ($ million)
        • Chart on Argentina - Year-over-year growth (2024-2029) (%)
        • Data Table on Argentina - Year-over-year growth (2024-2029) (%)
      • 13.24 KSA - Market size and forecast (2024-2029)
        • Chart on KSA - Market size and forecast (2024-2029) ($ million)
        • Data Table on KSA - Market size and forecast (2024-2029) ($ million)
        • Chart on KSA - Year-over-year growth (2024-2029) (%)
        • Data Table on KSA - Year-over-year growth (2024-2029) (%)
      • 13.25 Rest of World (ROW) - Market size and forecast (2024-2029)
        • Chart on Rest of World (ROW) - Market size and forecast (2024-2029) ($ million)
        • Data Table on Rest of World (ROW) - Market size and forecast (2024-2029) ($ million)
        • Chart on Rest of World (ROW) - Year-over-year growth (2024-2029) (%)
        • Data Table on Rest of World (ROW) - Year-over-year growth (2024-2029) (%)

      14 Drivers, Challenges, and Opportunity/Restraints

      • 14.1 Market drivers
        • 14.2 Market challenges
          • 14.3 Impact of drivers and challenges
            • Impact of drivers and challenges in 2024 and 2029
          • 14.4 Market opportunities/restraints

            15 Competitive Landscape

            • 15.1 Overview
              • 15.2 Competitive Landscape
                • Overview on criticality of inputs and factors of differentiation
              • 15.3 Landscape disruption
                • Overview on factors of disruption
              • 15.4 Industry risks
                • Impact of key risks on business

              16 Competitive Analysis

              • 16.1 Companies profiled
                • Companies covered
              • 16.2 Company ranking index
                • Company ranking index
              • 16.3 Market positioning of companies
                • Matrix on companies position and classification
              • 16.4 Ajinomoto Co. Inc.
                • Ajinomoto Co. Inc. - Overview
                • Ajinomoto Co. Inc. - Business segments
                • Ajinomoto Co. Inc. - Key news
                • Ajinomoto Co. Inc. - Key offerings
                • Ajinomoto Co. Inc. - Segment focus
                • SWOT
              • 16.5 BARIA SPICES Co. Ltd.
                • BARIA SPICES Co. Ltd. - Overview
                • BARIA SPICES Co. Ltd. - Product / Service
                • BARIA SPICES Co. Ltd. - Key offerings
                • SWOT
              • 16.6 British Pepper and Spice Co. Ltd.
                • British Pepper and Spice Co. Ltd. - Overview
                • British Pepper and Spice Co. Ltd. - Product / Service
                • British Pepper and Spice Co. Ltd. - Key offerings
                • SWOT
              • 16.7 Dohler GmbH
                • Dohler GmbH - Overview
                • Dohler GmbH - Product / Service
                • Dohler GmbH - Key offerings
                • SWOT
              • 16.8 DS Group
                • DS Group - Overview
                • DS Group - Product / Service
                • DS Group - Key offerings
                • SWOT
              • 16.9 EVEREST Food Products Pvt. Ltd.
                • EVEREST Food Products Pvt. Ltd. - Overview
                • EVEREST Food Products Pvt. Ltd. - Product / Service
                • EVEREST Food Products Pvt. Ltd. - Key offerings
                • SWOT
              • 16.10 Kerry Group Plc
                • Kerry Group Plc - Overview
                • Kerry Group Plc - Business segments
                • Kerry Group Plc - Key offerings
                • Kerry Group Plc - Segment focus
                • SWOT
              • 16.11 Kikkoman Corp.
                • Kikkoman Corp. - Overview
                • Kikkoman Corp. - Business segments
                • Kikkoman Corp. - Key offerings
                • Kikkoman Corp. - Segment focus
                • SWOT
              • 16.12 Mahashian Di Hatti Pvt. Ltd.
                • Mahashian Di Hatti Pvt. Ltd. - Overview
                • Mahashian Di Hatti Pvt. Ltd. - Product / Service
                • Mahashian Di Hatti Pvt. Ltd. - Key offerings
                • SWOT
              • 16.13 Master of Spices
                • Master of Spices - Overview
                • Master of Spices - Product / Service
                • Master of Spices - Key offerings
                • SWOT
              • 16.14 McCormick and Co. Inc.
                • McCormick and Co. Inc. - Overview
                • McCormick and Co. Inc. - Business segments
                • McCormick and Co. Inc. - Key news
                • McCormick and Co. Inc. - Key offerings
                • McCormick and Co. Inc. - Segment focus
                • SWOT
              • 16.15 Olam Group Ltd.
                • Olam Group Ltd. - Overview
                • Olam Group Ltd. - Business segments
                • Olam Group Ltd. - Key offerings
                • Olam Group Ltd. - Segment focus
                • SWOT
              • 16.16 The Bart Ingredients Co.
                • The Bart Ingredients Co. - Overview
                • The Bart Ingredients Co. - Product / Service
                • The Bart Ingredients Co. - Key offerings
                • SWOT
              • 16.17 The Speculaas Spice Co. Ltd.
                • The Speculaas Spice Co. Ltd. - Overview
                • The Speculaas Spice Co. Ltd. - Product / Service
                • The Speculaas Spice Co. Ltd. - Key offerings
                • SWOT
              • 16.18 UK Blending Ltd.
                • UK Blending Ltd. - Overview
                • UK Blending Ltd. - Product / Service
                • UK Blending Ltd. - Key offerings
                • SWOT

              17 Appendix

              • 17.1 Scope of the report
                • 17.2 Inclusions and exclusions checklist
                  • Inclusions checklist
                  • Exclusions checklist
                • 17.3 Currency conversion rates for US$
                  • Currency conversion rates for US$
                • 17.4 Research methodology
                  • Research methodology
                • 17.5 Data procurement
                  • Information sources
                • 17.6 Data validation
                  • Data validation
                • 17.7 Validation techniques employed for market sizing
                  • Validation techniques employed for market sizing
                • 17.8 Data synthesis
                  • Data synthesis
                • 17.9 360 degree market analysis
                  • 360 degree market analysis
                • 17.10 List of abbreviations
                  • List of abbreviations

                Research Methodology

                Technavio presents a detailed picture of the market by way of study, synthesis, and summation of data from multiple sources. The analysts have presented the various facets of the market with a particular focus on identifying the key industry influencers. The data thus presented is comprehensive, reliable, and the result of extensive research, both primary and secondary.

                INFORMATION SOURCES

                Primary sources

                • Manufacturers and suppliers
                • Channel partners
                • Industry experts
                • Strategic decision makers

                Secondary sources

                • Industry journals and periodicals
                • Government data
                • Financial reports of key industry players
                • Historical data
                • Press releases

                DATA ANALYSIS

                Data Synthesis

                • Collation of data
                • Estimation of key figures
                • Analysis of derived insights

                Data Validation

                • Triangulation with data models
                • Reference against proprietary databases
                • Corroboration with industry experts

                REPORT WRITING

                Qualitative

                • Market drivers
                • Market challenges
                • Market trends
                • Five forces analysis

                Quantitative

                • Market size and forecast
                • Market segmentation
                • Geographical insights
                • Competitive landscape

                Interested in this report?

                Get your sample now to see our research methodology and insights!

                Download Now

                Frequently Asked Questions

                Spices market growth will increase by $ 4014.1 mn during 2025-2029 .

                The Spices market is expected to grow at a CAGR of 7.4% during 2025-2029 .

                Spices market is segmented by Product Type( Powder, Whole, Crushed or chopped) End-user( Household, Food service, Industrial) Distribution Channel( Retail, Online retail, Direct sales, South America, Middle East and Africa)

                Ajinomoto Co. Inc., BARIA SPICES Co. Ltd., British Pepper and Spice Co. Ltd., Dohler GmbH, DS Group, Elite Spice Inc., EVEREST Food Products Pvt. Ltd., Kerry Group Plc, Kikkoman Corp., Mahashian Di Hatti Pvt. Ltd., Master of Spices, McCormick and Co. Inc., Olam Group Ltd., Paulig Ltd., Royal Spices, SOLINA, The Bart Ingredients Co., The Speculaas Spice Co. Ltd., Touton SA, UK Blending Ltd. are a few of the key vendors in the Spices market.

                APAC will register the highest growth rate of 38% among the other regions. Therefore, the Spices market in APAC is expected to garner significant business opportunities for the vendors during the forecast period.

                US, Canada, Germany, UK, Italy, France, China, India, Japan, Brazil, Egypt, UAE, Oman, Argentina, KSA, UAE, Brazil, Rest of World (ROW)

                • Growing awareness of medical benefits of spicesSpices today are not just used for taste and flavor but also for the health benefits they possess. They have antioxidant properties and are is the driving factor this market.
                • thus is the driving factor this market.
                • used in food to treat health problems or diseases. For instance is the driving factor this market.
                • turmeric is rich in antioxidants and helps in fighting against diseases such as Alzheimer is the driving factor this market.
                • cancer is the driving factor this market.
                • and joint inflammation. Cumin seeds have antiseptic qualities and help in building the immune system. They can be used as substitutes even for beauty products and medicines. Black pepper powder is also used to make medicines. It is often used to cure stomach upsets is the driving factor this market.
                • bronchitis is the driving factor this market.
                • and cancer. It is sometimes applied directly to the skin to treat nerve pain (neuralgia) and a skin disease called scabies. Black pepper is also typically used as a counterirritant for pain is the driving factor this market.
                • as the medicinal properties of various spices are backed by scientific evidence. Consumer interest in spices has increased is the driving factor this market.
                • driving the growth of the global spices market.Spice companies have also started new advertising campaigns to encourage consumers to try recipes at home. Companies like McCormick and Kerry have also started campaigns on social media such as Facebook is the driving factor this market.
                • Pinterest is the driving factor this market.
                • and Twitter to help establish their brands identities. Increasing medicinal benefits and changing consumer tastes and preferences will continue to drive the growth of the global spices market during the forecast period. is the driving factor this market.

                The Spices market vendors should focus on grabbing business opportunities from the Powder segment as it accounted for the largest market share in the base year.