Stainless Steel Anchor Chain Market Size 2025-2029
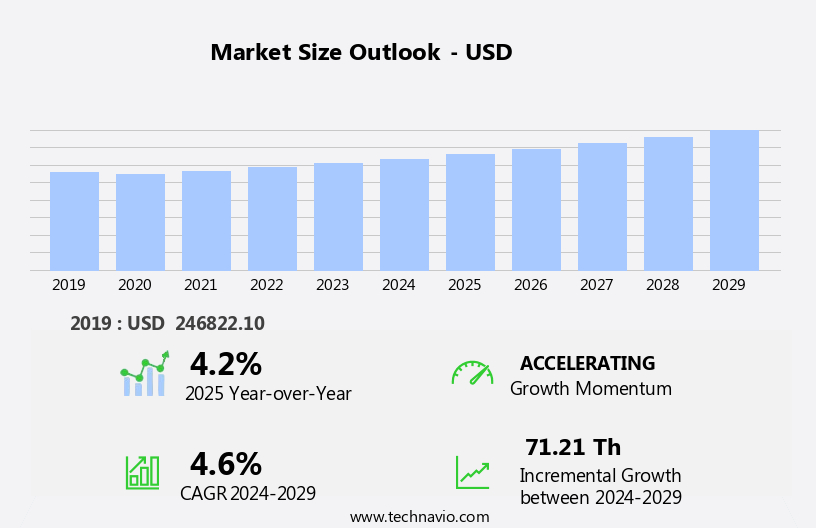
The stainless steel anchor chain market size is forecast to increase by USD 71.21 th, at a CAGR of 4.6% between 2024 and 2029.
- The market is experiencing significant growth, driven primarily by the increasing adoption of offshore floating wind turbines. The shift towards renewable energy sources, particularly offshore wind energy, is a key trend propelling market expansion. Stainless steel anchor chains are essential components in the installation and operation of these turbines, ensuring their stability and durability in harsh marine environments. However, the market faces challenges due to the high prices of raw materials, particularly nickel and chromium, which are integral to stainless steel production.
- These rising costs pose a significant obstacle for manufacturers, potentially leading to increased production costs and reduced competitiveness. Sustainability in stainless steel production is another challenge, as the industry seeks to reduce its carbon footprint and adopt more environmentally friendly processes. Addressing these challenges through innovation and cost optimization strategies will be crucial for companies seeking to capitalize on the market's growth opportunities.
What will be the Size of the Stainless Steel Anchor Chain Market during the forecast period?
The market showcases a continuous and evolving nature, driven by the dynamic requirements of various sectors. The anchor chain system plays a pivotal role in ensuring boat safety and anchoring efficiency across the marine industry, from recreational boating to commercial shipping and offshore operations. Chain assembly is a critical process in manufacturing stainless steel anchor chains, with considerations given to chain proof load, durability, and maintenance. Marine-grade stainless steel is frequently used due to its superior corrosion resistance and impact strength. Chain forging and heat treatment are essential processes in enhancing chain strength and longevity. Chain coatings further bolster resistance to abrasion and environmental factors, while certifications ensure compliance with industry standards.
Chain size, weight, and link diameter are essential factors in determining boat displacement, anchor holding power, and boat draft. Proper chain inspection and maintenance are crucial to mitigate chain fatigue resistance and ensure chain longevity. The ongoing unfolding of market activities reveals evolving patterns in chain manufacturing, with advancements in chain link design, chain link pitch, and chain elongation. Chain replacement and polishing are essential for maintaining optimal chain performance and boat safety. Stainless steel anchor chains are indispensable in various applications, from boat anchoring and mooring to naval and offshore industries. The continuous demand for enhanced chain performance and durability fuels ongoing innovation and development in this market.
How is this Stainless Steel Anchor Chain Industry segmented?
The stainless steel anchor chain industry research report provides comprehensive data (region-wise segment analysis), with forecasts and estimates in "USD thousand" for the period 2025-2029, as well as historical data from 2019-2023 for the following segments.
- Application
- Marine and shipping
- Offshore energy
- Others
- Distribution Channel
- Offline
- Online
- Geography
- North America
- US
- Europe
- France
- Germany
- Spain
- UK
- APAC
- China
- Japan
- South Korea
- South America
- Brazil
- Rest of World (ROW)
- North America
By Application Insights
The marine and shipping segment is estimated to witness significant growth during the forecast period.
The marine and shipping industry relies heavily on stainless steel anchor chains for secure and dependable mooring of vessels. These chains are an integral part of maritime operations, with marine-grade chains starting from Grade 40, offering greater strength than Grade 30 chains. Boaters utilize these chains for anchor lines, mooring lines, and other moderate-duty marine applications. The enhanced security and durability provided by Grade 40 chains make them suitable for challenging marine conditions. Additionally, Grade 70 chains are used for transportation and tie-down purposes within the marine industry. Galvanized chains undergo rigorous testing to ensure chain link pitch, chain diameter, and chain working load meet industry standards.
Commercial shipping and offshore industries also benefit from stainless steel anchor chains due to their superior corrosion resistance, chain fatigue resistance, and longevity. Boat size and type influence chain selection, with larger boats requiring thicker chain links and longer chain lengths. Chain inspection, manufacturing, and maintenance are crucial for maintaining optimal chain performance and boat safety. Stainless steel chains are forged, heat-treated, and coated for improved impact resistance and wear resistance. The boating industry, including recreational boating and yachting, also utilizes stainless steel anchor chains for their superior chain elongation and chain proof load capabilities. Chain replacement is essential to ensure continued boat safety and optimal chain performance.
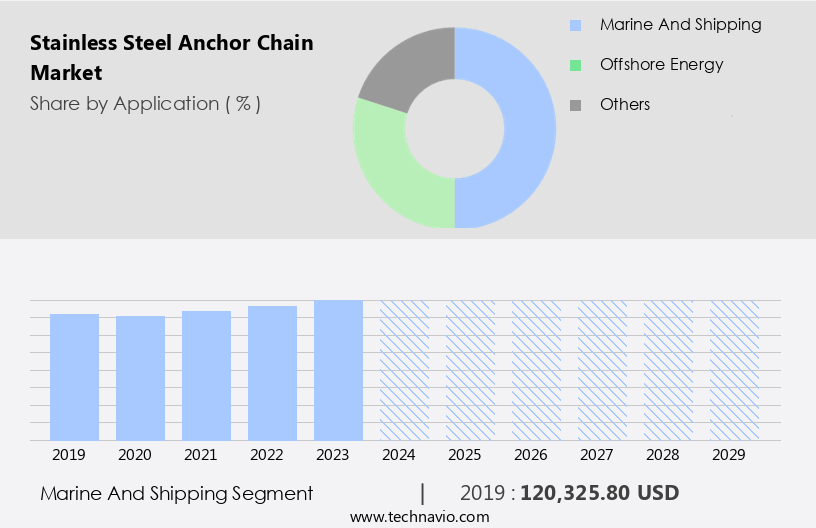
The Marine and shipping segment was valued at USD 120325.80 th in 2019 and showed a gradual increase during the forecast period.
Regional Analysis
APAC is estimated to contribute 50% to the growth of the global market during the forecast period.Technavio’s analysts have elaborately explained the regional trends and drivers that shape the market during the forecast period.
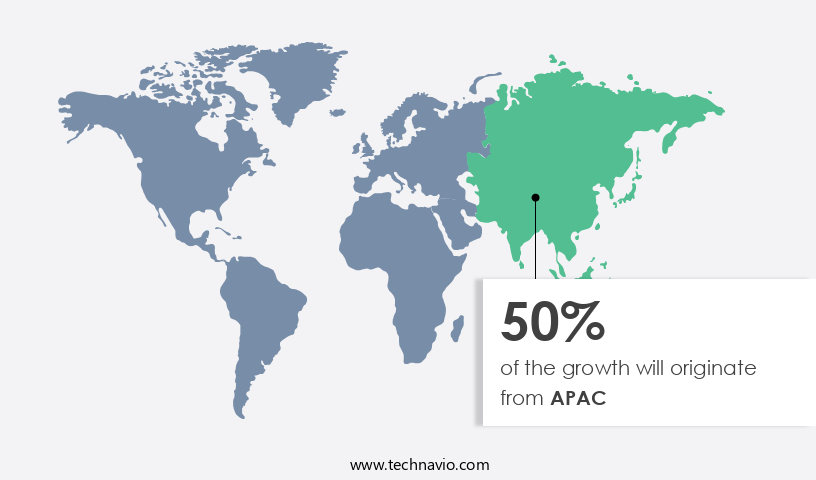
The market is witnessing significant growth, particularly in the Asia Pacific region. This expansion is driven by strategic government initiatives and large-scale industrial projects. In July 2024, the Indian government launched the Production Linked Incentive (PLI) Scheme for specialty steel and stainless steel, aimed at boosting domestic production and reducing import dependency. This initiative attracts substantial capital investments, fostering self-sufficiency in the production of 'Specialty Steel.' Boat industries worldwide utilize stainless steel anchor chains due to their superior corrosion resistance, chain durability, and fatigue resistance. The yachting and commercial shipping industries are major consumers, requiring high-performance anchor chains for boat safety and anchor holding power.
The chain's diameter, link pitch, and working load are crucial factors in ensuring optimal boat anchoring. Chain manufacturing involves processes like forging, galvanizing, and certification to meet industry standards. Stainless steel's high tensile strength, breaking strength, and impact resistance make it an ideal choice for marine applications. Chain testing, inspection, and maintenance are essential to ensure longevity and performance. The offshore industry, naval industry, and marine industry also rely on stainless steel anchor chains for boat navigation and anchor deployment. Boat size, boat type, and boat displacement are essential factors in determining the appropriate chain size and weight for various applications.
Chain polishing and replacement are crucial aspects of boat anchoring system maintenance. In conclusion, the market is a vital component of the boating industry, with significant growth potential in the Asia Pacific region. Government initiatives, technological advancements, and increasing demand from various industries are driving market expansion. The focus on chain durability, performance, and safety continues to fuel innovation and development in this sector.
Market Dynamics
Our researchers analyzed the data with 2024 as the base year, along with the key drivers, trends, and challenges. A holistic analysis of drivers will help companies refine their marketing strategies to gain a competitive advantage.
What are the key market drivers leading to the rise in the adoption of Stainless Steel Anchor Chain Industry?
- The adoption of offshore floating wind turbines serves as the primary catalyst for market growth in this sector.
- The market is experiencing notable growth due to the expanding role of the offshore industry, particularly in the deployment of floating wind turbines. Notably, South Korea and China are leading this trend, with South Korea announcing the formation of a consortium to develop the world's largest floating offshore wind farm, providing a significant power capacity of 6.2 GW. This capacity is equivalent to the output of six nuclear reactors, highlighting the immense potential of this technology in renewable energy generation. Boat type and size are crucial factors influencing the selection of stainless steel anchor chains. Boats used in offshore industries and naval applications require high chain fatigue resistance, longevity, and tensile strength to ensure boat safety during navigation in harsh environments.
- Chain link diameter, elongation, and breaking strength are essential considerations to ensure optimal chain performance and longevity. Chain standards, such as the American Bureau of Shipping (ABS) and the International Maritime Organization (IMO), set guidelines for chain specifications, ensuring safety and interoperability. Stainless steel's corrosion resistance and strength make it the preferred material for anchor chains in various boat hull applications, including recreational boats, commercial vessels, and naval vessels. In conclusion, the increasing adoption of floating wind technology in the offshore industry is driving the growth of the market. The need for high-performance, durable, and reliable chains to ensure boat safety and navigation in challenging environments is a critical market trend.
- Compliance with industry standards and the use of superior materials, such as stainless steel, further underscore the importance of these chains in various boat applications.
What are the market trends shaping the Stainless Steel Anchor Chain Industry?
- Stainless steel production is increasingly focusing on sustainability as the new market trend. This shift prioritizes environmentally friendly practices and efficient resource utilization.
- The market is experiencing a noteworthy evolution, with a focus on sustainable production methods gaining momentum. This shift is primarily driven by stringent environmental regulations and the rising preference for eco-friendly products. A significant development in this sector is the adoption of green hydrogen in stainless steel manufacturing. In March 2024, Jindal Stainless, a leading stainless steel manufacturer in India, introduced the first use of green hydrogen in their production facility. This initiative aligns with global sustainability objectives and India's commitment to attaining net zero carbon emissions. The advanced, fully automated plant, developed in collaboration with a renowned green hydrogen solutions provider, incorporates an advanced alkaline bipolar electrolyzer.
- This innovation in chain manufacturing enhances chain durability and reduces the carbon footprint, ensuring the anchor chain system meets the demands of the marine industry for high chain proof load, impact resistance, and long-term chain maintenance. The integration of green hydrogen in stainless steel manufacturing not only boosts chain production efficiency but also underscores the industry's commitment to sustainability.
What challenges does the Stainless Steel Anchor Chain Industry face during its growth?
- The escalating costs of raw materials pose a significant challenge to the industry's growth trajectory.
- The market experiences significant price fluctuations due to the cost of raw materials, particularly nickel. As a key component of stainless steel, nickel is heavily traded on major exchanges like the London Metal Exchange (LME). In 2024, nickel prices surged to approximately USD16,040 per tonne, rebounding from a four-year low. This increase was primarily driven by concerns over Indonesia, the world's largest nickel producer, tightening its mining policies. The prices of molybdenum and iron ore also significantly impact the cost of stainless steel. Boat owners and the shipping industry rely on stainless steel anchor chains for boat anchoring, boat mooring, and anchor deployment.
- The chain size, weight, and wear resistance are crucial factors in selecting the appropriate anchor chain. Regular chain polishing and timely chain replacement ensure the efficient functioning of the boat anchor system. Despite the challenges posed by raw material prices, the demand for stainless steel anchor chains remains strong due to their durability and marine-grade quality.
Exclusive Customer Landscape
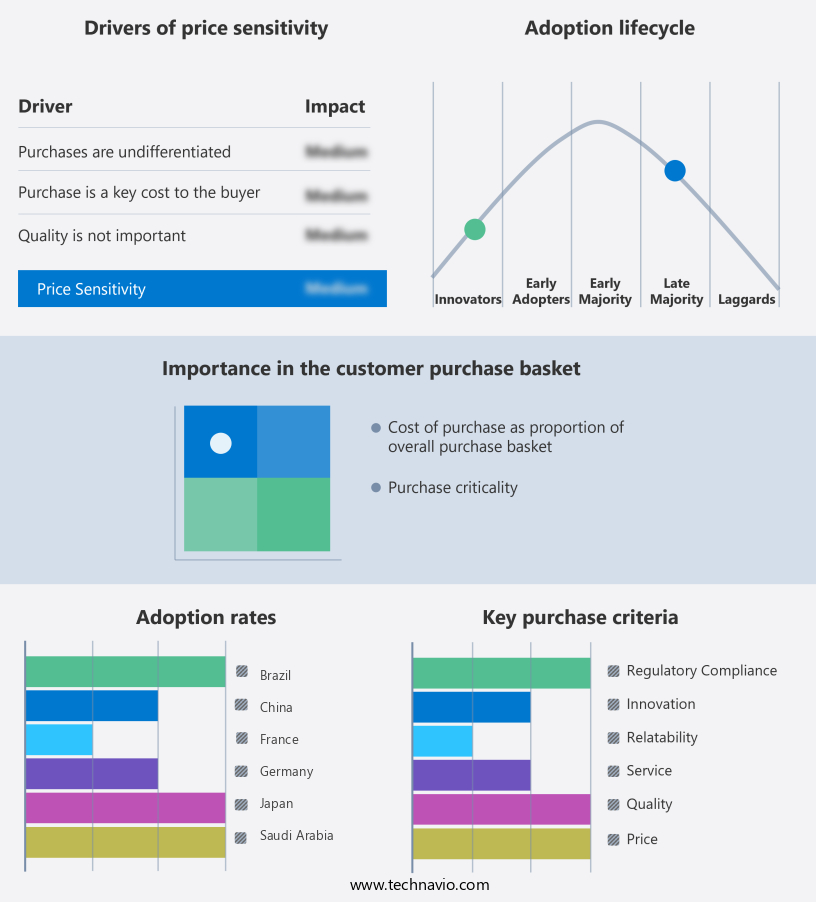
The stainless steel anchor chain market forecasting report includes the adoption lifecycle of the market, covering from the innovator’s stage to the laggard’s stage. It focuses on adoption rates in different regions based on penetration. Furthermore, the stainless steel anchor chain market report also includes key purchase criteria and drivers of price sensitivity to help companies evaluate and develop their market growth analysis strategies.
Customer Landscape
Key Companies & Market Insights
Companies are implementing various strategies, such as strategic alliances, stainless steel anchor chain market forecast, partnerships, mergers and acquisitions, geographical expansion, and product/service launches, to enhance their presence in the industry.
CMP Group Ltd - In our ISO-9001 certified manufacturing facility, we produce top-tier stainless steel anchor chains. Subjected to rigorous proof testing, these chains guarantee enduring quality and superior strength for maritime mooring applications. Engineered for durability, they undergo stringent quality control measures to meet international standards. Our commitment to excellence ensures reliable and long-lasting performance for boaters worldwide.
The industry research and growth report includes detailed analyses of the competitive landscape of the market and information about key companies, including:
- CMP Group Ltd
- DaiHan Anchor Chain Mfg Co Ltd.
- Hamanaka Chain Mfg Co Ltd.
- INDIAN CHAIN Pvt. Ltd.
- Jiangsu Asian Star Anchor Chain Co Ltd
- Ketten Walder GmbH
- Laclede Chain Manufacturing Co. LLC
- Laiwu Steel Group Zibo Anchor Chain Co. Ltd.
- Peerless Industrial Group Inc
- Qingdao Wancheng Anchor Chain Co Ltd
- Ramnas Offshore AB
- Suncor Stainless Inc.
- VICINAY Group
- Wuhan Jiangnan Anchor Chain Co. Ltd.
- ZIBO LONGHAI SHIP EQUIPMENT CO. LTD.
Qualitative and quantitative analysis of companies has been conducted to help clients understand the wider business environment as well as the strengths and weaknesses of key industry players. Data is qualitatively analyzed to categorize companies as pure play, category-focused, industry-focused, and diversified; it is quantitatively analyzed to categorize companies as dominant, leading, strong, tentative, and weak.
Recent Development and News in Stainless Steel Anchor Chain Market
- In March 2023, leading stainless steel anchor chain manufacturer, Galvanex, announced the launch of its new X-Series anchor chain, featuring enhanced strength and durability, with a reported increase in demand by 30% within the first quarter after its release (Galvanex Press Release, 2023). In June 2024, Tenaris and Saipem, two major players in the energy sector, entered into a strategic partnership to develop and manufacture stainless steel anchor chains for offshore wind farms, aiming to capture a significant share in the growing renewable energy market (Tenaris & Saipem Joint Press Release, 2024). In October 2025, Fortune 500 company, Daifuku, completed the acquisition of a leading stainless steel anchor chain supplier, expanding its industrial chain offerings and securing a substantial market position (Daifuku Company Filing, 2025). In January 2026, the European Union introduced new regulations on anchor chain safety standards for maritime transportation, driving demand for high-quality, stainless steel anchor chains and prompting several market players to invest in research and development to meet these new requirements (European Union Regulation, 2026).
Research Analyst Overview
- The market encompasses a diverse range of grades, each with unique properties catering to various applications. Austenitic chains, including chain grade 304 and 316, offer excellent corrosion resistance and are widely used in marine and offshore industries. Chain grade 2205, a high-strength low-alloy grade, is popular in heavy-duty applications. Ferritic chains, such as chain grade certified, exhibit good magnetic properties and are suitable for specific applications. Duplex and Martensitic grades, like chain grade 304L and 316L, offer enhanced strength and corrosion resistance.
- Custom grades, like chain grade special, are engineered to meet specific requirements. Approved chain grades, including 904L and 316, undergo rigorous testing to ensure compliance with industry standards. The market for stainless steel anchor chains continues to evolve, with ongoing research and development leading to the introduction of new grades and innovations.
Dive into Technavio’s robust research methodology, blending expert interviews, extensive data synthesis, and validated models for unparalleled Stainless Steel Anchor Chain Market insights. See full methodology.
|
Market Scope |
|
|
Report Coverage |
Details |
|
Page number |
201 |
|
Base year |
2024 |
|
Historic period |
2019-2023 |
|
Forecast period |
2025-2029 |
|
Growth momentum & CAGR |
Accelerate at a CAGR of 4.6% |
|
Market growth 2025-2029 |
USD 71.21 thousand |
|
Market structure |
Fragmented |
|
YoY growth 2024-2025(%) |
4.2 |
|
Key countries |
China, US, Germany, UK, France, Spain, Japan, South Korea, Saudi Arabia, and Brazil |
|
Competitive landscape |
Leading Companies, Market Positioning of Companies, Competitive Strategies, and Industry Risks |
What are the Key Data Covered in this Stainless Steel Anchor Chain Market Research and Growth Report?
- CAGR of the Stainless Steel Anchor Chain industry during the forecast period
- Detailed information on factors that will drive the growth and forecasting between 2025 and 2029
- Precise estimation of the size of the market and its contribution of the industry in focus to the parent market
- Accurate predictions about upcoming growth and trends and changes in consumer behaviour
- Growth of the market across APAC, Europe, North America, Middle East and Africa, and South America
- Thorough analysis of the market’s competitive landscape and detailed information about companies
- Comprehensive analysis of factors that will challenge the stainless steel anchor chain market growth of industry companies
We can help! Our analysts can customize this stainless steel anchor chain market research report to meet your requirements.
 RIA -
RIA - 
