Stool Testing Market Analysis North America, Europe, Asia, Rest of World (ROW) - US, Canada, UK, Germany, China - Size and Forecast 2024-2028

Stool Testing Market Analysis North America, Europe, Asia, Rest of World (ROW) - US, Canada, UK, Germany, China - Size and Forecast 2024-2028

Published: Oct 2023 165 Pages SKU: IRTNTR74310

Market Overview at a Glance

$445.95 Mn
Market Opportunity
5.92%
CAGR
5.41
YoY growth 2023-2024(%)

Stool Testing Market Size 2024-2028

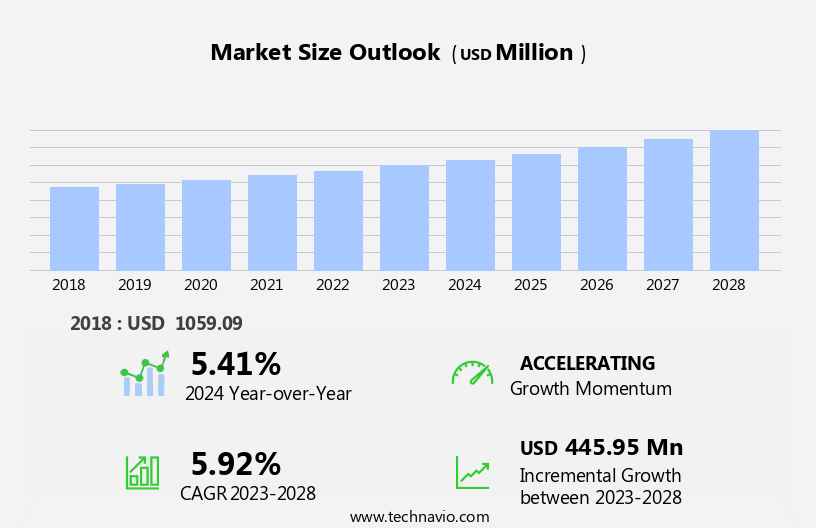
The stool testing market size is forecast to increase by USD 445.95 million at a CAGR of 5.92% between 2023 and 2028.

  • The market is experiencing significant growth due to the increasing prevalence of gastrointestinal (GI) diseases and colorectal cancer worldwide. According to various studies, GI disorders affect millions of people globally, with colorectal cancer being one of the leading causes of cancer-related deaths. This situation has created a high demand for accurate and early diagnosis methods, making stool testing an essential tool in healthcare. Moreover, favorable initiatives from governments and private organizations to increase awareness and accessibility of diagnostic tests, particularly in emerging markets, are expected to boost market growth. However, high treatment costs associated with GI disorders and colorectal cancer pose a significant challenge to market expansion.
  • To capitalize on the market opportunities and navigate these challenges effectively, companies should focus on developing cost-effective testing solutions while ensuring accuracy and reliability. Additionally, partnerships with healthcare providers and insurers can help increase market penetration and patient access to these tests. Overall, the market presents a high growth potential, particularly in emerging markets, and offers significant opportunities for companies to make a positive impact on public health.

What will be the Size of the Stool Testing Market during the forecast period?

Stool Testing Market Size

 Request Free Sample

  • The market encompasses a range of technologies and applications, primarily focused on the analysis of biological samples for diagnostic purposes. Key market dynamics include advances in device performance, such as barrier height engineering and the development of MISFETs, reflective contacts, and ohmic contacts. These innovations contribute to improved specific contact resistivity and Schottky contact performance, enhancing the overall efficiency and accuracy of stool testing devices. High-power electronics, including HEMTs and AlGa/GaN heterostructures, are driving growth in the market due to their increased use in advanced analytical instruments. Ternary alloys, epitaxial growth techniques, and III-nitrides are also gaining traction, as they enable the fabrication of nanostructures and metal-semiconductor contacts with enhanced thermal stability and lattice thermal conductivity.
  • First-principles modeling, quantum confinement, and thermal transport studies are essential in the fundamental properties of stool testing devices, including phonon distributions and thermal properties of n-type and p-type GaN. Transparent contacts and quantum perturbation theory are further advancing the field, offering potential solutions for enhancing device performance and expanding the scope of applications in the market.

How is this Stool Testing Industry segmented?

The stool testing industry research report provides comprehensive data (region-wise segment analysis), with forecasts and estimates in "USD million" for the period 2024-2028, as well as historical data from 2018-2022 for the following segments.
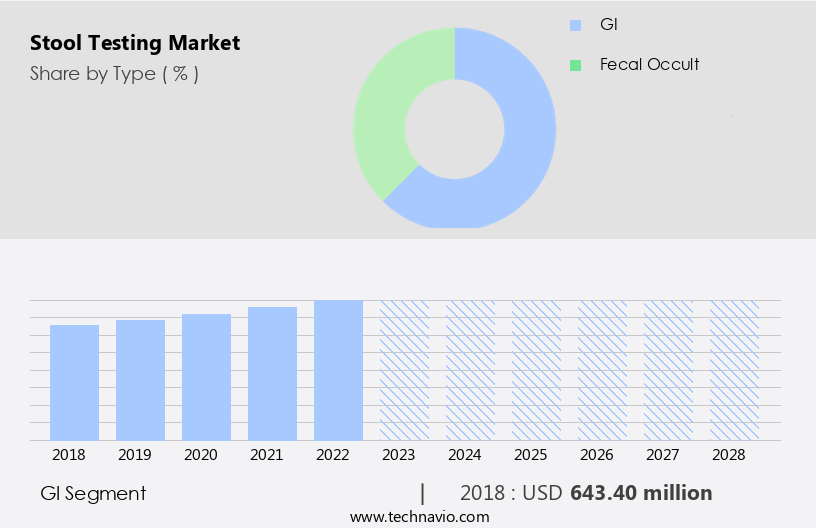
  • Type
    • GI
    • Fecal occult
  • End-user
    • Hospitals
    • Diagnostic centres and laboratories
    • Clinics and others
  • Geography
    • North America
      • US
      • Canada
    • Europe
      • UK
    • Asia
    • Rest of World (ROW)

By Type Insights

The GI segment is estimated to witness significant growth during the forecast period. Stool testing is a diagnostic method used to identify gastrointestinal (GI) disorders by examining the stool for various indicators. This test is essential for detecting pathogens, such as bacteria, viruses, and microorganisms, that can cause GI distress and systemic symptoms. The analysis of stool samples provides insights into digestion efficiency, gut bacterial types, dysbiosis, parasites or worms, and immune system strength. GI disorders that may necessitate stool testing include hemorrhoids, peptic ulcers, esophageal inflammation, diverticulosis and diverticulitis, ulcerative colitis and Crohn's disease, colonic polyps, and potential colon, stomach, or esophageal cancers. Advancements in technology have led to improvements in stool testing, with the integration of Carbon footprint-conscious practices, Radio Frequency (RF) technology, and Power amplifiers in Low-voltage applications.

Schottky Contacts and Metal-Semiconductor Contacts enhance the efficiency of Fast chargers and Light-emitting diodes (LEDs), while Cadence and Ohmic Contacts ensure Electronic designs' stability. High-temperature operation and Terahertz (THz) devices are crucial for enhancing the diagnostic capabilities of stool testing, with First-Principles Modeling and Electrothermal Modeling playing a significant role in the Thermal Properties and Thermal Stability of nanostructures like Ternary Alloys and Quantum Confinement materials. Stool testing applications extend beyond healthcare, with Automotive, Aerospace, data centers, and Industry sectors benefiting from the technology's efficiency and sustainability. Transparent Contacts, P-Type GaN, and Quantum Perturbation Theory are essential for enhancing the performance of Light-Emitting Diodes, High-Power Electronics, and Laser diodes.

Stool testing's environmental friendliness and energy savings make it an attractive solution for various sectors, with a focus on reducing Carbon emissions and improving Energy efficiency. The technology's miniaturization and integration into various applications, such as Sensor Applications and Power supplies, further increase its importance.

Stool Testing Market Size

Get a glance at the market report of share of various segments Request Free Sample

The GI segment was valued at USD 643.40 million in 2018 and showed a gradual increase during the forecast period.

Regional Analysis

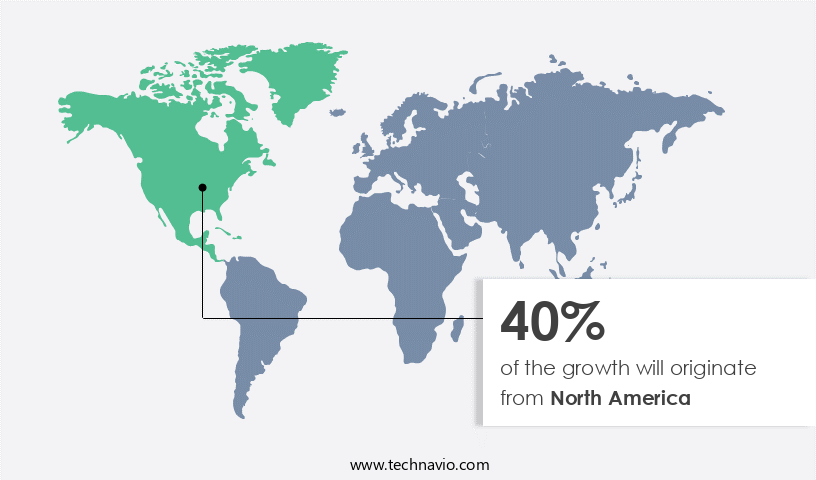
North America is estimated to contribute 40% to the growth of the global market during the forecast period.Technavio's analysts have elaborately explained the regional trends and drivers that shape the market during the forecast period.

Stool Testing Market Share by Geography

For more insights on the market size of various regions, Request Free Sample

The market in North America is experiencing steady growth, driven by the increasing adoption of advanced technologies for the diagnosis and treatment of GI bleeding. This trend is fueled by a high demand for technology, rising prevalence of GI diseases such as stomach, colon, and pancreatic cancer, an aging population, and favorable reimbursement policies for endoscopic procedures. The market expansion is further by the growing presence of major players in the region, committed to developing innovative endoscopic devices. The need for GI bleeding treatment is escalating due to the increasing incidence of chronic diseases, necessitating efficient and effective diagnostic tools.

In the realm of technology, advancements in power amplifiers, Schottky Contacts, and Ohmic Contacts are crucial for enhancing the performance of stool testing devices. These components play a significant role in reducing carbon footprint, improving efficiency, and ensuring thermal stability in high-power electronics. Moreover, the development of Terahertz (THz) devices, Quantum devices, and Light-Emitting Diodes (LEDs) is paving the way for faster charging, higher data transfer rates, and improved energy efficiency in various applications, including data centers, automotive, aerospace, and consumer electronics. First-Principles Modeling and Electrothermal Modeling are essential in designing and optimizing the thermal properties of nanostructures, ternary alloys, and III-Nitrides, ensuring thermal transport, thermal stability, and breakdown field reliability for high-voltage applications.

The market in North America is poised for growth, driven by the increasing need for advanced diagnostic tools, technological advancements, and the commitment of major players to innovation. The focus on sustainability, energy efficiency, and thermal properties will continue to shape the market landscape.

Market Dynamics

Our researchers analyzed the data with 2023 as the base year, along with the key drivers, trends, and challenges. A holistic analysis of drivers will help companies refine their marketing strategies to gain a competitive advantage.

What are the key market drivers leading to the rise in the adoption of Stool Testing Industry?

  • Favorable initiatives and the increasing prevalence of gastrointestinal diseases is the key driver of the market. The market is experiencing significant growth due to the rising incidence of gastrointestinal (GI) diseases. Esophageal and pancreatic cancers, biliary diseases, and Barrett syndrome are among the conditions contributing to market expansion. Additionally, the prevalence of esophageal, colorectal, gastric cancers, and colon polyps is increasing, further fueling market growth. Increased awareness among physicians and patients regarding GI bleeding is another key factor driving market expansion.
  • The increasing burden of chronic GI disorders, such as stomach cancers, has led to rising healthcare costs worldwide. This trend is expected to continue, making stool testing a crucial diagnostic tool in the healthcare industry.

What are the market trends shaping the Stool Testing Industry?

  • High growth potential in emerging markets is the upcoming market trend. The market is experiencing significant growth due to the increasing focus of market companies on emerging economies. These economies offer substantial opportunities for expansion, as they provide access to capital, first-mover advantage, better economic growth, government initiatives, and improved healthcare infrastructure. For instance, in Japan, the government is promoting the adoption of advanced medical devices and procedures in emerging economies by collaborating with companies to spread awareness of their benefits. This strategic approach is enabling companies to expand their reach and generate higher revenue.
  • Additionally, the increasing prevalence of gastrointestinal disorders and the growing awareness of early disease detection are further driving the growth of the market. Market companies are investing in research and development to introduce innovative testing methods and technologies, which is expected to boost market growth in the coming years.

What challenges does the Stool Testing Industry face during its growth?

  • High treatment costs associated with GI disorders and colorectal cancer is a key challenge affecting the industry growth. The market is experiencing continuous expansion, driven by the increasing prevalence of gastrointestinal (GI) disorders and the growing awareness of early disease detection. However, high costs associated with diagnostic tools, such as stool testing kits and treatment for GI bleeding, pose a significant challenge, particularly in price-sensitive markets. Small hospitals and private clinics in both developed and developing economies may forego endoscopic kits due to budget constraints.
  • These devices are expensive and classified as capital items, necessitating extensive procurement procedures and budget allocation considerations. Equipment maintenance further adds to the financial burden for end-users. Despite these challenges, the market's growth is expected to continue, fueled by advancements in technology and growing demand for non-invasive diagnostic methods.

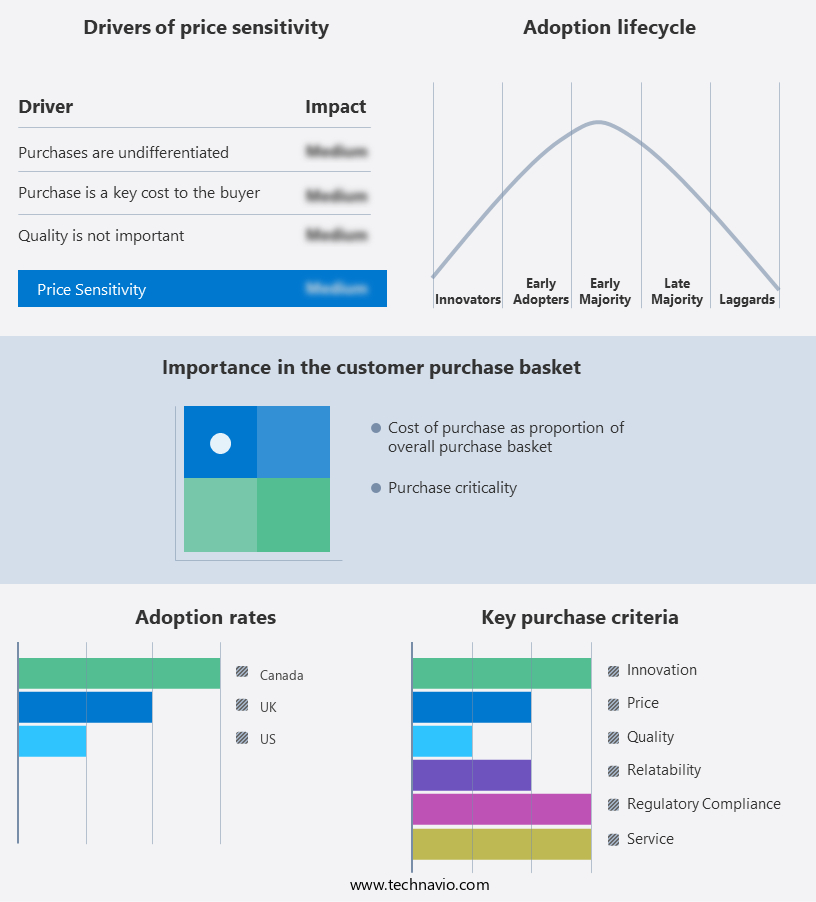
Exclusive Customer Landscape

The stool testing market forecasting report includes the adoption lifecycle of the market, covering from the innovator's stage to the laggard's stage. It focuses on adoption rates in different regions based on penetration. Furthermore, the stool testing market report also includes key purchase criteria and drivers of price sensitivity to help companies evaluate and develop their market growth analysis strategies.

Stool Testing Market Share by Geography

 Customer Landscape

Key Companies & Market Insights

Companies are implementing various strategies, such as strategic alliances, stool testing market forecast, partnerships, mergers and acquisitions, geographical expansion, and product/service launches, to enhance their presence in the industry.

AdvaCare Pharma - The company introduces a cutting-edge stool testing device engineered for efficient sample preparation, enabling nucleic acid extraction of viruses, bacteria, and parasites. This innovative tool enhances laboratory workflows and boosts diagnostic accuracy.

The industry research and growth report includes detailed analyses of the competitive landscape of the market and information about key companies, including:

  • AdvaCare Pharma
  • bioMerieux SA
  • Cardinal Health Inc.
  • Cenogenics Corp.
  • Danaher Corp.
  • DiaSorin SpA
  • Eiken Chemical Co. Ltd.
  • Epitope Diagnostics Inc.
  • Exact Sciences Corp.
  • Genova Diagnostics Inc.
  • Helena Laboratories Corp.
  • Hologic Inc.
  • McKesson Corp.
  • Meridian Bioscience Inc.
  • Pinnacle BioLabs
  • Polymedco CDP LLC
  • Quest Diagnostics Inc.
  • Quidelortho Corp.
  • CTK Biotech Inc.
  • ScheBo Biotech AG

Qualitative and quantitative analysis of companies has been conducted to help clients understand the wider business environment as well as the strengths and weaknesses of key industry players. Data is qualitatively analyzed to categorize companies as pure play, category-focused, industry-focused, and diversified; it is quantitatively analyzed to categorize companies as dominant, leading, strong, tentative, and weak.

Research Analyst Overview

The market encompasses various technologies and applications that focus on improving the efficiency and performance of electronic devices. One significant area of research is the development of power amplifiers for low-voltage applications. These amplifiers are essential in numerous industries, including telecommunications and consumer electronics, where energy efficiency and miniaturization are key priorities. Schottky contacts, a type of contact used in power electronics, have gained attention due to their ability to reduce thermal resistance and enhance device performance. These contacts operate at high frequencies, such as radio frequency (RF), and are crucial in applications requiring fast charging and high-power operation.

In the realm of high-temperature applications, ternary alloys and nanostructures have emerged as potential solutions for thermal properties improvement. These materials exhibit unique electrical and thermal characteristics, enabling the design of quantum confinement structures and quantum devices. First-principles modeling and electrothermal modeling are essential tools in the development of these advanced materials. The quest for energy efficiency and sustainability has led to the exploration of carbon footprint reduction in various industries, including data centers and automotive applications. High-power electronics, such as power supplies and high-voltage applications, are significant contributors to carbon emissions. To address this challenge, researchers are focusing on power conversion technologies, thermal transport, and thermal stability.

Transparent contacts and reflective contacts are gaining popularity in optoelectronics due to their potential to increase the efficiency of light-emitting diodes (LEDs) and laser diodes. These contacts enable the integration of electronic and optical components, leading to miniaturization and improved device performance. The aerospace industry is another sector that benefits from advancements in high-power electronics. The development of high-efficiency power supplies and energy savings technologies is crucial for reducing the weight and improving the performance of aerospace systems. Sustainability is a critical factor in the design of electronic devices, especially in the context of consumer electronics.

Energy efficiency, thermal properties, and thermal stability are essential considerations in the development of these devices. Silicon-based materials continue to be the foundation of electronic designs due to their versatility and cost-effectiveness. High-electron-mobility transistors (HEMTs) and metal-semiconductor field-effect transistors (MISFETs) are essential components in high-power electronics. The optimization of these devices' thermal transient testing and breakdown field properties is crucial for their successful implementation in various applications. The market is a dynamic and diverse field that encompasses various technologies and applications. The focus on energy efficiency, sustainability, and miniaturization is driving the development of advanced materials, power amplifiers, and electronic designs.

The pursuit of high-performance, low-power devices is a common thread in numerous industries, from telecommunications and consumer electronics to aerospace and automotive applications. The ongoing research in this area is expected to yield significant advancements in the near future.

Market Scope

Report Coverage

Details

Page number

165

Base year

2023

Historic period

2018-2022

Forecast period

2024-2028

Growth momentum & CAGR

Accelerate at a CAGR of 5.92%

Market growth 2024-2028

USD 445.95 million

Market structure

Fragmented

YoY growth 2023-2024(%)

5.41

Key countries

US, Canada, and UK

Competitive landscape

Leading Companies, Market Positioning of Companies, Competitive Strategies, and Industry Risks

Request Free Sample

What are the Key Data Covered in this Stool Testing Market Research and Growth Report?

  • CAGR of the Stool Testing industry during the forecast period
  • Detailed information on factors that will drive the growth and forecasting between 2024 and 2028
  • Precise estimation of the size of the market and its contribution of the industry in focus to the parent market
  • Accurate predictions about upcoming growth and trends and changes in consumer behaviour
  • Growth of the market across North America, Europe, Asia, and Rest of World (ROW)
  • Thorough analysis of the market's competitive landscape and detailed information about companies
  • Comprehensive analysis of factors that will challenge the stool testing market growth of industry companies

We can help! Our analysts can customize this stool testing market research report to meet your requirements.

Get in touch

1 Executive Summary

  • 1.1 Market overview
    • Exhibit 01: Executive Summary – Chart on Market Overview
    • Exhibit 02: Executive Summary – Data Table on Market Overview
    • Exhibit 03: Executive Summary – Chart on Global Market Characteristics
    • Exhibit 04: Executive Summary – Chart on Market by Geography
    • Exhibit 05: Executive Summary – Chart on Market Segmentation by Type
    • Exhibit 06: Executive Summary – Chart on Market Segmentation by End-user
    • Exhibit 07: Executive Summary – Chart on Incremental Growth
    • Exhibit 08: Executive Summary – Data Table on Incremental Growth
    • Exhibit 09: Executive Summary – Chart on Vendor Market Positioning

2 Market Landscape

  • 2.1 Market ecosystem
    • Exhibit 10: Parent market
    • Exhibit 11: Market Characteristics

3 Market Sizing

  • 3.1 Market definition
    • Exhibit 12: Offerings of vendors included in the market definition
  • 3.2 Market segment analysis
    • Exhibit 13: Market segments
  • 3.3 Market size 2023
    • 3.4 Market outlook: Forecast for 2023-2028
      • Exhibit 14: Chart on Global - Market size and forecast 2023-2028 ($ million)
      • Exhibit 15: Data Table on Global - Market size and forecast 2023-2028 ($ million)
      • Exhibit 16: Chart on Global Market: Year-over-year growth 2023-2028 (%)
      • Exhibit 17: Data Table on Global Market: Year-over-year growth 2023-2028 (%)

    4 Historic Market Size

    • 4.1 Global stool testing market 2018 - 2022
      • Exhibit 18: Historic Market Size – Data Table on global stool testing market 2018 - 2022 ($ million)
    • 4.2 Type Segment Analysis 2018 - 2022
      • Exhibit 19: Historic Market Size – Type Segment 2018 - 2022 ($ million)
    • 4.3 End-user Segment Analysis 2018 - 2022
      • Exhibit 20: Historic Market Size – End-user Segment 2018 - 2022 ($ million)
    • 4.4 Geography Segment Analysis 2018 - 2022
      • Exhibit 21: Historic Market Size – Geography Segment 2018 - 2022 ($ million)
    • 4.5 Country Segment Analysis 2018 - 2022
      • Exhibit 22: Historic Market Size – Country Segment 2018 - 2022 ($ million)

    5 Five Forces Analysis

    • 5.1 Five forces summary
      • Exhibit 23: Five forces analysis - Comparison between 2023 and 2028
    • 5.2 Bargaining power of buyers
      • Exhibit 24: Chart on Bargaining power of buyers – Impact of key factors 2023 and 2028
    • 5.3 Bargaining power of suppliers
      • Exhibit 25: Bargaining power of suppliers – Impact of key factors in 2023 and 2028
    • 5.4 Threat of new entrants
      • Exhibit 26: Threat of new entrants – Impact of key factors in 2023 and 2028
    • 5.5 Threat of substitutes
      • Exhibit 27: Threat of substitutes – Impact of key factors in 2023 and 2028
    • 5.6 Threat of rivalry
      • Exhibit 28: Threat of rivalry – Impact of key factors in 2023 and 2028
    • 5.7 Market condition
      • Exhibit 29: Chart on Market condition - Five forces 2023 and 2028

    6 Market Segmentation by Type

    • 6.1 Market segments
      • Exhibit 30: Chart on Type - Market share 2023-2028 (%)
      • Exhibit 31: Data Table on Type - Market share 2023-2028 (%)
    • 6.2 Comparison by Type
      • Exhibit 32: Chart on Comparison by Type
      • Exhibit 33: Data Table on Comparison by Type
    • 6.3 GI - Market size and forecast 2023-2028
      • Exhibit 34: Chart on GI - Market size and forecast 2023-2028 ($ million)
      • Exhibit 35: Data Table on GI - Market size and forecast 2023-2028 ($ million)
      • Exhibit 36: Chart on GI - Year-over-year growth 2023-2028 (%)
      • Exhibit 37: Data Table on GI - Year-over-year growth 2023-2028 (%)
    • 6.4 Fecal occult - Market size and forecast 2023-2028
      • Exhibit 38: Chart on Fecal occult - Market size and forecast 2023-2028 ($ million)
      • Exhibit 39: Data Table on Fecal occult - Market size and forecast 2023-2028 ($ million)
      • Exhibit 40: Chart on Fecal occult - Year-over-year growth 2023-2028 (%)
      • Exhibit 41: Data Table on Fecal occult - Year-over-year growth 2023-2028 (%)
    • 6.5 Market opportunity by Type
      • Exhibit 42: Market opportunity by Type ($ million)
      • Exhibit 43: Data Table on Market opportunity by Type ($ million)

    7 Market Segmentation by End-user

    • 7.1 Market segments
      • Exhibit 44: Chart on End-user - Market share 2023-2028 (%)
      • Exhibit 45: Data Table on End-user - Market share 2023-2028 (%)
    • 7.2 Comparison by End-user
      • Exhibit 46: Chart on Comparison by End-user
      • Exhibit 47: Data Table on Comparison by End-user
    • 7.3 Hospitals - Market size and forecast 2023-2028
      • Exhibit 48: Chart on Hospitals - Market size and forecast 2023-2028 ($ million)
      • Exhibit 49: Data Table on Hospitals - Market size and forecast 2023-2028 ($ million)
      • Exhibit 50: Chart on Hospitals - Year-over-year growth 2023-2028 (%)
      • Exhibit 51: Data Table on Hospitals - Year-over-year growth 2023-2028 (%)
    • 7.4 Diagnostic centres and laboratories - Market size and forecast 2023-2028
      • Exhibit 52: Chart on Diagnostic centres and laboratories - Market size and forecast 2023-2028 ($ million)
      • Exhibit 53: Data Table on Diagnostic centres and laboratories - Market size and forecast 2023-2028 ($ million)
      • Exhibit 54: Chart on Diagnostic centres and laboratories - Year-over-year growth 2023-2028 (%)
      • Exhibit 55: Data Table on Diagnostic centres and laboratories - Year-over-year growth 2023-2028 (%)
    • 7.5 Clinics and others - Market size and forecast 2023-2028
      • Exhibit 56: Chart on Clinics and others - Market size and forecast 2023-2028 ($ million)
      • Exhibit 57: Data Table on Clinics and others - Market size and forecast 2023-2028 ($ million)
      • Exhibit 58: Chart on Clinics and others - Year-over-year growth 2023-2028 (%)
      • Exhibit 59: Data Table on Clinics and others - Year-over-year growth 2023-2028 (%)
    • 7.6 Market opportunity by End-user
      • Exhibit 60: Market opportunity by End-user ($ million)
      • Exhibit 61: Data Table on Market opportunity by End-user ($ million)

    8 Customer Landscape

    • 8.1 Customer landscape overview
      • Exhibit 62: Analysis of price sensitivity, lifecycle, customer purchase basket, adoption rates, and purchase criteria

    9 Geographic Landscape

    • 9.1 Geographic segmentation
      • Exhibit 63: Chart on Market share by geography 2023-2028 (%)
      • Exhibit 64: Data Table on Market share by geography 2023-2028 (%)
    • 9.2 Geographic comparison
      • Exhibit 65: Chart on Geographic comparison
      • Exhibit 66: Data Table on Geographic comparison
    • 9.3 North America - Market size and forecast 2023-2028
      • Exhibit 67: Chart on North America - Market size and forecast 2023-2028 ($ million)
      • Exhibit 68: Data Table on North America - Market size and forecast 2023-2028 ($ million)
      • Exhibit 69: Chart on North America - Year-over-year growth 2023-2028 (%)
      • Exhibit 70: Data Table on North America - Year-over-year growth 2023-2028 (%)
    • 9.4 Europe - Market size and forecast 2023-2028
      • Exhibit 71: Chart on Europe - Market size and forecast 2023-2028 ($ million)
      • Exhibit 72: Data Table on Europe - Market size and forecast 2023-2028 ($ million)
      • Exhibit 73: Chart on Europe - Year-over-year growth 2023-2028 (%)
      • Exhibit 74: Data Table on Europe - Year-over-year growth 2023-2028 (%)
    • 9.5 Asia - Market size and forecast 2023-2028
      • Exhibit 75: Chart on Asia - Market size and forecast 2023-2028 ($ million)
      • Exhibit 76: Data Table on Asia - Market size and forecast 2023-2028 ($ million)
      • Exhibit 77: Chart on Asia - Year-over-year growth 2023-2028 (%)
      • Exhibit 78: Data Table on Asia - Year-over-year growth 2023-2028 (%)
    • 9.6 Rest of World (ROW) - Market size and forecast 2023-2028
      • Exhibit 79: Chart on Rest of World (ROW) - Market size and forecast 2023-2028 ($ million)
      • Exhibit 80: Data Table on Rest of World (ROW) - Market size and forecast 2023-2028 ($ million)
      • Exhibit 81: Chart on Rest of World (ROW) - Year-over-year growth 2023-2028 (%)
      • Exhibit 82: Data Table on Rest of World (ROW) - Year-over-year growth 2023-2028 (%)
    • 9.7 US - Market size and forecast 2023-2028
      • Exhibit 83: Chart on US - Market size and forecast 2023-2028 ($ million)
      • Exhibit 84: Data Table on US - Market size and forecast 2023-2028 ($ million)
      • Exhibit 85: Chart on US - Year-over-year growth 2023-2028 (%)
      • Exhibit 86: Data Table on US - Year-over-year growth 2023-2028 (%)
    • 9.8 China - Market size and forecast 2023-2028
      • Exhibit 87: Chart on China - Market size and forecast 2023-2028 ($ million)
      • Exhibit 88: Data Table on China - Market size and forecast 2023-2028 ($ million)
      • Exhibit 89: Chart on China - Year-over-year growth 2023-2028 (%)
      • Exhibit 90: Data Table on China - Year-over-year growth 2023-2028 (%)
    • 9.9 UK - Market size and forecast 2023-2028
      • Exhibit 91: Chart on UK - Market size and forecast 2023-2028 ($ million)
      • Exhibit 92: Data Table on UK - Market size and forecast 2023-2028 ($ million)
      • Exhibit 93: Chart on UK - Year-over-year growth 2023-2028 (%)
      • Exhibit 94: Data Table on UK - Year-over-year growth 2023-2028 (%)
    • 9.10 Germany - Market size and forecast 2023-2028
      • Exhibit 95: Chart on Germany - Market size and forecast 2023-2028 ($ million)
      • Exhibit 96: Data Table on Germany - Market size and forecast 2023-2028 ($ million)
      • Exhibit 97: Chart on Germany - Year-over-year growth 2023-2028 (%)
      • Exhibit 98: Data Table on Germany - Year-over-year growth 2023-2028 (%)
    • 9.11 Canada - Market size and forecast 2023-2028
      • Exhibit 99: Chart on Canada - Market size and forecast 2023-2028 ($ million)
      • Exhibit 100: Data Table on Canada - Market size and forecast 2023-2028 ($ million)
      • Exhibit 101: Chart on Canada - Year-over-year growth 2023-2028 (%)
      • Exhibit 102: Data Table on Canada - Year-over-year growth 2023-2028 (%)
    • 9.12 Market opportunity by geography
      • Exhibit 103: Market opportunity by geography ($ million)
      • Exhibit 104: Data Tables on Market opportunity by geography ($ million)

    10 Drivers, Challenges, and Trends

    • 10.1 Market drivers
      • 10.2 Market challenges
        • 10.3 Impact of drivers and challenges
          • Exhibit 105: Impact of drivers and challenges in 2023 and 2028
        • 10.4 Market trends

          11 Vendor Landscape

          • 11.1 Overview
            • 11.2 Vendor landscape
              • Exhibit 106: Overview on Criticality of inputs and Factors of differentiation
            • 11.3 Landscape disruption
              • Exhibit 107: Overview on factors of disruption
            • 11.4 Industry risks
              • Exhibit 108: Impact of key risks on business

            12 Vendor Analysis

            • 12.1 Vendors covered
              • Exhibit 109: Vendors covered
            • 12.2 Market positioning of vendors
              • Exhibit 110: Matrix on vendor position and classification
            • 12.3 bioMerieux SA
              • Exhibit 111: bioMerieux SA - Overview
              • Exhibit 112: bioMerieux SA - Product / Service
              • Exhibit 113: bioMerieux SA - Key news
              • Exhibit 114: bioMerieux SA - Key offerings
            • 12.4 Cardinal Health Inc.
              • Exhibit 115: Cardinal Health Inc. - Overview
              • Exhibit 116: Cardinal Health Inc. - Business segments
              • Exhibit 117: Cardinal Health Inc. - Key news
              • Exhibit 118: Cardinal Health Inc. - Key offerings
              • Exhibit 119: Cardinal Health Inc. - Segment focus
            • 12.5 Cenogenics Corp.
              • Exhibit 120: Cenogenics Corp. - Overview
              • Exhibit 121: Cenogenics Corp. - Product / Service
              • Exhibit 122: Cenogenics Corp. - Key offerings
            • 12.6 CTK Biotech Inc.
              • Exhibit 123: CTK Biotech Inc. - Overview
              • Exhibit 124: CTK Biotech Inc. - Product / Service
              • Exhibit 125: CTK Biotech Inc. - Key offerings
            • 12.7 Danaher Corp.
              • Exhibit 126: Danaher Corp. - Overview
              • Exhibit 127: Danaher Corp. - Business segments
              • Exhibit 128: Danaher Corp. - Key news
              • Exhibit 129: Danaher Corp. - Key offerings
              • Exhibit 130: Danaher Corp. - Segment focus
            • 12.8 DiaSorin SpA
              • Exhibit 131: DiaSorin SpA - Overview
              • Exhibit 132: DiaSorin SpA - Business segments
              • Exhibit 133: DiaSorin SpA - Key news
              • Exhibit 134: DiaSorin SpA - Key offerings
              • Exhibit 135: DiaSorin SpA - Segment focus
            • 12.9 Eiken Chemical Co. Ltd.
              • Exhibit 136: Eiken Chemical Co. Ltd. - Overview
              • Exhibit 137: Eiken Chemical Co. Ltd. - Product / Service
              • Exhibit 138: Eiken Chemical Co. Ltd. - Key offerings
            • 12.10 Epitope Diagnostics Inc.
              • Exhibit 139: Epitope Diagnostics Inc. - Overview
              • Exhibit 140: Epitope Diagnostics Inc. - Product / Service
              • Exhibit 141: Epitope Diagnostics Inc. - Key offerings
            • 12.11 Genova Diagnostics Inc.
              • Exhibit 142: Genova Diagnostics Inc. - Overview
              • Exhibit 143: Genova Diagnostics Inc. - Product / Service
              • Exhibit 144: Genova Diagnostics Inc. - Key offerings
            • 12.12 Helena Laboratories Corp.
              • Exhibit 145: Helena Laboratories Corp. - Overview
              • Exhibit 146: Helena Laboratories Corp. - Product / Service
              • Exhibit 147: Helena Laboratories Corp. - Key offerings
            • 12.13 Hologic Inc.
              • Exhibit 148: Hologic Inc. - Overview
              • Exhibit 149: Hologic Inc. - Business segments
              • Exhibit 150: Hologic Inc. - Key news
              • Exhibit 151: Hologic Inc. - Key offerings
              • Exhibit 152: Hologic Inc. - Segment focus
            • 12.14 McKesson Corp.
              • Exhibit 153: McKesson Corp. - Overview
              • Exhibit 154: McKesson Corp. - Business segments
              • Exhibit 155: McKesson Corp. - Key offerings
              • Exhibit 156: McKesson Corp. - Segment focus
            • 12.15 Meridian Bioscience Inc.
              • Exhibit 157: Meridian Bioscience Inc. - Overview
              • Exhibit 158: Meridian Bioscience Inc. - Business segments
              • Exhibit 159: Meridian Bioscience Inc. - Key offerings
              • Exhibit 160: Meridian Bioscience Inc. - Segment focus
            • 12.16 Quidelortho Corp.
              • Exhibit 161: Quidelortho Corp. - Overview
              • Exhibit 162: Quidelortho Corp. - Product / Service
              • Exhibit 163: Quidelortho Corp. - Key offerings
            • 12.17 ScheBo Biotech AG
              • Exhibit 164: ScheBo Biotech AG - Overview
              • Exhibit 165: ScheBo Biotech AG - Product / Service
              • Exhibit 166: ScheBo Biotech AG - Key offerings

            13 Appendix

            • 13.1 Scope of the report
              • 13.2 Inclusions and exclusions checklist
                • Exhibit 167: Inclusions checklist
                • Exhibit 168: Exclusions checklist
              • 13.3 Currency conversion rates for US$
                • Exhibit 169: Currency conversion rates for US$
              • 13.4 Research methodology
                • Exhibit 170: Research methodology
                • Exhibit 171: Validation techniques employed for market sizing
                • Exhibit 172: Information sources
              • 13.5 List of abbreviations
                • Exhibit 173: List of abbreviations

              Research Methodology

              Technavio presents a detailed picture of the market by way of study, synthesis, and summation of data from multiple sources. The analysts have presented the various facets of the market with a particular focus on identifying the key industry influencers. The data thus presented is comprehensive, reliable, and the result of extensive research, both primary and secondary.

              INFORMATION SOURCES

              Primary sources

              • Manufacturers and suppliers
              • Channel partners
              • Industry experts
              • Strategic decision makers

              Secondary sources

              • Industry journals and periodicals
              • Government data
              • Financial reports of key industry players
              • Historical data
              • Press releases

              DATA ANALYSIS

              Data Synthesis

              • Collation of data
              • Estimation of key figures
              • Analysis of derived insights

              Data Validation

              • Triangulation with data models
              • Reference against proprietary databases
              • Corroboration with industry experts

              REPORT WRITING

              Qualitative

              • Market drivers
              • Market challenges
              • Market trends
              • Five forces analysis

              Quantitative

              • Market size and forecast
              • Market segmentation
              • Geographical insights
              • Competitive landscape

              Interested in this report?

              Get your sample now to see our research methodology and insights!

              Download Now

              Frequently Asked Questions

              Stool Testing market growth will increase by $ 445.95 mn during 2024-2028.

              The Stool Testing market is expected to grow at a CAGR of 5.92% during 2024-2028.

              Stool Testing market is segmented by Type( GI, Fecal occult) End-user( Hospitals, Diagnostic centres and laboratories, Clinics and others, Rest of World (ROW))

              AdvaCare Pharma, bioMerieux SA, Cardinal Health Inc., Cenogenics Corp., Danaher Corp., DiaSorin SpA, Eiken Chemical Co. Ltd., Epitope Diagnostics Inc., Exact Sciences Corp., Genova Diagnostics Inc., Helena Laboratories Corp., Hologic Inc., McKesson Corp., Meridian Bioscience Inc., Pinnacle BioLabs, Polymedco CDP LLC, Quest Diagnostics Inc., Quidelortho Corp., CTK Biotech Inc., ScheBo Biotech AG are a few of the key vendors in the Stool Testing market.

              North America will register the highest growth rate of 40% among the other regions. Therefore, the Stool Testing market in North America is expected to garner significant business opportunities for the vendors during the forecast period.

              US, Canada, UK

              • Favorable initiatives and the increasing prevalence of gastrointestinal diseasesThe global stool testing market is driven by an increase in the number of patients with gastrointestinal diseases. The growing incidence of diseases such as esophageal or pancreatic cancers is the driving factor this market.
              • biliary diseases is the driving factor this market.
              • and Barrett syndrome is expected to drive the growth of the market in focus. Furthermore is the driving factor this market.
              • the increasing prevalence of esophageal is the driving factor this market.
              • colorectal is the driving factor this market.
              • gastric cancers and colon polyps will augment the growth of the global Stool testing market. Similarly is the driving factor this market.
              • awareness about GI bleeding among physicians and patients has increased over the last few years. The increase in the prevalence of several varieties of chronic gastrointestinal disorders is the driving factor this market.
              • such as stomach cancers is the driving factor this market.
              • has led to a rise in healthcare costs globally. To reduce the economic burden on citizens is the driving factor this market.
              • various countries such as the US is the driving factor this market.
              • Germany is the driving factor this market.
              • and the UK have implemented screening initiatives. If detected at an early stage is the driving factor this market.
              • gastrointestinal diseases can be treated completely and thus decrease the psychological and financial burden on patients and the healthcare system. Endoscopic devices aid in the early detection of cancers is the driving factor this market.
              • leading to their high demand.  Governments is the driving factor this market.
              • private institutions is the driving factor this market.
              • and leading vendors have increased their awareness campaigns for gastrointestinal diseases. For instance is the driving factor this market.
              • Olympus is the driving factor this market.
              • a key market vendor is the driving factor this market.
              • has designated the month of March every year as Colon Cancer Awareness Month and organizes various awareness programs. Thus is the driving factor this market.
              • the growing public awareness of the risks of gastrointestinal diseases and the benefit of early treatment is expected to boost the growth of the global stool testing market during the forecast period. is the driving factor this market.

              The Stool Testing market vendors should focus on grabbing business opportunities from the GI segment as it accounted for the largest market share in the base year.