Strain Gauges Market Analysis APAC, North America, Europe, Middle East and Africa, South America - US, China, Germany, Japan, Brazil - Size and Forecast 2024-2028

Strain Gauges Market Analysis APAC, North America, Europe, Middle East and Africa, South America - US, China, Germany, Japan, Brazil - Size and Forecast 2024-2028

Published: Aug 2024 181 Pages SKU: IRTNTR44814

Market Overview at a Glance

$87 Mn
Market Opportunity
3.62%
CAGR
3.45
YoY growth 2023-2024(%)

Strain Gauges Market Size 2024-2028

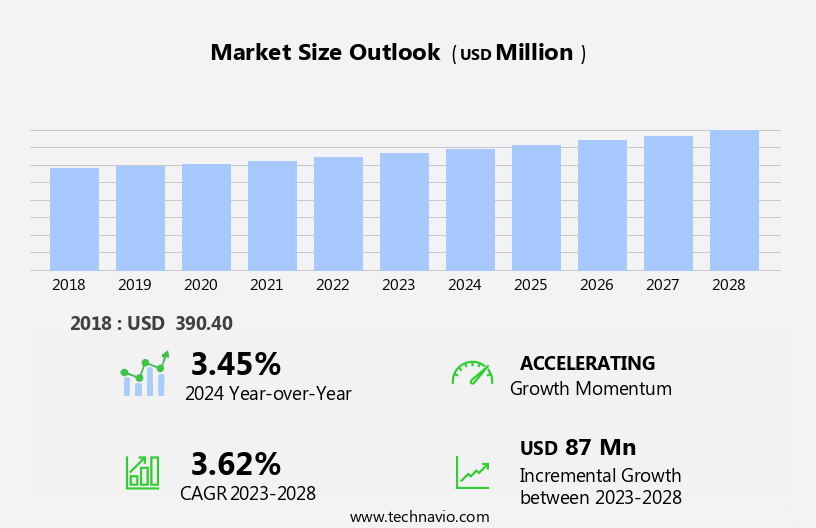
The strain gauges market size is forecast to increase by USD 87 million, at a CAGR of 3.62% between 2023 and 2028.

  • The market is experiencing significant growth due to the increasing demand for these devices in field testing and stress and strain analysis applications. Advancements in material science and nanotechnology are driving innovation, enabling the development of more precise and reliable strain gauges. However, the market's highly fragmented nature poses a challenge for both new and established players. Companies must navigate intense competition and differentiate themselves through product innovation, quality, and customer service to capture market share. To capitalize on opportunities, businesses should focus on developing advanced strain gauges for various industries, including automotive, aerospace, and construction, where accurate stress analysis is crucial.
  • Additionally, partnerships and collaborations with research institutions and technology providers can help companies stay at the forefront of technological advancements and maintain a competitive edge.

What will be the Size of the Strain Gauges Market during the forecast period?

Strain Gauges Market Size

Explore in-depth regional segment analysis with market size data - historical 2018-2022 and forecasts 2024-2028 - in the full report.  
Request Free Sample

The strain gauge market continues to evolve, driven by the ever-expanding applications in various sectors. Inductive sensors and non-destructive testing (NDT) are prominent areas of growth, with a focus on enhancing vibration resistance and improving measurement accuracy. Rise time and settling time are crucial factors in ensuring long-term stability for these applications. In civil engineering, bonded strain gauges and load cells are essential components in monitoring structures and assessing load capacities. Signal conditioning plays a vital role in optimizing output signals, while overload protection and environmental sealing are necessary for industrial automation and control systems.

Semiconductor strain gauges offer temperature ranges and measurement ranges suitable for diverse applications, from piezoresistive sensors to torque sensors. Zero shift and zero-based output are essential for maintaining accuracy in these sensors. The market dynamics are continuously unfolding, with ongoing research and development in areas such as short-term stability, temperature compensation, and shock resistance. Analog-to-digital converters (ADCs) and response time are critical factors in enhancing the performance of these sensors. Capacitive sensors and foil strain gauges are alternative solutions that cater to specific applications, offering advantages such as high sensitivity and ease of use. The integration of unbonded strain gauges and optical sensors expands the market's reach, providing solutions for various industries.

The market's continuous evolution is underpinned by the need for advanced measurement technology and the increasing demand for reliable and accurate data in various sectors. The future holds exciting possibilities for innovation and growth in the strain gauge market.

How is this Strain Gauges Industry segmented?

The strain gauges industry research report provides comprehensive data (region-wise segment analysis), with forecasts and estimates in "USD million" for the period 2024-2028, as well as historical data from 2018-2022 for the following segments.

  • Application
    • Force and torque measurement
    • Weighing and lifting equipment
    • Field testing
    • Aerospace and defense
    • Others
  • Type
    • Quarter bridge strain gauge
    • Strain gauge rosettes
    • Piezoresistor
  • Geography
    • North America
      • US
    • Europe
      • Germany
    • APAC
      • China
      • Japan
    • South America
      • Brazil
    • Rest of World (ROW)

    By Application Insights

    The force and torque measurement segment is estimated to witness significant growth during the forecast period.

    Strain gauges are essential sensors in various industries, including civil engineering and industrial automation, for measuring force and torque. These sensors operate based on the principle of the Whestone bridge and the strain response of semiconductor materials. The signal-to-noise ratio (SNR) and zero shift are crucial factors in ensuring accurate measurements. Analog-to-digital converters (ADCs) and signal conditioning systems are used to process the electrical output signals. Semiconductor strain gauges offer high sensitivity, with temperature compensation and long-term stability. Capacitive and inductive sensors are alternative technologies, each with unique advantages. Non-destructive testing (NDT) is a common application, ensuring the integrity of structures and machinery.

    Vibration resistance and shock resistance are essential features for sensors in harsh environments. Load cells and strain gauge rosettes are common force sensors, converting mechanical force into an electrical signal. Torque sensors are crucial in measuring rotational force, particularly in automotive and industrial applications. Proper calibration and overload protection are essential to ensure reliable and accurate measurements. Pressure sensors, temperature sensors, and output signals are essential components in various industrial control systems. Environmental sealing and operating temperature considerations are crucial for sensors in extreme conditions. Piezoresistive sensors and unbonded strain gauges offer unique advantages in specific applications. In summary, strain gauges play a vital role in measuring force and torque in various industries.

    The sensors' design, calibration, and integration into systems, such as load cells and torque sensors, are crucial to ensure accurate and reliable measurements. Proper consideration of factors like SNR, temperature range, measurement range, and zero shift is essential for selecting the appropriate sensor technology.

    Strain Gauges Market Size

    Request Free Sample

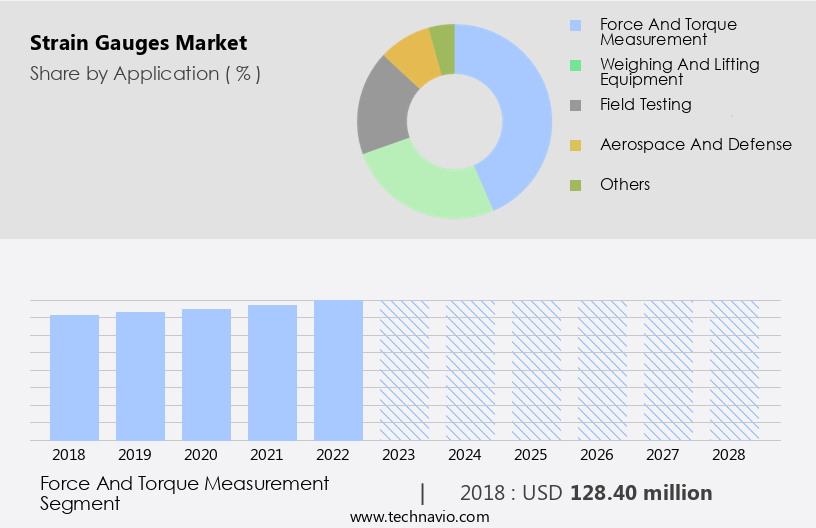
    The Force and torque measurement segment was valued at USD 128.40 million in 2018 and showed a gradual increase during the forecast period.

    Regional Analysis

    APAC is estimated to contribute 42% to the growth of the global market during the forecast period.Technavio’s analysts have elaborately explained the regional trends and drivers that shape the market during the forecast period.

    Strain Gauges Market Share by Geography

     Request Free Sample

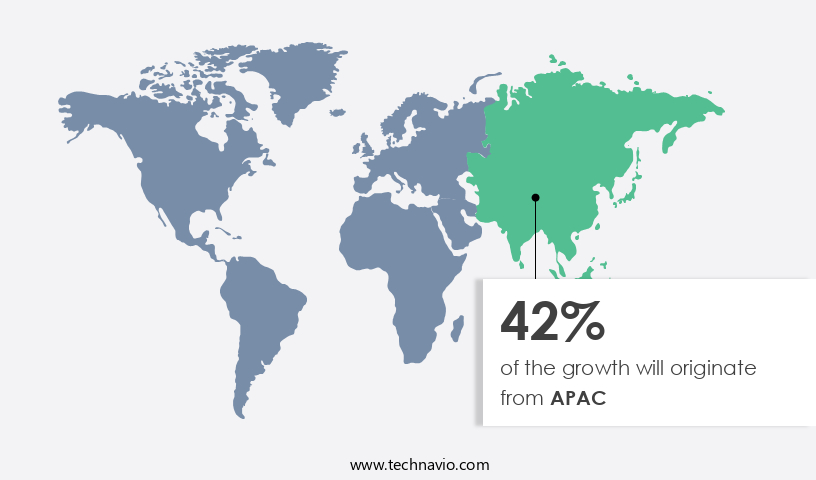
    The market is witnessing significant growth, particularly in the APAC region. This expansion is attributed to the region's substantial investments in industries such as power generation, oil and gas, chemical, and petrochemical. With the highest number of large infrastructure projects, China, India, and Indonesia are major contributors to this growth. As a manufacturing hub and market for aerospace and defense equipment, the demand for strain gauges in APAC is high. Strain gauges, an essential component in various industries, offer benefits such as high accuracy, reliability, and versatility. These sensors are used in various applications, including non-destructive testing (NDT), civil engineering, industrial automation, and vibration resistance.

    Semiconductor strain gauges, piezoresistive sensors, and foil strain gauges are popular types used for measuring strain, pressure, torque, and temperature. Signal conditioning, zero shift, and temperature compensation are crucial factors ensuring accurate measurements. Response time, settling time, and shock resistance are essential for applications requiring real-time monitoring. Long-term stability, overload protection, and environmental sealing are essential for ensuring durability and reliability. Analog-to-digital converters (ADCs) and signal-to-noise ratio (SNR) play a significant role in enhancing the performance of strain gauges. Capacitive sensors and inductive sensors are alternative technologies used in specific applications. Wire strain gauges, load cells, strain gauge rosettes, and bonded strain gauges are various forms of strain gauges used for diverse applications.

    In summary, The market is experiencing substantial growth, driven by the increasing demand from various industries in the APAC region. The market's evolution is characterized by advancements in technology, improving performance, and expanding applications.

    Market Dynamics

    Our researchers analyzed the data with 2023 as the base year, along with the key drivers, trends, and challenges. A holistic analysis of drivers will help companies refine their marketing strategies to gain a competitive advantage.

    The market is a dynamic and evolving industry, characterized by continuous innovation and technological advancements. This sector focuses on the production and application of strain gauges, essential components in measuring force, pressure, and deformation. Strain gauge sensors, a key product in this market, are integral to various industries, including automotive, aerospace, and manufacturing. They offer high accuracy, reliability, and versatility, making them indispensable in monitoring and controlling systems. Microelectromechanical systems (MEMS) technology, miniaturization, and wireless connectivity are driving the growth of the market. Applications in structural health monitoring, vibration analysis, and process control further expand its reach. Advanced materials, such as silicon, piezoresistive, and strain gauge foils, are utilized to create high-performance sensors. The market also benefits from increasing research and development efforts, regulatory compliance, and growing demand for smart and connected devices.

    What are the key market drivers leading to the rise in the adoption of Strain Gauges Industry?

    • The market's growth is primarily attributed to the escalating requirement for strain gauges in field testing and stress and strain analysis applications. 

    • Strain gauges are essential components in various industries for measuring strain and stress in structures and machinery. These devices, based on the Wheatstone bridge principle, convert mechanical strain into electrical signals. The signal-to-noise ratio (SNR) and response time are crucial factors in selecting strain gauges for specific applications. Semiconductor strain gauges offer advantages such as high sensitivity, small size, and low power consumption. In the field of civil engineering, buildings and structures undergo regular stress analysis to ensure safety and longevity. Structures near construction sites, railway tracks, and mines require frequent assessments. Strain gauges play a vital role in monitoring the response of bridge cables to overloaded or speeding trucks and measuring displacement.
    • Their high precision and accuracy make them indispensable for stress analysis. Advancements in technology have led to the development of analog-to-digital converters (ADCs) for strain gauge applications. ADCs improve the measurement accuracy and ease data acquisition and processing. Capacitive sensors are also used in conjunction with strain gauges for better performance and extended measurement ranges. The temperature range and measurement range of strain gauges are significant factors in their selection. Zero shift and span shift are other essential considerations for ensuring accurate and reliable strain gauge measurements. With their wide range of applications and the need for precise measurements, the demand for strain gauges continues to grow.

    What are the market trends shaping the Strain Gauges Industry?

    • Advancements in material science and nanotechnology are currently driving market trends. These fields are experiencing significant progress and innovation.

    • Strain gauges have experienced notable advancements due to progressions in material science and nanotechnology. These innovations have resulted in enhanced strain gauge designs, heightened sensitivity, and superior performance. For example, nanotechnology's application in strain gauges using nanomaterials, such as carbon nanotubes, graphene, and nanowires, has led to highly sensitive and lightweight devices. The mechanical and electrical properties of these nanomaterials enable precise strain and deformation detection with exceptional accuracy. This improved sensitivity is crucial in various industries, including microelectromechanical systems (MEMS) and biomedical devices, where long-term stability, vibration resistance, and fast response times are essential.
    • Additionally, advancements in signal conditioning technology have facilitated the use of inductive sensors and non-destructive testing (NDT) applications, further expanding the market's reach. Overall, these advancements have significantly increased the effectiveness and versatility of strain gauges.

    What challenges does the Strain Gauges Industry face during its growth?

    • A highly fragmented market structure poses a significant challenge to the growth and development of the industry. 

    • The market encompasses a multitude of players, both large and small. A significant number of small companies, predominantly located in countries like China and India, manufacture strain gauges. These companies operate from small workshops and are listed on various business-to-business (B2B) marketplaces. Despite their small scale, they offer competitive pricing on strain gauges due to lower manufacturing costs. The manufacturing process for these small companies is less sophisticated compared to established market players. Consequently, their production costs are lower. Strain gauges offered by these companies include various types such as strain gauge rosettes, pressure sensors, torque sensors, and wire strain gauges.
    • These components are integral to overload protection systems, control systems, and industrial automation applications that demand shock resistance. Zero-based output and full-scale output are essential specifications for various industries, and these small companies cater to these requirements as well. By offering cost-effective solutions, these companies contribute to the market's growth and diversity.

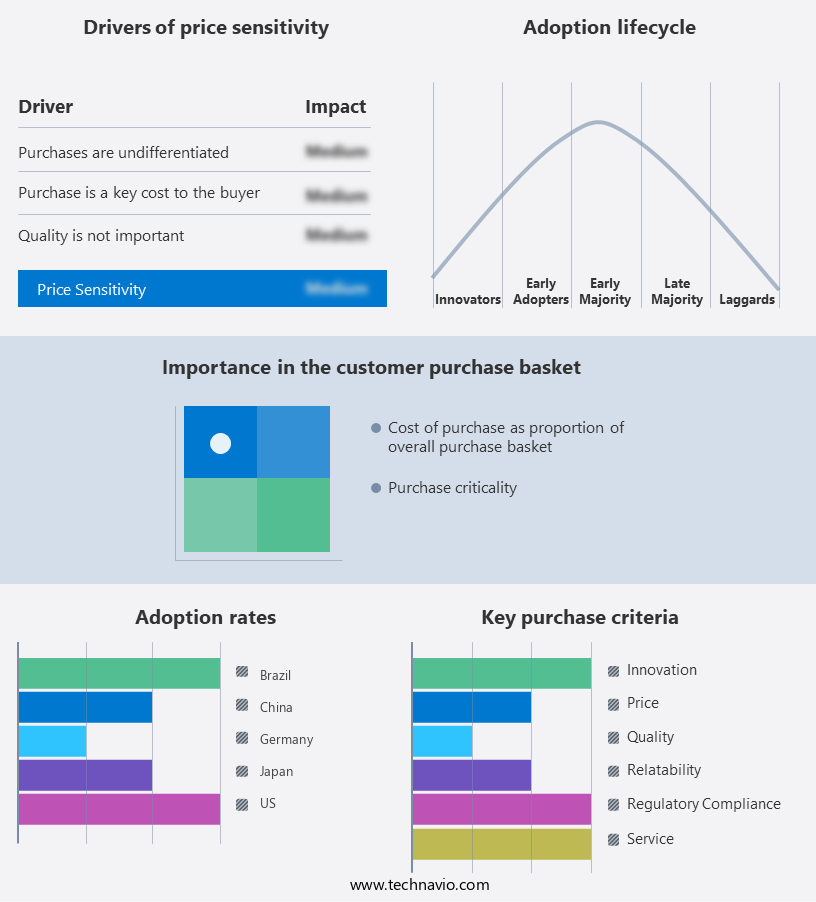
    Exclusive Customer Landscape

    The strain gauges market forecasting report includes the adoption lifecycle of the market, covering from the innovator’s stage to the laggard’s stage. It focuses on adoption rates in different regions based on penetration. Furthermore, the strain gauges market report also includes key purchase criteria and drivers of price sensitivity to help companies evaluate and develop their market growth analysis strategies.

    Strain Gauges Market Share by Geography

     Customer Landscape

    Key Companies & Market Insights

    Companies are implementing various strategies, such as strategic alliances, strain gauges market forecast, partnerships, mergers and acquisitions, geographical expansion, and product/service launches, to enhance their presence in the industry.

    Anyload - This company specializes in providing advanced strain gauge solutions, including ANYLOAD A1A D25 strain gauges and amplifiers. Our offerings deliver precise measurement capabilities, enhancing engineering applications and optimizing performance.

    The industry research and growth report includes detailed analyses of the competitive landscape of the market and information about key companies, including:

    • Anyload
    • BCM SENSOR TECHNOLOGIES bvba
    • FUTEK Advanced Sensor Technology Inc.
    • Guangzhou Electrical Measuring Instruments Factory
    • Hottinger Bruel and Kjaer GmbH
    • Indutrade AB
    • KeLi Sensing Technology Ningbo Co. Ltd.
    • Kistler Group
    • KYOWA ELECTRONIC INSTRUMENTS CO. LTD.
    • Mettler Toledo International Inc.
    • Micron Instruments
    • MinebeaMitsumi Inc.
    • Omega Engineering Inc.
    • Spectris Plc
    • Thames Side Sensors Ltd.
    • Tokyo Measuring Instruments Laboratory Co. Ltd.
    • Vishay Precision Group Inc.
    • Xiamen Loadcell Technology Co. Ltd.
    • Zemic Europe BV
    • Zhejiang Huangyan Testing Apparatus Factory

    Qualitative and quantitative analysis of companies has been conducted to help clients understand the wider business environment as well as the strengths and weaknesses of key industry players. Data is qualitatively analyzed to categorize companies as pure play, category-focused, industry-focused, and diversified; it is quantitatively analyzed to categorize companies as dominant, leading, strong, tentative, and weak.

    Recent Development and News in Strain Gauges Market

    • In January 2024, HBM, a leading manufacturer of measurement and testing solutions, launched its new model of high-precision strain gauges, the HBM 2100 series. These new strain gauges offer improved accuracy and temperature stability, making them suitable for various industries, including automotive, aerospace, and energy (HBM Press Release).
    • In March 2024, Vishay Precision Group, a leading manufacturer of sensor technology, announced a strategic partnership with Sensirion AG, a Swiss sensor manufacturer. This collaboration aimed to expand Vishay's portfolio of strain gauge sensors and strengthen its position in the automotive and industrial markets (Vishay Precision Group Press Release).
    • In May 2024, TE Connectivity, a global industrial technology leader, completed the acquisition of Wurth Electronics Mid-Continent, a leading manufacturer of electronic and electromechanical components. This acquisition expanded TE Connectivity's portfolio of sensor solutions, including strain gauges, and enhanced its presence in the automotive and industrial markets (TE Connectivity Press Release).
    • In April 2025, the European Union (EU) passed the new Measuring Instruments Directive (MID) 2025/211, which sets new requirements for the design, production, and conformity assessment of measuring instruments, including strain gauges. The new regulation aims to improve the accuracy, reliability, and safety of measuring instruments used in various industries within the EU (EU Commission Press Release).

    Research Analyst Overview

    • In the dynamic and evolving the market, various trends and technologies are shaping the industry's future. Strain measurement and displacement measurement continue to be crucial applications, with fatigue life prediction and failure analysis gaining significant attention. Cloud computing and big data analytics enable real-time data processing and remote monitoring, allowing for efficient condition monitoring and system testing. Sensor fusion and sensor integration, including multi-sensor systems and wireless sensors, contribute to enhanced structural integrity assessment. Calibration services and data logging are essential for ensuring accurate force measurement and component testing. High-temperature and high-frequency strain gauges cater to specific industries requiring extreme conditions.
    • Machine learning and artificial intelligence (AI) are revolutionizing stress analysis and custom sensor solutions, while low-power sensor technologies enable extensive distributed sensor networks. Process control and quality control applications benefit from real-time data processing and vibration monitoring. Embedded systems and embedded sensors play a vital role in various industries, ensuring optimal performance and system efficiency.

    Dive into Technavio’s robust research methodology, blending expert interviews, extensive data synthesis, and validated models for unparalleled Strain Gauges Market insights. See full methodology.

    Market Scope

    Report Coverage

    Details

    Page number

    181

    Base year

    2023

    Historic period

    2018-2022

    Forecast period

    2024-2028

    Growth momentum & CAGR

    Accelerate at a CAGR of 3.62%

    Market growth 2024-2028

    USD 87 million

    Market structure

    Fragmented

    YoY growth 2023-2024(%)

    3.45

    Key countries

    US, China, Germany, Japan, and Brazil

    Competitive landscape

    Leading Companies, Market Positioning of Companies, Competitive Strategies, and Industry Risks

    Request Free Sample

    What are the Key Data Covered in this Strain Gauges Market Research and Growth Report?

    • CAGR of the Strain Gauges industry during the forecast period
    • Detailed information on factors that will drive the growth and forecasting between 2024 and 2028
    • Precise estimation of the size of the market and its contribution of the industry in focus to the parent market
    • Accurate predictions about upcoming growth and trends and changes in consumer behaviour
    • Growth of the market across APAC, North America, Europe, Middle East and Africa, and South America
    • Thorough analysis of the market’s competitive landscape and detailed information about companies
    • Comprehensive analysis of factors that will challenge the strain gauges market growth of industry companies

    We can help! Our analysts can customize this strain gauges market research report to meet your requirements.

    Get in touch


    1 Executive Summary

    • 1.1 Market overview
      • Executive Summary - Chart on Market Overview
      • Executive Summary - Data Table on Market Overview
      • Executive Summary - Chart on Global Market Characteristics
      • Executive Summary - Chart on Market by Geography
      • Executive Summary - Chart on Market Segmentation by Application
      • Executive Summary - Chart on Market Segmentation by Type
      • Executive Summary - Chart on Incremental Growth
      • Executive Summary - Data Table on Incremental Growth
      • Executive Summary - Chart on Company Market Positioning

    2 Market Landscape

    • 2.1 Market ecosystem
      • Parent Market
      • Data Table on - Parent Market
    • 2.2 Market characteristics
      • Market characteristics analysis
    • 2.3 Value chain analysis
      • Value Chain Analysis

    3 Market Sizing

    • 3.1 Market definition
      • Offerings of companies included in the market definition
    • 3.2 Market segment analysis
      • Market segments
    • 3.3 Market size 2023
      • 3.4 Market outlook: Forecast for 2023-2028
        • Chart on Global - Market size and forecast 2023-2028 ($ million)
        • Data Table on Global - Market size and forecast 2023-2028 ($ million)
        • Chart on Global Market: Year-over-year growth 2023-2028 (%)
        • Data Table on Global Market: Year-over-year growth 2023-2028 (%)

      4 Historic Market Size

      • 4.1 Global Strain Gauges Market 2018 - 2022
        • Historic Market Size - Data Table on Global Strain Gauges Market 2018 - 2022 ($ million)
      • 4.2 Application segment analysis 2018 - 2022
        • Historic Market Size - Application Segment 2018 - 2022 ($ million)
      • 4.3 Type segment analysis 2018 - 2022
        • Historic Market Size - Type Segment 2018 - 2022 ($ million)
      • 4.4 Geography segment analysis 2018 - 2022
        • Historic Market Size - Geography Segment 2018 - 2022 ($ million)
      • 4.5 Country segment analysis 2018 - 2022
        • Historic Market Size - Country Segment 2018 - 2022 ($ million)

      5 Five Forces Analysis

      • 5.1 Five forces summary
        • Five forces analysis - Comparison between 2023 and 2028
      • 5.2 Bargaining power of buyers
        • Bargaining power of buyers - Impact of key factors 2023 and 2028
      • 5.3 Bargaining power of suppliers
        • Bargaining power of suppliers - Impact of key factors in 2023 and 2028
      • 5.4 Threat of new entrants
        • Threat of new entrants - Impact of key factors in 2023 and 2028
      • 5.5 Threat of substitutes
        • Threat of substitutes - Impact of key factors in 2023 and 2028
      • 5.6 Threat of rivalry
        • Threat of rivalry - Impact of key factors in 2023 and 2028
      • 5.7 Market condition
        • Chart on Market condition - Five forces 2023 and 2028

      6 Market Segmentation by Application

      • 6.1 Market segments
        • Chart on Application - Market share 2023-2028 (%)
        • Data Table on Application - Market share 2023-2028 (%)
      • 6.2 Comparison by Application
        • Chart on Comparison by Application
        • Data Table on Comparison by Application
      • 6.3 Force and torque measurement - Market size and forecast 2023-2028
        • Chart on Force and torque measurement - Market size and forecast 2023-2028 ($ million)
        • Data Table on Force and torque measurement - Market size and forecast 2023-2028 ($ million)
        • Chart on Force and torque measurement - Year-over-year growth 2023-2028 (%)
        • Data Table on Force and torque measurement - Year-over-year growth 2023-2028 (%)
      • 6.4 Weighing and lifting equipment - Market size and forecast 2023-2028
        • Chart on Weighing and lifting equipment - Market size and forecast 2023-2028 ($ million)
        • Data Table on Weighing and lifting equipment - Market size and forecast 2023-2028 ($ million)
        • Chart on Weighing and lifting equipment - Year-over-year growth 2023-2028 (%)
        • Data Table on Weighing and lifting equipment - Year-over-year growth 2023-2028 (%)
      • 6.5 Field testing - Market size and forecast 2023-2028
        • Chart on Field testing - Market size and forecast 2023-2028 ($ million)
        • Data Table on Field testing - Market size and forecast 2023-2028 ($ million)
        • Chart on Field testing - Year-over-year growth 2023-2028 (%)
        • Data Table on Field testing - Year-over-year growth 2023-2028 (%)
      • 6.6 Aerospace and defense - Market size and forecast 2023-2028
        • Chart on Aerospace and defense - Market size and forecast 2023-2028 ($ million)
        • Data Table on Aerospace and defense - Market size and forecast 2023-2028 ($ million)
        • Chart on Aerospace and defense - Year-over-year growth 2023-2028 (%)
        • Data Table on Aerospace and defense - Year-over-year growth 2023-2028 (%)
      • 6.7 Others - Market size and forecast 2023-2028
        • Chart on Others - Market size and forecast 2023-2028 ($ million)
        • Data Table on Others - Market size and forecast 2023-2028 ($ million)
        • Chart on Others - Year-over-year growth 2023-2028 (%)
        • Data Table on Others - Year-over-year growth 2023-2028 (%)
      • 6.8 Market opportunity by Application
        • Market opportunity by Application ($ million)
        • Data Table on Market opportunity by Application ($ million)

      7 Market Segmentation by Type

      • 7.1 Market segments
        • Chart on Type - Market share 2023-2028 (%)
        • Data Table on Type - Market share 2023-2028 (%)
      • 7.2 Comparison by Type
        • Chart on Comparison by Type
        • Data Table on Comparison by Type
      • 7.3 Quarter bridge strain gauge - Market size and forecast 2023-2028
        • Chart on Quarter bridge strain gauge - Market size and forecast 2023-2028 ($ million)
        • Data Table on Quarter bridge strain gauge - Market size and forecast 2023-2028 ($ million)
        • Chart on Quarter bridge strain gauge - Year-over-year growth 2023-2028 (%)
        • Data Table on Quarter bridge strain gauge - Year-over-year growth 2023-2028 (%)
      • 7.4 Strain gauge rosettes - Market size and forecast 2023-2028
        • Chart on Strain gauge rosettes - Market size and forecast 2023-2028 ($ million)
        • Data Table on Strain gauge rosettes - Market size and forecast 2023-2028 ($ million)
        • Chart on Strain gauge rosettes - Year-over-year growth 2023-2028 (%)
        • Data Table on Strain gauge rosettes - Year-over-year growth 2023-2028 (%)
      • 7.5 Piezoresistor - Market size and forecast 2023-2028
        • Chart on Piezoresistor - Market size and forecast 2023-2028 ($ million)
        • Data Table on Piezoresistor - Market size and forecast 2023-2028 ($ million)
        • Chart on Piezoresistor - Year-over-year growth 2023-2028 (%)
        • Data Table on Piezoresistor - Year-over-year growth 2023-2028 (%)
      • 7.6 Market opportunity by Type
        • Market opportunity by Type ($ million)
        • Data Table on Market opportunity by Type ($ million)

      8 Customer Landscape

      • 8.1 Customer landscape overview
        • Analysis of price sensitivity, lifecycle, customer purchase basket, adoption rates, and purchase criteria

      9 Geographic Landscape

      • 9.1 Geographic segmentation
        • Chart on Market share by geography 2023-2028 (%)
        • Data Table on Market share by geography 2023-2028 (%)
      • 9.2 Geographic comparison
        • Chart on Geographic comparison
        • Data Table on Geographic comparison
      • 9.3 APAC - Market size and forecast 2023-2028
        • Chart on APAC - Market size and forecast 2023-2028 ($ million)
        • Data Table on APAC - Market size and forecast 2023-2028 ($ million)
        • Chart on APAC - Year-over-year growth 2023-2028 (%)
        • Data Table on APAC - Year-over-year growth 2023-2028 (%)
      • 9.4 North America - Market size and forecast 2023-2028
        • Chart on North America - Market size and forecast 2023-2028 ($ million)
        • Data Table on North America - Market size and forecast 2023-2028 ($ million)
        • Chart on North America - Year-over-year growth 2023-2028 (%)
        • Data Table on North America - Year-over-year growth 2023-2028 (%)
      • 9.5 Europe - Market size and forecast 2023-2028
        • Chart on Europe - Market size and forecast 2023-2028 ($ million)
        • Data Table on Europe - Market size and forecast 2023-2028 ($ million)
        • Chart on Europe - Year-over-year growth 2023-2028 (%)
        • Data Table on Europe - Year-over-year growth 2023-2028 (%)
      • 9.6 Middle East and Africa - Market size and forecast 2023-2028
        • Chart on Middle East and Africa - Market size and forecast 2023-2028 ($ million)
        • Data Table on Middle East and Africa - Market size and forecast 2023-2028 ($ million)
        • Chart on Middle East and Africa - Year-over-year growth 2023-2028 (%)
        • Data Table on Middle East and Africa - Year-over-year growth 2023-2028 (%)
      • 9.7 South America - Market size and forecast 2023-2028
        • Chart on South America - Market size and forecast 2023-2028 ($ million)
        • Data Table on South America - Market size and forecast 2023-2028 ($ million)
        • Chart on South America - Year-over-year growth 2023-2028 (%)
        • Data Table on South America - Year-over-year growth 2023-2028 (%)
      • 9.8 US - Market size and forecast 2023-2028
        • Chart on US - Market size and forecast 2023-2028 ($ million)
        • Data Table on US - Market size and forecast 2023-2028 ($ million)
        • Chart on US - Year-over-year growth 2023-2028 (%)
        • Data Table on US - Year-over-year growth 2023-2028 (%)
      • 9.9 China - Market size and forecast 2023-2028
        • Chart on China - Market size and forecast 2023-2028 ($ million)
        • Data Table on China - Market size and forecast 2023-2028 ($ million)
        • Chart on China - Year-over-year growth 2023-2028 (%)
        • Data Table on China - Year-over-year growth 2023-2028 (%)
      • 9.10 Germany - Market size and forecast 2023-2028
        • Chart on Germany - Market size and forecast 2023-2028 ($ million)
        • Data Table on Germany - Market size and forecast 2023-2028 ($ million)
        • Chart on Germany - Year-over-year growth 2023-2028 (%)
        • Data Table on Germany - Year-over-year growth 2023-2028 (%)
      • 9.11 Japan - Market size and forecast 2023-2028
        • Chart on Japan - Market size and forecast 2023-2028 ($ million)
        • Data Table on Japan - Market size and forecast 2023-2028 ($ million)
        • Chart on Japan - Year-over-year growth 2023-2028 (%)
        • Data Table on Japan - Year-over-year growth 2023-2028 (%)
      • 9.12 Brazil - Market size and forecast 2023-2028
        • Chart on Brazil - Market size and forecast 2023-2028 ($ million)
        • Data Table on Brazil - Market size and forecast 2023-2028 ($ million)
        • Chart on Brazil - Year-over-year growth 2023-2028 (%)
        • Data Table on Brazil - Year-over-year growth 2023-2028 (%)
      • 9.13 Market opportunity by geography
        • Market opportunity by geography ($ million)
        • Data Tables on Market opportunity by geography ($ million)

      10 Drivers, Challenges, and Opportunity/Restraints

      • 10.1 Market drivers
        • 10.2 Market challenges
          • 10.3 Impact of drivers and challenges
            • Impact of drivers and challenges in 2023 and 2028
          • 10.4 Market opportunities/restraints

            11 Competitive Landscape

            • 11.1 Overview
              • 11.2 Competitive Landscape
                • Overview on criticality of inputs and factors of differentiation
              • 11.3 Landscape disruption
                • Overview on factors of disruption
              • 11.4 Industry risks
                • Impact of key risks on business

              12 Competitive Analysis

              • 12.1 Companies profiled
                • Companies covered
              • 12.2 Market positioning of companies
                • Matrix on companies position and classification
              • 12.3 Anyload
                • Anyload - Overview
                • Anyload - Product / Service
                • Anyload - Key offerings
              • 12.4 BCM SENSOR TECHNOLOGIES bvba
                • BCM SENSOR TECHNOLOGIES bvba - Overview
                • BCM SENSOR TECHNOLOGIES bvba - Product / Service
                • BCM SENSOR TECHNOLOGIES bvba - Key offerings
              • 12.5 Guangzhou Electrical Measuring Instruments Factory
                • Guangzhou Electrical Measuring Instruments Factory - Overview
                • Guangzhou Electrical Measuring Instruments Factory - Product / Service
                • Guangzhou Electrical Measuring Instruments Factory - Key offerings
              • 12.6 Hottinger Bruel and Kjaer GmbH
                • Hottinger Bruel and Kjaer GmbH - Overview
                • Hottinger Bruel and Kjaer GmbH - Product / Service
                • Hottinger Bruel and Kjaer GmbH - Key offerings
              • 12.7 Indutrade AB
                • Indutrade AB - Overview
                • Indutrade AB - Business segments
                • Indutrade AB - Key offerings
                • Indutrade AB - Segment focus
              • 12.8 KeLi Sensing Technology Ningbo Co. Ltd.
                • KeLi Sensing Technology Ningbo Co. Ltd. - Overview
                • KeLi Sensing Technology Ningbo Co. Ltd. - Product / Service
                • KeLi Sensing Technology Ningbo Co. Ltd. - Key offerings
              • 12.9 KYOWA ELECTRONIC INSTRUMENTS CO. LTD.
                • KYOWA ELECTRONIC INSTRUMENTS CO. LTD. - Overview
                • KYOWA ELECTRONIC INSTRUMENTS CO. LTD. - Product / Service
                • KYOWA ELECTRONIC INSTRUMENTS CO. LTD. - Key offerings
              • 12.10 Mettler Toledo International Inc.
                • Mettler Toledo International Inc. - Overview
                • Mettler Toledo International Inc. - Business segments
                • Mettler Toledo International Inc. - Key news
                • Mettler Toledo International Inc. - Key offerings
                • Mettler Toledo International Inc. - Segment focus
              • 12.11 MinebeaMitsumi Inc.
                • MinebeaMitsumi Inc. - Overview
                • MinebeaMitsumi Inc. - Business segments
                • MinebeaMitsumi Inc. - Key offerings
                • MinebeaMitsumi Inc. - Segment focus
              • 12.12 Omega Engineering Inc.
                • Omega Engineering Inc. - Overview
                • Omega Engineering Inc. - Product / Service
                • Omega Engineering Inc. - Key offerings
              • 12.13 Tokyo Measuring Instruments Laboratory Co. Ltd.
                • Tokyo Measuring Instruments Laboratory Co. Ltd. - Overview
                • Tokyo Measuring Instruments Laboratory Co. Ltd. - Product / Service
                • Tokyo Measuring Instruments Laboratory Co. Ltd. - Key offerings
              • 12.14 Vishay Precision Group Inc.
                • Vishay Precision Group Inc. - Overview
                • Vishay Precision Group Inc. - Business segments
                • Vishay Precision Group Inc. - Key offerings
                • Vishay Precision Group Inc. - Segment focus
              • 12.15 Xiamen Loadcell Technology Co. Ltd.
                • Xiamen Loadcell Technology Co. Ltd. - Overview
                • Xiamen Loadcell Technology Co. Ltd. - Product / Service
                • Xiamen Loadcell Technology Co. Ltd. - Key offerings
              • 12.16 Zemic Europe BV
                • Zemic Europe BV - Overview
                • Zemic Europe BV - Product / Service
                • Zemic Europe BV - Key offerings
              • 12.17 Zhejiang Huangyan Testing Apparatus Factory
                • Zhejiang Huangyan Testing Apparatus Factory - Overview
                • Zhejiang Huangyan Testing Apparatus Factory - Product / Service
                • Zhejiang Huangyan Testing Apparatus Factory - Key offerings

              13 Appendix

              • 13.1 Scope of the report
                • 13.2 Inclusions and exclusions checklist
                  • Inclusions checklist
                  • Exclusions checklist
                • 13.3 Currency conversion rates for US$
                  • Currency conversion rates for US$
                • 13.4 Research methodology
                  • Research methodology
                • 13.5 Data procurement
                  • Information sources
                • 13.6 Data validation
                  • Data validation
                • 13.7 Validation techniques employed for market sizing
                  • Validation techniques employed for market sizing
                • 13.8 Data synthesis
                  • Data synthesis
                • 13.9 360 degree market analysis
                  • 360 degree market analysis
                • 13.10 List of abbreviations
                  • List of abbreviations

                Research Methodology

                Technavio presents a detailed picture of the market by way of study, synthesis, and summation of data from multiple sources. The analysts have presented the various facets of the market with a particular focus on identifying the key industry influencers. The data thus presented is comprehensive, reliable, and the result of extensive research, both primary and secondary.

                INFORMATION SOURCES

                Primary sources

                • Manufacturers and suppliers
                • Channel partners
                • Industry experts
                • Strategic decision makers

                Secondary sources

                • Industry journals and periodicals
                • Government data
                • Financial reports of key industry players
                • Historical data
                • Press releases

                DATA ANALYSIS

                Data Synthesis

                • Collation of data
                • Estimation of key figures
                • Analysis of derived insights

                Data Validation

                • Triangulation with data models
                • Reference against proprietary databases
                • Corroboration with industry experts

                REPORT WRITING

                Qualitative

                • Market drivers
                • Market challenges
                • Market trends
                • Five forces analysis

                Quantitative

                • Market size and forecast
                • Market segmentation
                • Geographical insights
                • Competitive landscape

                Interested in this report?

                Get your sample now to see our research methodology and insights!

                Download Now

                Frequently Asked Questions

                Strain Gauges market growth will increase by $ 87 mn during 2024-2028.

                The Strain Gauges market is expected to grow at a CAGR of 3.62% during 2024-2028.

                Strain Gauges market is segmented by Application( Force and torque measurement, Weighing and lifting equipment, Field testing, Aerospace and defense, Others) Type( Quarter bridge strain gauge, Strain gauge rosettes, Piezoresistor, MEA, South America)

                Anyload, BCM SENSOR TECHNOLOGIES bvba, FUTEK Advanced Sensor Technology Inc., Guangzhou Electrical Measuring Instruments Factory, Hottinger Bruel and Kjaer GmbH, Indutrade AB, KeLi Sensing Technology Ningbo Co. Ltd., Kistler Group, KYOWA ELECTRONIC INSTRUMENTS CO. LTD., Mettler Toledo International Inc., Micron Instruments, MinebeaMitsumi Inc., Omega Engineering Inc., Spectris Plc, Thames Side Sensors Ltd., Tokyo Measuring Instruments Laboratory Co. Ltd., Vishay Precision Group Inc., Xiamen Loadcell Technology Co. Ltd., Zemic Europe BV, Zhejiang Huangyan Testing Apparatus Factory are a few of the key vendors in the Strain Gauges market.

                APAC will register the highest growth rate of 42% among the other regions. Therefore, the Strain Gauges market in APAC is expected to garner significant business opportunities for the vendors during the forecast period.

                US, China, Germany, Japan, Brazil

                • Increasing demand for strain gauges for field testing and stress and strain analysisStrain gauges are used for field testing of vehicles is the driving factor this market.
                • ships is the driving factor this market.
                • dams is the driving factor this market.
                • and oil drilling equipment. They are also used to measure strain and stress in bridges or buildings and monitor the response of bridge cables to overloaded or speeding trucks is the driving factor this market.
                • and measure displacement. Thus is the driving factor this market.
                • the large number of applications of strain gauges in field testing drives their demand.Stress analysis of several buildings and civil structures is essential. Buildings that are close to construction sites is the driving factor this market.
                • railway tracks is the driving factor this market.
                • and mines require stress analysis at regular intervals. This helps owners (or authorities responsible for the safety of the structure) identify stress levels in critical structural components of buildings. Therefore is the driving factor this market.
                • the possibility of failure of critical structures such as the load-bearing column or foundation is reduced is the driving factor this market.
                • resulting in increased safety of the building and the occupants.Some civil engineering structures is the driving factor this market.
                • such as bridges and tunnels is the driving factor this market.
                • also require routine monitoring of stress levels to check their structural integrity. China and India are the leading countries in the world in terms of the number of ongoing civil engineering projects. Similarly is the driving factor this market.
                • other significant countries with a number of civil engineering projects are Nigeria and South Africa in Africa and Indonesia is the driving factor this market.
                • the Philippines is the driving factor this market.
                • and Thailand in Southeast Asia. Thus is the driving factor this market.
                • there is a growing demand for strain gauges from service providers that conduct stress analyses of buildings and civil structures.The measurement of changes in soil pressure near oil-drilling rigs requires custom-designed strain gauges to capture the changes in pressure distribution. Thus is the driving factor this market.
                • growing investments in the global oil and gas sector also drive the growth of the global strain gauges market.Apart from this is the driving factor this market.
                • strain gauges for stress and strain analysis are also used in the transportation and logistics sector is the driving factor this market.
                • such as in ships is the driving factor this market.
                • aircraft is the driving factor this market.
                • and rails. For instance is the driving factor this market.
                • strain gauges are installed at numerous locations in the structure of an aircraft for the measurement of certain parameters is the driving factor this market.
                • such as wing bending moment. Strain gauges are used for stress analysis of ship hulls and railway lines.Thus is the driving factor this market.
                • the growing procurement of transportation and logistics equipment by service providers will drive the growth of the global strain gauges market during the forecast period. is the driving factor this market.

                The Strain Gauges market vendors should focus on grabbing business opportunities from the Force and torque measurement segment as it accounted for the largest market share in the base year.