Sulfur Recovery Technology Market Analysis, Size, and Forecast 2024-2028: North America (US and Canada), Europe (Germany), APAC (China and Japan), and Rest of World (ROW)

Sulfur Recovery Technology Market Analysis, Size, and Forecast 2024-2028:
North America (US and Canada), Europe (Germany), APAC (China and Japan), and Rest of World (ROW)

Published: Dec 2023 189 Pages SKU: IRTNTR77148

Market Overview at a Glance

$2.77 B
Market Opportunity
9.43%
CAGR
8.98
YoY growth 2023-2024(%)

Sulfur Recovery Technology Market Size 2024-2028

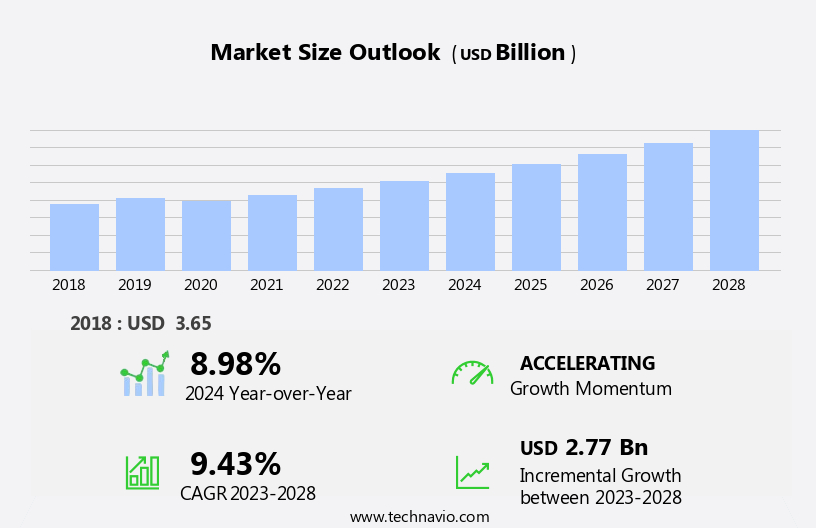
The sulfur recovery technology market size is forecast to increase by USD 2.77 billion, at a CAGR of 9.43% between 2023 and 2028.

  • The market is driven by stringent emissions regulations aimed at reducing sulfur dioxide emissions. This trend is expected to persist as governments worldwide prioritize environmental sustainability. Another key driver is the increasing number of sulfur recovery contracts, indicating a growing demand for sulfur and sulfuric acid. However, the high initial costs associated with setting up sulfur recovery units pose a significant challenge for market growth.
  • These costs can deter potential entrants and limit the expansion of existing players. Companies seeking to capitalize on market opportunities must carefully weigh the benefits of entering against the substantial investment required. Effective strategic planning and cost management will be essential for navigating this challenge and thriving in the market.

What will be the Size of the Sulfur Recovery Technology Market during the forecast period?

Sulfur Recovery Technology Market Size

 Request Free Sample

The sulfur recovery market is characterized by its continuous evolution, driven by the ever-changing dynamics of various industries and the ongoing quest for optimal sulfur recovery solutions. Sulfur recovery operations are integral to numerous sectors, including oil and gas production, power generation, and chemical manufacturing. The Claus process, a widely used sulfur recovery technology, continues to undergo development and optimization. Tail gas treatment, a crucial aspect of Claus plant operation, is a focus area for enhancing sulfur recovery efficiency and reducing emissions. Hydrogen sulfide, a key component in the Claus process, presents ongoing challenges in terms of safe handling and efficient utilization.

Sulfur recovery optimization is a priority for companies seeking to minimize costs, improve sustainability, and adhere to increasingly stringent regulations. Innovations in sulfur recovery technologies, such as automation and simulation, are driving advancements in sulfur recovery system design and operation. Sulfur recovery lifecycle considerations, including maintenance and investment, are essential elements in the overall sustainability and profitability of sulfur recovery units. The future of the sulfur recovery industry lies in continued research and development, with a focus on enhancing efficiency, reducing emissions, and ensuring safety and compliance with evolving regulations.

How is this Sulfur Recovery Technology Industry segmented?

The sulfur recovery technology industry research report provides comprehensive data (region-wise segment analysis), with forecasts and estimates in "USD billion" for the period 2024-2028, as well as historical data from 2018-2022 for the following segments.

  • Technology
    • Claus process
    • Tail gas treatment
    • Others
  • Application
    • Oil Refineries
    • Gas Processing Plants
    • Chemical Plants
    • Power Plants
  • End-User
    • Oil & Gas Industry
    • Chemical Industry
    • Power Generation
  • Process
    • Sulfur Recovery Units (SRU)
    • Sulfur Removal
    • Gas Sweetening
  • Geography
    • North America
      • US
      • Canada
    • South America
      • Argentina
      • Brazil
    • Middle East and Africa
      • UAE
    • Europe
      • Germany
    • APAC
      • China
      • Japan
    • Rest of World (ROW)

By Technology Insights

The claus process segment is estimated to witness significant growth during the forecast period.

The Claus process is a crucial sulfur recovery technology that effectively converts hydrogen sulfide (H2S) gas streams into elemental sulfur. Widely adopted in refineries, natural gas processing plants, and other H2S handling facilities, this process plays a significant role in reducing sulfur emissions, ensuring environmental compliance, and generating valuable elemental sulfur. The Claus reactor, a key component of this process, utilizes a catalyst, typically alumina-based, to facilitate the conversion of H2S into elemental sulfur. The catalyst, which consists of aluminum oxide combined with other substances like titanium oxide, enhances performance and process economics. Sulfur recovery challenges, such as varying H2S concentrations and process conditions, necessitate continuous optimization and monitoring.

Sulfur recovery efficiency, a critical metric, is influenced by factors like catalyst selection, operating conditions, and tail gas treatment. Sulfur recovery development is ongoing, with research focusing on improving efficiency, reducing costs, and enhancing sustainability. The sulfur recovery industry employs various technologies, including amine treating and Claus plant optimization, to optimize performance and minimize emissions. Sulfur recovery modeling and simulation are essential tools for understanding the process dynamics and optimizing operations. Sulfur recovery safety is paramount, with regulations and standards in place to ensure safe and efficient operations. The sulfur recovery lifecycle encompasses design, operation, maintenance, and investment, with each stage requiring careful consideration to maximize efficiency and minimize costs.

Sulfur recovery capacity is a key consideration for operators, with the ability to process large volumes of H2S gas a significant advantage. The future of sulfur recovery lies in automation, innovation, and sustainability, with a focus on reducing emissions, improving efficiency, and minimizing costs.

Sulfur Recovery Technology Market Size

Request Free Sample

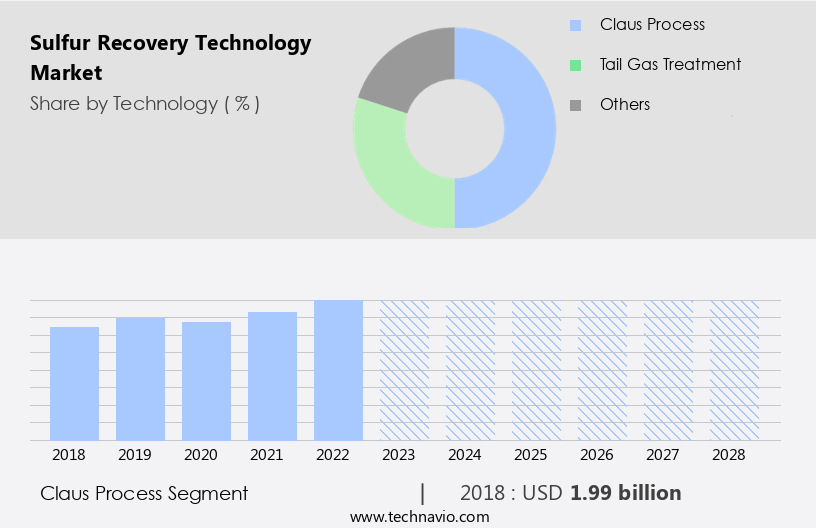
The Claus process segment was valued at USD 1.99 billion in 2018 and showed a gradual increase during the forecast period.

Regional Analysis

APAC is estimated to contribute 45% to the growth of the global market during the forecast period.Technavio's analysts have elaborately explained the regional trends and drivers that shape the market during the forecast period.

Sulfur Recovery Technology Market Share by Geography

 Request Free Sample

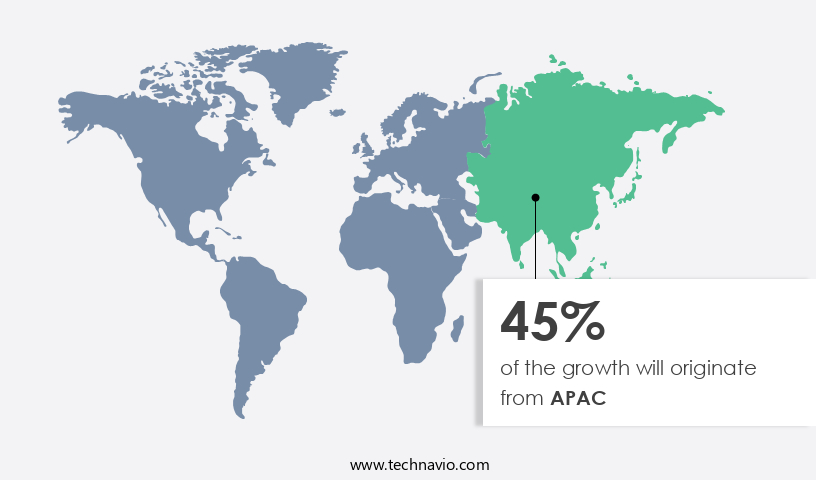
The market in APAC is experiencing notable growth, with China and India leading the charge. The region's economic expansion and population growth have resulted in increased energy demands, making oil refineries and natural gas processing plants essential components of the industrial landscape. Sulfur recovery processes are crucial in these industries to comply with environmental regulations and promote sustainability. The Claus process, a widely used sulfur recovery technology, is undergoing optimization to enhance efficiency and reduce emissions. Tail gas treatment, a critical aspect of sulfur recovery, is being advanced through simulation and modeling to improve the overall sulfur recovery lifecycle.

Hydrogen sulfide, a byproduct of sour gas, is being addressed through amine treating and other sulfur recovery solutions. Sulfur recovery challenges, such as safety concerns and high costs, are being addressed through automation, innovation, and maintenance strategies. The sulfur recovery industry is continuously evolving, with a focus on sustainability, efficiency, and compliance with regulations and standards. Sulfur recovery capacity is expanding, driven by investments in new technologies and upgrades to existing units. The future of sulfur recovery lies in advanced technologies and optimized processes that minimize emissions and maximize efficiency.

Market Dynamics

The Sulfur Recovery Technology market is crucial for environmental protection and resource management, with the Claus Process and Tail Gas Treatment being central to operations. These technologies are primarily implemented in Sulfur Recovery Units (SRU), often alongside Acid Gas Removal (AGR) systems in critical sectors. Oil & Gas Refineries and Natural Gas Processing plants are major end-users, driving demand for efficient hydrogen sulfide removal and overall emissions reduction sulfur. The market relies heavily on specialized sulfur recovery catalysts and is constantly evolving to meet stringent environmental compliance sulfur regulations. Innovations like modular sulfur recovery plants and liquid redox sulfur recovery are gaining traction, while advanced process control SRU systems optimize operations. The ultimate goal is effective sulfur dioxide abatement across various industries, including petrochemical plants sulfur, with solutions for sour gas treatment and overall sulfur plant optimization, also leveraging waste heat boilers SRU for energy efficiency in industrial sulfur recovery.

Our researchers analyzed the data with 2023 as the base year, along with the key drivers, trends, and challenges. A holistic analysis of drivers will help companies refine their marketing strategies to gain a competitive advantage.

What are the key market drivers leading to the rise in the adoption of Sulfur Recovery Technology Industry?

  • The stringent emissions standards, which focus on reducing sulfur dioxide emissions, serve as the primary market driver. 
  • Sulfur recovery technologies play a vital role in the refining and processing of crude oil and natural gas to meet stringent emission regulations. The removal of sulfur compounds, specifically hydrogen sulfide (H2S) and sulfur dioxide (SO2), is essential for reducing air pollution during fuel combustion. In the US and globally, regulations, such as the Federal Clean Air Act and the Environmental Protection Agency's standards, mandate sulfur reduction in various fuel products, including marine fuel and ultra-low-sulfur diesel. The European Union (EU) also enforces regulations under the Industrial Emissions Directive (IED), setting emission limit values for sulfur dioxide from various industrial installations.
  • Sulfur recovery innovations, such as automation and claus plant optimization, have significantly improved the efficiency and sustainability of sulfur recovery units. Sulfur recovery modeling has enabled better understanding and prediction of sulfur recovery processes, leading to reduced maintenance costs and improved operational performance. Sulfur recovery equipment manufacturers continue to invest in research and development to create more efficient and cost-effective technologies. Sustainability remains a key focus, with an emphasis on reducing energy consumption and minimizing waste. These advancements contribute to the overall growth and evolution of the sulfur recovery market.

What are the market trends shaping the Sulfur Recovery Technology Industry?

  • The trend in the sulfur recovery market is marked by an increasing number of contracts being signed. This growth is a reflection of the industry's continuing demand for effective sulfur recovery solutions.
  • Sulfur recovery systems have gained significant importance due to stringent environmental regulations mandating the reduction of sulfur dioxide emissions. These regulations have driven the demand for efficient sulfur recovery solutions across various industries. Technip Energies N.V., a leading engineering company, recently announced a contract to enhance sulfur recovery facilities at Aramco Riyadh Refinery. Under this agreement, Technip Energies N.V. Will install three new tail gas treatment (TGT) units to optimize the performance of existing sulfur recovery units (SRUs). This development underscores the growing market for sulfur recovery processes and technologies. The focus on increasing sulfur recovery rates and adhering to sulfur recovery standards is a key trend in the industry.
  • Companies are investing in advanced sulfur recovery processes and designs to meet these requirements and capitalize on the demand for sulfur recovery applications. This contract marks a significant milestone in the partnership between Technip Energies N.V. And Aramco, highlighting the importance of sulfur recovery systems in today's industrial landscape.

What challenges does the Sulfur Recovery Technology Industry face during its growth?

  • The high initial costs incurred during the setup of sulfur recovery units pose a significant challenge to the industry's growth trajectory. This financial hurdle, which is an inherent aspect of the sulfur recovery process, can significantly impact the profitability and competitiveness of companies operating in this sector. 
  • Sulfur recovery operations entail significant upfront investments in equipment, engineering, and installation, making it a capital-intensive process. The cost of installing a sulfur recovery unit in a refinery can vary greatly, ranging from several million to tens of millions of dollars, contingent upon the scale and complexity of the facility. For instance, a new 100-ton-per-day sulfur recovery unit, achieving a 98.5% sulfur recovery rate, may cost anywhere from USD25 million to USD30 million.
  • The substantial initial costs are primarily due to the advanced technology and equipment required for efficient sulfur recovery, such as amine treating units, Claus units, and tail gas treatment units.

Exclusive Customer Landscape

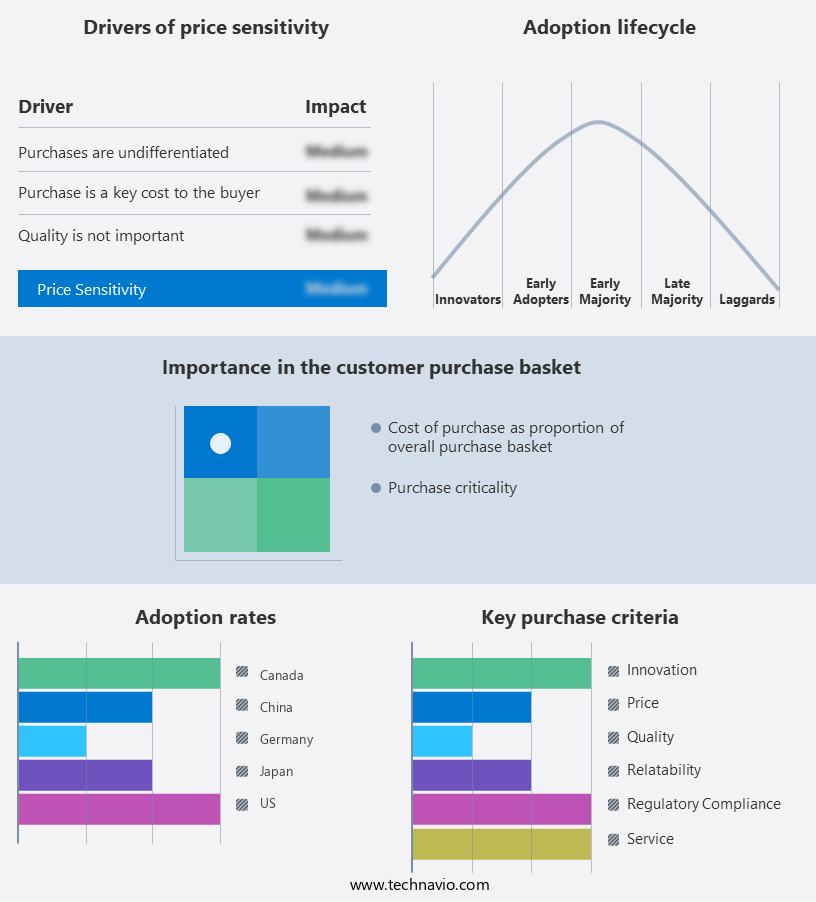
The sulfur recovery technology market forecasting report includes the adoption lifecycle of the market, covering from the innovator's stage to the laggard's stage. It focuses on adoption rates in different regions based on penetration. Furthermore, the sulfur recovery technology market report also includes key purchase criteria and drivers of price sensitivity to help companies evaluate and develop their market growth analysis strategies.

Sulfur Recovery Technology Market Share by Geography

 Customer Landscape

Key Companies & Market Insights

Companies are implementing various strategies, such as strategic alliances, sulfur recovery technology market forecast, partnerships, mergers and acquisitions, geographical expansion, and product/service launches, to enhance their presence in the industry.

Air Liquide S.A. - The company specializes in advanced sulfur recovery technology, specifically the OxyClaus system. This innovative solution enhances the capacity of existing Sulfur Recovery Units (SRUs) by up to 100%, featuring two distinct combustion zones for thorough impurity elimination. Impurities such as RSH, NH3, and hydrocarbons are effectively combusted, ensuring optimal efficiency and minimal emissions. By implementing this technology, clients can significantly improve their sulfur recovery processes while maintaining a cost-effective operation.

The industry research and growth report includes detailed analyses of the competitive landscape of the market and information about key companies, including:

  • Air Liquide S.A.
  • Amec Foster Wheeler
  • Axens
  • Bechtel Corporation
  • Black & Veatch
  • CB&I (McDermott)
  • Chiyoda Corporation
  • ExxonMobil Corporation
  • Fluor Corporation
  • Haldor Topsoe A/S
  • Jacobs Engineering Group Inc.
  • John Wood Group Plc
  • KBR Inc.
  • Linde AG
  • Mitsui Chemicals Inc.
  • Petrofac Limited
  • Saipem S.p.A.
  • Shell Global Solutions
  • TechnipFMC
  • WorleyParsons Ltd.

Qualitative and quantitative analysis of companies has been conducted to help clients understand the wider business environment as well as the strengths and weaknesses of key industry players. Data is qualitatively analyzed to categorize companies as pure play, category-focused, industry-focused, and diversified; it is quantitatively analyzed to categorize companies as dominant, leading, strong, tentative, and weak.

Recent Development and News in Sulfur Recovery Technology Market

  • In February 2023, Claus Technology, a leading sulfur recovery technology provider, announced the launch of its innovative ClausCAT Catalyst, which significantly enhances the efficiency of the Claus Process by up to 10% (Claus Technology press release). This development is expected to reduce sulfur emissions and improve overall profitability for hydrogen sulfide (H2S) processing industries.
  • In August 2022, ThyssenKrupp Industrial Solutions and Linde plc entered into a strategic partnership to combine their sulfur recovery technologies, creating a global market leader in this sector (ThyssenKrupp Industrial Solutions press release). This collaboration aims to offer customers a comprehensive range of sulfur recovery solutions, including the Claus Process and the Linde Sulfur Recovery Process.
  • In January 2021, CB&I, a global engineering, procurement, and construction company, was acquired by McDermott International, forming a new entity called McDermott CB&I (McDermott International press release). This merger brought together CB&I's extensive sulfur recovery technology portfolio with McDermott's expertise in engineering, construction, and project management.
  • In April 2019, the European Union (EU) implemented the Industrial Emissions Directive (IED), which set stricter emission limits for sulfur dioxide (SO2) and nitrogen oxides (NOx) in the European cement industry (European Commission press release). This regulatory initiative accelerated the adoption of advanced sulfur recovery technologies, such as the Claus Process, to meet the new emission standards.

Research Analyst Overview

  • The sulfur recovery market encompasses various technologies for converting sulfur-containing compounds in industrial processes into marketable sulfur products. Key technologies include acid gas treating, sulfur recovery incinerators, and sulfur recovery absorbers. Thermal oxidation processes, such as sulfur recovery stack and sulfur recovery vent, are employed to convert sulfur dioxide into sulfur trioxide, which is then converted into sulfuric acid. Sulfur recovery catalysts, including selective oxidation and catalytic oxidation, play a crucial role in enhancing the efficiency of these processes. Sulfur recovery waste, a byproduct of these processes, can be further refined into elemental sulfur or sulfuric acid.
  • Market trends include the integration of advanced technologies, such as membrane technology and regenerative thermal oxidation, to improve efficiency and reduce emissions. Sulfur recovery byproduct streams are increasingly being utilized as feedstocks for the production of high-value chemicals and fuels, further driving market growth.

Dive into Technavio's robust research methodology, blending expert interviews, extensive data synthesis, and validated models for unparalleled Sulfur Recovery Technology Market insights. See full methodology.

Market Scope

Report Coverage

Details

Page number

189

Base year

2023

Historic period

2018-2022

Forecast period

2024-2028

Growth momentum & CAGR

Accelerate at a CAGR of 9.43%

Market growth 2024-2028

USD 2.77 billion

Market structure

Fragmented

YoY growth 2023-2024(%)

8.98

Key countries

US, Canada, China, Japan, and Germany

Competitive landscape

Leading Companies, Market Positioning of Companies, Competitive Strategies, and Industry Risks

Request Free Sample

What are the Key Data Covered in this Sulfur Recovery Technology Market Research and Growth Report?

  • CAGR of the Sulfur Recovery Technology industry during the forecast period
  • Detailed information on factors that will drive the growth and forecasting between 2024 and 2028
  • Precise estimation of the size of the market and its contribution of the industry in focus to the parent market
  • Accurate predictions about upcoming growth and trends and changes in consumer behaviour
  • Growth of the market across APAC, North America, Europe, Middle East and Africa, and South America
  • Thorough analysis of the market's competitive landscape and detailed information about companies
  • Comprehensive analysis of factors that will challenge the sulfur recovery technology market growth of industry companies

We can help! Our analysts can customize this sulfur recovery technology market research report to meet your requirements.

Get in touch

1 Executive Summary

  • 1.1 Market overview
    • Exhibit 01: Executive Summary – Chart on Market Overview
    • Exhibit 02: Executive Summary – Data Table on Market Overview
    • Exhibit 03: Executive Summary – Chart on Global Market Characteristics
    • Exhibit 04: Executive Summary – Chart on Market by Geography
    • Exhibit 05: Executive Summary – Chart on Market Segmentation by Technology
    • Exhibit 06: Executive Summary – Chart on Market Segmentation by Application
    • Exhibit 07: Executive Summary – Chart on Incremental Growth
    • Exhibit 08: Executive Summary – Data Table on Incremental Growth
    • Exhibit 09: Executive Summary – Chart on Vendor Market Positioning

2 Market Landscape

  • 2.1 Market ecosystem
    • Exhibit 10: Parent market
    • Exhibit 11: Market Characteristics

3 Market Sizing

  • 3.1 Market definition
    • Exhibit 12: Offerings of vendors included in the market definition
  • 3.2 Market segment analysis
    • Exhibit 13: Market segments
  • 3.3 Market size 2023
    • 3.4 Market outlook: Forecast for 2023-2028
      • Exhibit 14: Chart on Global - Market size and forecast 2023-2028 ($ million)
      • Exhibit 15: Data Table on Global - Market size and forecast 2023-2028 ($ million)
      • Exhibit 16: Chart on Global Market: Year-over-year growth 2023-2028 (%)
      • Exhibit 17: Data Table on Global Market: Year-over-year growth 2023-2028 (%)

    4 Historic Market Size

    • 4.1 Global sulfur recovery technology market 2018 - 2022
      • Exhibit 18: Historic Market Size – Data Table on global sulfur recovery technology market 2018 - 2022 ($ million)
    • 4.2 Technology Segment Analysis 2018 - 2022
      • Exhibit 19: Historic Market Size – Technology Segment 2018 - 2022 ($ million)
    • 4.3 Application Segment Analysis 2018 - 2022
      • Exhibit 20: Historic Market Size – Application Segment 2018 - 2022 ($ million)
    • 4.4 Geography Segment Analysis 2018 - 2022
      • Exhibit 21: Historic Market Size – Geography Segment 2018 - 2022 ($ million)
    • 4.5 Country Segment Analysis 2018 - 2022
      • Exhibit 22: Historic Market Size – Country Segment 2018 - 2022 ($ million)

    5 Five Forces Analysis

    • 5.1 Five forces summary
      • Exhibit 23: Five forces analysis - Comparison between 2023 and 2028
    • 5.2 Bargaining power of buyers
      • Exhibit 24: Chart on Bargaining power of buyers – Impact of key factors 2023 and 2028
    • 5.3 Bargaining power of suppliers
      • Exhibit 25: Bargaining power of suppliers – Impact of key factors in 2023 and 2028
    • 5.4 Threat of new entrants
      • Exhibit 26: Threat of new entrants – Impact of key factors in 2023 and 2028
    • 5.5 Threat of substitutes
      • Exhibit 27: Threat of substitutes – Impact of key factors in 2023 and 2028
    • 5.6 Threat of rivalry
      • Exhibit 28: Threat of rivalry – Impact of key factors in 2023 and 2028
    • 5.7 Market condition
      • Exhibit 29: Chart on Market condition - Five forces 2023 and 2028

    6 Market Segmentation by Technology

    • 6.1 Market segments
      • Chart on Technology - Market share (2023-2028) (%)
      • Data Table on Technology - Market share (2023-2028) (%)
    • 6.2 Comparison by Technology
      • Chart on Comparison by Technology
      • Data Table on Comparison by Technology
    • 6.3 Claus process - Market size and forecast (2023-2028)
      • Chart on Claus process - Market size and forecast (2023-2028) ($ million)
      • Data Table on Claus process - Market size and forecast (2023-2028) ($ million)
      • Chart on Claus process - Year-over-year growth (2023-2028) (%)
      • Data Table on Claus process - Year-over-year growth (2023-2028) (%)
    • 6.4 Tail gas treatment - Market size and forecast (2023-2028)
      • Chart on Tail gas treatment - Market size and forecast (2023-2028) ($ million)
      • Data Table on Tail gas treatment - Market size and forecast (2023-2028) ($ million)
      • Chart on Tail gas treatment - Year-over-year growth (2023-2028) (%)
      • Data Table on Tail gas treatment - Year-over-year growth (2023-2028) (%)
    • 6.5 Others - Market size and forecast (2023-2028)
      • Chart on Others - Market size and forecast (2023-2028) ($ million)
      • Data Table on Others - Market size and forecast (2023-2028) ($ million)
      • Chart on Others - Year-over-year growth (2023-2028) (%)
      • Data Table on Others - Year-over-year growth (2023-2028) (%)
    • 6.6 Market opportunity by Technology
      • Market opportunity by Technology ($ million)
      • Data Table on Market opportunity by Technology ($ million)

    7 Market Segmentation by Application

    • 7.1 Market segments
      • Chart on Application - Market share (2023-2028) (%)
      • Data Table on Application - Market share (2023-2028) (%)
    • 7.2 Comparison by Application
      • Chart on Comparison by Application
      • Data Table on Comparison by Application
    • 7.3 Oil Refineries - Market size and forecast (2023-2028)
      • Chart on Oil Refineries - Market size and forecast (2023-2028) ($ million)
      • Data Table on Oil Refineries - Market size and forecast (2023-2028) ($ million)
      • Chart on Oil Refineries - Year-over-year growth (2023-2028) (%)
      • Data Table on Oil Refineries - Year-over-year growth (2023-2028) (%)
    • 7.4 Gas Processing Plants - Market size and forecast (2023-2028)
      • Chart on Gas Processing Plants - Market size and forecast (2023-2028) ($ million)
      • Data Table on Gas Processing Plants - Market size and forecast (2023-2028) ($ million)
      • Chart on Gas Processing Plants - Year-over-year growth (2023-2028) (%)
      • Data Table on Gas Processing Plants - Year-over-year growth (2023-2028) (%)
    • 7.5 Chemical Plants - Market size and forecast (2023-2028)
      • Chart on Chemical Plants - Market size and forecast (2023-2028) ($ million)
      • Data Table on Chemical Plants - Market size and forecast (2023-2028) ($ million)
      • Chart on Chemical Plants - Year-over-year growth (2023-2028) (%)
      • Data Table on Chemical Plants - Year-over-year growth (2023-2028) (%)
    • 7.6 Power Plants - Market size and forecast (2023-2028)
      • Chart on Power Plants - Market size and forecast (2023-2028) ($ million)
      • Data Table on Power Plants - Market size and forecast (2023-2028) ($ million)
      • Chart on Power Plants - Year-over-year growth (2023-2028) (%)
      • Data Table on Power Plants - Year-over-year growth (2023-2028) (%)
    • 7.7 Market opportunity by Application
      • Market opportunity by Application ($ million)
      • Data Table on Market opportunity by Application ($ million)

    8 Market Segmentation by End-User

    • 8.1 Market segments
      • Chart on End-User - Market share (2023-2028) (%)
      • Data Table on End-User - Market share (2023-2028) (%)
    • 8.2 Comparison by End-User
      • Chart on Comparison by End-User
      • Data Table on Comparison by End-User
    • 8.3 Oil & Gas Industry - Market size and forecast (2023-2028)
      • Chart on Oil & Gas Industry - Market size and forecast (2023-2028) ($ million)
      • Data Table on Oil & Gas Industry - Market size and forecast (2023-2028) ($ million)
      • Chart on Oil & Gas Industry - Year-over-year growth (2023-2028) (%)
      • Data Table on Oil & Gas Industry - Year-over-year growth (2023-2028) (%)
    • 8.4 Chemical Industry - Market size and forecast (2023-2028)
      • Chart on Chemical Industry - Market size and forecast (2023-2028) ($ million)
      • Data Table on Chemical Industry - Market size and forecast (2023-2028) ($ million)
      • Chart on Chemical Industry - Year-over-year growth (2023-2028) (%)
      • Data Table on Chemical Industry - Year-over-year growth (2023-2028) (%)
    • 8.5 Power Generation - Market size and forecast (2023-2028)
      • Chart on Power Generation - Market size and forecast (2023-2028) ($ million)
      • Data Table on Power Generation - Market size and forecast (2023-2028) ($ million)
      • Chart on Power Generation - Year-over-year growth (2023-2028) (%)
      • Data Table on Power Generation - Year-over-year growth (2023-2028) (%)
    • 8.6 Market opportunity by End-User
      • Market opportunity by End-User ($ million)
      • Data Table on Market opportunity by End-User ($ million)

    9 Market Segmentation by Process

    • 9.1 Market segments
      • Chart on Process - Market share (2023-2028) (%)
      • Data Table on Process - Market share (2023-2028) (%)
    • 9.2 Comparison by Process
      • Chart on Comparison by Process
      • Data Table on Comparison by Process
    • 9.3 Sulfur Recovery Units (SRU) - Market size and forecast (2023-2028)
      • Chart on Sulfur Recovery Units (SRU) - Market size and forecast (2023-2028) ($ million)
      • Data Table on Sulfur Recovery Units (SRU) - Market size and forecast (2023-2028) ($ million)
      • Chart on Sulfur Recovery Units (SRU) - Year-over-year growth (2023-2028) (%)
      • Data Table on Sulfur Recovery Units (SRU) - Year-over-year growth (2023-2028) (%)
    • 9.4 Sulfur Removal - Market size and forecast (2023-2028)
      • Chart on Sulfur Removal - Market size and forecast (2023-2028) ($ million)
      • Data Table on Sulfur Removal - Market size and forecast (2023-2028) ($ million)
      • Chart on Sulfur Removal - Year-over-year growth (2023-2028) (%)
      • Data Table on Sulfur Removal - Year-over-year growth (2023-2028) (%)
    • 9.5 Gas Sweetening - Market size and forecast (2023-2028)
      • Chart on Gas Sweetening - Market size and forecast (2023-2028) ($ million)
      • Data Table on Gas Sweetening - Market size and forecast (2023-2028) ($ million)
      • Chart on Gas Sweetening - Year-over-year growth (2023-2028) (%)
      • Data Table on Gas Sweetening - Year-over-year growth (2023-2028) (%)
    • 9.6 Market opportunity by Process
      • Market opportunity by Process ($ million)
      • Data Table on Market opportunity by Process ($ million)

    8 Customer Landscape

    • 8.1 Customer landscape overview
      • Exhibit 70: Analysis of price sensitivity, lifecycle, customer purchase basket, adoption rates, and purchase criteria

    9 Geographic Landscape

    • 9.1 Geographic segmentation
      • Exhibit 71: Chart on Market share by geography 2023-2028 (%)
      • Exhibit 72: Data Table on Market share by geography 2023-2028 (%)
    • 9.2 Geographic comparison
      • Exhibit 73: Chart on Geographic comparison
      • Exhibit 74: Data Table on Geographic comparison
    • 9.3 APAC - Market size and forecast 2023-2028
      • Exhibit 75: Chart on APAC - Market size and forecast 2023-2028 ($ million)
      • Exhibit 76: Data Table on APAC - Market size and forecast 2023-2028 ($ million)
      • Exhibit 77: Chart on APAC - Year-over-year growth 2023-2028 (%)
      • Exhibit 78: Data Table on APAC - Year-over-year growth 2023-2028 (%)
    • 9.4 North America - Market size and forecast 2023-2028
      • Exhibit 79: Chart on North America - Market size and forecast 2023-2028 ($ million)
      • Exhibit 80: Data Table on North America - Market size and forecast 2023-2028 ($ million)
      • Exhibit 81: Chart on North America - Year-over-year growth 2023-2028 (%)
      • Exhibit 82: Data Table on North America - Year-over-year growth 2023-2028 (%)
    • 9.5 Europe - Market size and forecast 2023-2028
      • Exhibit 83: Chart on Europe - Market size and forecast 2023-2028 ($ million)
      • Exhibit 84: Data Table on Europe - Market size and forecast 2023-2028 ($ million)
      • Exhibit 85: Chart on Europe - Year-over-year growth 2023-2028 (%)
      • Exhibit 86: Data Table on Europe - Year-over-year growth 2023-2028 (%)
    • 9.6 Middle East and Africa - Market size and forecast 2023-2028
      • Exhibit 87: Chart on Middle East and Africa - Market size and forecast 2023-2028 ($ million)
      • Exhibit 88: Data Table on Middle East and Africa - Market size and forecast 2023-2028 ($ million)
      • Exhibit 89: Chart on Middle East and Africa - Year-over-year growth 2023-2028 (%)
      • Exhibit 90: Data Table on Middle East and Africa - Year-over-year growth 2023-2028 (%)
    • 9.7 South America - Market size and forecast 2023-2028
      • Exhibit 91: Chart on South America - Market size and forecast 2023-2028 ($ million)
      • Exhibit 92: Data Table on South America - Market size and forecast 2023-2028 ($ million)
      • Exhibit 93: Chart on South America - Year-over-year growth 2023-2028 (%)
      • Exhibit 94: Data Table on South America - Year-over-year growth 2023-2028 (%)
    • 9.8 US - Market size and forecast 2023-2028
      • Exhibit 95: Chart on US - Market size and forecast 2023-2028 ($ million)
      • Exhibit 96: Data Table on US - Market size and forecast 2023-2028 ($ million)
      • Exhibit 97: Chart on US - Year-over-year growth 2023-2028 (%)
      • Exhibit 98: Data Table on US - Year-over-year growth 2023-2028 (%)
    • 9.9 China - Market size and forecast 2023-2028
      • Exhibit 99: Chart on China - Market size and forecast 2023-2028 ($ million)
      • Exhibit 100: Data Table on China - Market size and forecast 2023-2028 ($ million)
      • Exhibit 101: Chart on China - Year-over-year growth 2023-2028 (%)
      • Exhibit 102: Data Table on China - Year-over-year growth 2023-2028 (%)
    • 9.10 Germany - Market size and forecast 2023-2028
      • Exhibit 103: Chart on Germany - Market size and forecast 2023-2028 ($ million)
      • Exhibit 104: Data Table on Germany - Market size and forecast 2023-2028 ($ million)
      • Exhibit 105: Chart on Germany - Year-over-year growth 2023-2028 (%)
      • Exhibit 106: Data Table on Germany - Year-over-year growth 2023-2028 (%)
    • 9.11 Japan - Market size and forecast 2023-2028
      • Exhibit 107: Chart on Japan - Market size and forecast 2023-2028 ($ million)
      • Exhibit 108: Data Table on Japan - Market size and forecast 2023-2028 ($ million)
      • Exhibit 109: Chart on Japan - Year-over-year growth 2023-2028 (%)
      • Exhibit 110: Data Table on Japan - Year-over-year growth 2023-2028 (%)
    • 9.12 Canada - Market size and forecast 2023-2028
      • Exhibit 111: Chart on Canada - Market size and forecast 2023-2028 ($ million)
      • Exhibit 112: Data Table on Canada - Market size and forecast 2023-2028 ($ million)
      • Exhibit 113: Chart on Canada - Year-over-year growth 2023-2028 (%)
      • Exhibit 114: Data Table on Canada - Year-over-year growth 2023-2028 (%)
    • 9.13 Market opportunity by geography
      • Exhibit 115: Market opportunity by geography ($ million)
      • Exhibit 116: Data Tables on Market opportunity by geography ($ million)
    • 11.14 Rest of World (ROW) - Market size and forecast (2023-2028)
      • Chart on Rest of World (ROW) - Market size and forecast (2023-2028) ($ million)
      • Data Table on Rest of World (ROW) - Market size and forecast (2023-2028) ($ million)
      • Chart on Rest of World (ROW) - Year-over-year growth (2023-2028) (%)
      • Data Table on Rest of World (ROW) - Year-over-year growth (2023-2028) (%)

    10 Drivers, Challenges, and Trends

    • 10.1 Market drivers
      • 10.2 Market challenges
        • 10.3 Impact of drivers and challenges
          • Exhibit 117: Impact of drivers and challenges in 2023 and 2028
        • 10.4 Market trends

          11 Vendor Landscape

          • 11.1 Overview
            • 11.2 Vendor landscape
              • Exhibit 118: Overview on Criticality of inputs and Factors of differentiation
            • 11.3 Landscape disruption
              • Exhibit 119: Overview on factors of disruption
            • 11.4 Industry risks
              • Exhibit 120: Impact of key risks on business

            14 Competitive Analysis

            • 14.1 Companies profiled
              • Companies covered
            • 14.2 Market positioning of companies
              • Matrix on companies position and classification
            • 14.3 Air Liquide S.A.
              • Air Liquide S.A. - Overview
              • Air Liquide S.A. - Product / Service
              • Air Liquide S.A. - Key offerings
            • 14.4 Amec Foster Wheeler
              • Amec Foster Wheeler - Overview
              • Amec Foster Wheeler - Product / Service
              • Amec Foster Wheeler - Key offerings
            • 14.5 Axens
              • Axens - Overview
              • Axens - Product / Service
              • Axens - Key offerings
            • 14.6 Bechtel Corporation
              • Bechtel Corporation - Overview
              • Bechtel Corporation - Product / Service
              • Bechtel Corporation - Key offerings
            • 14.7 Black & Veatch
              • Black & Veatch - Overview
              • Black & Veatch - Product / Service
              • Black & Veatch - Key offerings
            • 14.8 CB&I (McDermott)
              • CB&I (McDermott) - Overview
              • CB&I (McDermott) - Product / Service
              • CB&I (McDermott) - Key offerings
            • 14.9 Chiyoda Corporation
              • Chiyoda Corporation - Overview
              • Chiyoda Corporation - Product / Service
              • Chiyoda Corporation - Key offerings
            • 14.10 ExxonMobil Corporation
              • ExxonMobil Corporation - Overview
              • ExxonMobil Corporation - Product / Service
              • ExxonMobil Corporation - Key offerings
            • 14.11 Fluor Corporation
              • Fluor Corporation - Overview
              • Fluor Corporation - Product / Service
              • Fluor Corporation - Key offerings
            • 14.12 Haldor Topsoe A/S
              • Haldor Topsoe A/S - Overview
              • Haldor Topsoe A/S - Product / Service
              • Haldor Topsoe A/S - Key offerings
            • 14.13 Jacobs Engineering Group Inc.
              • Jacobs Engineering Group Inc. - Overview
              • Jacobs Engineering Group Inc. - Product / Service
              • Jacobs Engineering Group Inc. - Key offerings
            • 14.14 John Wood Group Plc
              • John Wood Group Plc - Overview
              • John Wood Group Plc - Product / Service
              • John Wood Group Plc - Key offerings
            • 14.15 KBR Inc.
              • KBR Inc. - Overview
              • KBR Inc. - Product / Service
              • KBR Inc. - Key offerings
            • 14.16 Linde AG
              • Linde AG - Overview
              • Linde AG - Product / Service
              • Linde AG - Key offerings
            • 14.17 Mitsui Chemicals Inc.
              • Mitsui Chemicals Inc. - Overview
              • Mitsui Chemicals Inc. - Product / Service
              • Mitsui Chemicals Inc. - Key offerings
            • 14.18 Petrofac Limited
              • Petrofac Limited - Overview
              • Petrofac Limited - Product / Service
              • Petrofac Limited - Key offerings
            • 14.19 Saipem S.p.A.
              • Saipem S.p.A. - Overview
              • Saipem S.p.A. - Product / Service
              • Saipem S.p.A. - Key offerings
            • 14.20 Shell Global Solutions
              • Shell Global Solutions - Overview
              • Shell Global Solutions - Product / Service
              • Shell Global Solutions - Key offerings
            • 14.21 TechnipFMC
              • TechnipFMC - Overview
              • TechnipFMC - Product / Service
              • TechnipFMC - Key offerings
            • 14.22 WorleyParsons Ltd.
              • WorleyParsons Ltd. - Overview
              • WorleyParsons Ltd. - Product / Service
              • WorleyParsons Ltd. - Key offerings
            • 14.23 Air Liquide SA
              • Air Liquide SA - Overview
              • Air Liquide SA - Product / Service
              • Air Liquide SA - Key offerings
            • 14.24 Axens
              • Axens - Overview
              • Axens - Product / Service
              • Axens - Key offerings
            • 14.25 BASF SE
              • BASF SE - Overview
              • BASF SE - Product / Service
              • BASF SE - Key offerings
            • 14.26 Bechtel Corp.
              • Bechtel Corp. - Overview
              • Bechtel Corp. - Product / Service
              • Bechtel Corp. - Key offerings
            • 14.27 Black and Veatch Holding Co.
              • Black and Veatch Holding Co. - Overview
              • Black and Veatch Holding Co. - Product / Service
              • Black and Veatch Holding Co. - Key offerings
            • 14.28 Chiyoda Corp.
              • Chiyoda Corp. - Overview
              • Chiyoda Corp. - Product / Service
              • Chiyoda Corp. - Key offerings
            • 14.29 Exxon Mobil Corp.
              • Exxon Mobil Corp. - Overview
              • Exxon Mobil Corp. - Product / Service
              • Exxon Mobil Corp. - Key offerings
            • 14.30 Fluor Corp.
              • Fluor Corp. - Overview
              • Fluor Corp. - Product / Service
              • Fluor Corp. - Key offerings
            • 14.31 Honeywell International Inc.
              • Honeywell International Inc. - Overview
              • Honeywell International Inc. - Product / Service
              • Honeywell International Inc. - Key offerings
            • 14.32 Jacobs Solutions Inc.
              • Jacobs Solutions Inc. - Overview
              • Jacobs Solutions Inc. - Product / Service
              • Jacobs Solutions Inc. - Key offerings
            • 14.33 John Wood Group PLC
              • John Wood Group PLC - Overview
              • John Wood Group PLC - Product / Service
              • John Wood Group PLC - Key offerings
            • 14.34 Kinetics Technology Spa
              • Kinetics Technology Spa - Overview
              • Kinetics Technology Spa - Product / Service
              • Kinetics Technology Spa - Key offerings
            • 14.35 Linde Plc
              • Linde Plc - Overview
              • Linde Plc - Product / Service
              • Linde Plc - Key offerings
            • 14.36 Maire Tecnimont SpA
              • Maire Tecnimont SpA - Overview
              • Maire Tecnimont SpA - Product / Service
              • Maire Tecnimont SpA - Key offerings
            • 14.37 Merichem Co.
              • Merichem Co. - Overview
              • Merichem Co. - Product / Service
              • Merichem Co. - Key offerings
            • 14.38 Nuberg EPC
              • Nuberg EPC - Overview
              • Nuberg EPC - Product / Service
              • Nuberg EPC - Key offerings
            • 14.39 Phoenix Equipment Corp.
              • Phoenix Equipment Corp. - Overview
              • Phoenix Equipment Corp. - Product / Service
              • Phoenix Equipment Corp. - Key offerings
            • 14.40 Shell plc
              • Shell plc - Overview
              • Shell plc - Product / Service
              • Shell plc - Key offerings
            • 14.41 Sulfur Recovery Engineering
              • Sulfur Recovery Engineering - Overview
              • Sulfur Recovery Engineering - Product / Service
              • Sulfur Recovery Engineering - Key offerings
            • 14.42 Sulzer Management Ltd.
              • Sulzer Management Ltd. - Overview
              • Sulzer Management Ltd. - Product / Service
              • Sulzer Management Ltd. - Key offerings
            • 14.43 Technip Energies N.V.
              • Technip Energies N.V. - Overview
              • Technip Energies N.V. - Product / Service
              • Technip Energies N.V. - Key offerings
            • 14.44 TechnipFMC plc
              • TechnipFMC plc - Overview
              • TechnipFMC plc - Product / Service
              • TechnipFMC plc - Key offerings
            • 14.45 Thermax Ltd.
              • Thermax Ltd. - Overview
              • Thermax Ltd. - Product / Service
              • Thermax Ltd. - Key offerings
            • 14.46 Topsoes AS
              • Topsoes AS - Overview
              • Topsoes AS - Product / Service
              • Topsoes AS - Key offerings
            • 14.47 Worley
              • Worley - Overview
              • Worley - Product / Service
              • Worley - Key offerings

            13 Appendix

            • 13.1 Scope of the report
              • 13.2 Inclusions and exclusions checklist
                • Exhibit 188: Inclusions checklist
                • Exhibit 189: Exclusions checklist
              • 13.3 Currency conversion rates for US$
                • Exhibit 190: Currency conversion rates for US$
              • 13.4 Research methodology
                • Exhibit 191: Research methodology
                • Exhibit 192: Validation techniques employed for market sizing
                • Exhibit 193: Information sources
              • 13.5 List of abbreviations
                • Exhibit 194: List of abbreviations

              Research Methodology

              Technavio presents a detailed picture of the market by way of study, synthesis, and summation of data from multiple sources. The analysts have presented the various facets of the market with a particular focus on identifying the key industry influencers. The data thus presented is comprehensive, reliable, and the result of extensive research, both primary and secondary.

              INFORMATION SOURCES

              Primary sources

              • Manufacturers and suppliers
              • Channel partners
              • Industry experts
              • Strategic decision makers

              Secondary sources

              • Industry journals and periodicals
              • Government data
              • Financial reports of key industry players
              • Historical data
              • Press releases

              DATA ANALYSIS

              Data Synthesis

              • Collation of data
              • Estimation of key figures
              • Analysis of derived insights

              Data Validation

              • Triangulation with data models
              • Reference against proprietary databases
              • Corroboration with industry experts

              REPORT WRITING

              Qualitative

              • Market drivers
              • Market challenges
              • Market trends
              • Five forces analysis

              Quantitative

              • Market size and forecast
              • Market segmentation
              • Geographical insights
              • Competitive landscape

              Interested in this report?

              Get your sample now to see our research methodology and insights!

              Download Now

              Frequently Asked Questions

              Sulfur Recovery Technology market growth will increase by $ 2.77 bn during 2024-2028 .

              The Sulfur Recovery Technology market is expected to grow at a CAGR of 9.43% during 2024-2028 .

              Sulfur Recovery Technology market is segmented by Technology( Claus process, Tail gas treatment, Others) Application( Oil Refineries, Gas Processing Plants, Chemical Plants, Power Plants)

              Air Liquide S.A., Amec Foster Wheeler, Axens, Bechtel Corporation, Black & Veatch, CB&I (McDermott), Chiyoda Corporation, ExxonMobil Corporation, Fluor Corporation, Haldor Topsoe A/S, Jacobs Engineering Group Inc., John Wood Group Plc, KBR Inc., Linde AG, Mitsui Chemicals Inc., Petrofac Limited, Saipem S.p.A., Shell Global Solutions, TechnipFMC, WorleyParsons Ltd. are a few of the key vendors in the Sulfur Recovery Technology market.

              APAC will register the highest growth rate of 45% among the other regions. Therefore, the Sulfur Recovery Technology market in APAC is expected to garner significant business opportunities for the vendors during the forecast period.

              US, Canada, China, Japan, Germany

              • Stringent emissions standards to curb sulfur dioxide emissionsSulfur is naturally present in crude oil and natural gas is the driving factor this market.
              • but it is crucial to reduce its content through refining and processing for various reasons. In the case of crude oil is the driving factor this market.
              • lowering sulfur levels in gasoline and diesel is essential for enhancing emission controls. The sulfur recovery process is employed to eliminate sulfur compounds is the driving factor this market.
              • reducing air pollution during the combustion of these fuels. Regulations is the driving factor this market.
              • particularly those outlined by the Federal Clean Air Act and the Environmental Protection Agency is the driving factor this market.
              • mandate the removal of hydrogen sulfide (H2S) and sulfur dioxide (SO2) in products such as marine fuel and ultra-low-sulfur diesel. Similarly is the driving factor this market.
              • the European Union (EU) has established stringent regulations under the Industrial Emissions Directive (IED) is the driving factor this market.
              • setting emission limit values for sulfur dioxide from various industrial installations. Industries operating in EU member states must adhere to these limits is the driving factor this market.
              • driving the adoption of sulfur recovery technologies to ensure compliance. Additionally is the driving factor this market.
              • the International Maritime Organization (IMO) imposes strict regulations on sulfur content in marine fuels. The IMO global sulfur cap is the driving factor this market.
              • effective from January 1 is the driving factor this market.
              • 2020 is the driving factor this market.
              • mandated a reduction in sulfur content in marine fuels from 3.5% to 0.5% is the driving factor this market.
              • driving the adoption of sulfur recovery technologies in the maritime sector. In the realm of natural gas is the driving factor this market.
              • the presence of hydrogen sulfide in significant amounts results in "sour gas is the driving factor this market.
              • " characterized by a foul odor resembling rotten eggs and posing serious health risks. Compliance with state laws and regulations is necessary for sulfur recovery and emission limits in natural gas. Given that natural gas is often transported through pipelines is the driving factor this market.
              • the corrosive nature of sour gas becomes a major concern. To address these challenges is the driving factor this market.
              • the oil and gas industry employs sulfur recovery or sweetening processes is the driving factor this market.
              • converting hydrogen sulfide into elemental sulfur. Thus is the driving factor this market.
              • the stringent emissions standards to curb sulfur dioxide emissions are expected to drive the growth of the market in focus during the forecast period. is the driving factor this market.

              The Sulfur Recovery Technology market vendors should focus on grabbing business opportunities from the Claus process segment as it accounted for the largest market share in the base year.