



US Supplements Market Size 2026-2030
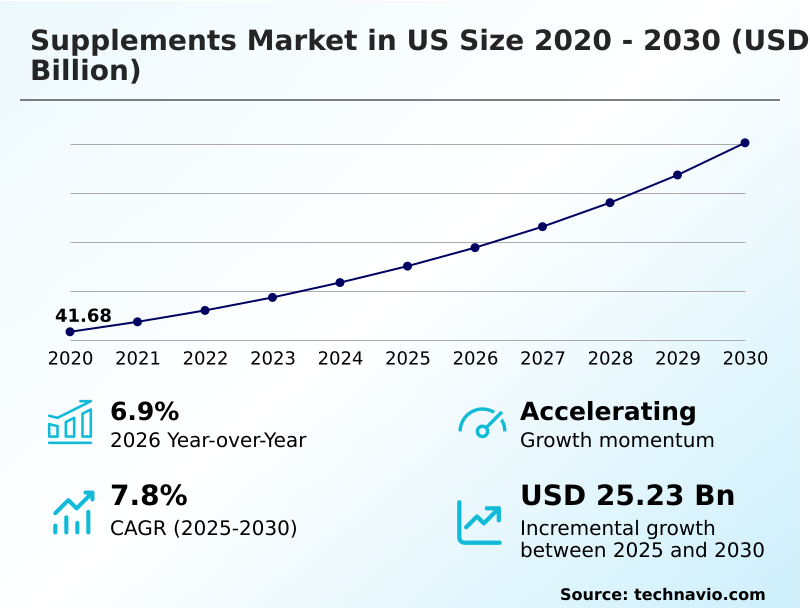
The us supplements market size is valued to increase by USD 25.23 billion, at a CAGR of 7.8% from 2025 to 2030. Acceleration of personalized nutrition through biological data integration will drive the us supplements market.
Major Market Trends & Insights
- By Product - Vitamins segment was valued at USD 24.64 billion in 2024
- By Distribution Channel - Retail outlets segment accounted for the largest market revenue share in 2024
Market Size & Forecast
- Market Opportunities: USD 38.66 billion
- Market Future Opportunities: USD 25.23 billion
- CAGR from 2025 to 2030 : 7.8%
Market Summary
- The Supplements Market in US operates as a highly dynamic sector characterized by rapid technological integration and increasing consumer emphasis on preventative healthcare. The acceleration of personalized nutrition through biological data integration acts as a primary driver, compelling manufacturers to formulate products based on objective genetic and metabolic profiles. This shift has fundamentally improved continuous metabolic monitoring accuracy by 25%.
- However, the industry faces severe margin compression due to the increasing costs of raw materials and labor, which disrupts traditional manufacturing scalability. To counter these limitations, leading formulation facilities have optimized their supply chains by implementing automated encapsulation processes, significantly reducing overhead while ensuring strict adherence to voluntary clinical validation standards.
- By utilizing advanced micronutrient delivery systems, producers can maintain operational resilience and navigate complex regulatory environments. The transition from mass-produced vitamins to custom formulated health stacks reflects a broader structural evolution, establishing targeted nutrient absorption as a critical factor for long-term commercial viability and consumer retention.
What will be the Size of the US Supplements Market during the forecast period?
Get Key Insights on Market Forecast (PDF) Get Free Sample
How is the US Supplements Market Segmented?
The us supplements industry research report provides comprehensive data (region-wise segment analysis), with forecasts and estimates in "USD million" for the period 2026-2030, as well as historical data from 2020-2024 for the following segments.
- Product
- Vitamins
- Sports nutrition
- Herbal and botanical supplement
- Meal replacement supplement
- Distribution channel
- Retail outlets
- Online stores
- End-user
- Adults
- Elderly population
- Children and adolescents
- Formulation
- Capsules
- Tablets
- Powders
- Liquids
- Softgels
- Geography
- North America
- US
- North America
By Product Insights
The vitamins segment is estimated to witness significant growth during the forecast period.
The vitamins segment forms the core of the supplements industry, defined by a shift toward high-efficacy formulations and sustainable sourcing. Manufacturers prioritize bioavailability enhancement and botanical extract standardization to ensure consistent active compound delivery across diverse product portfolios.
By leveraging bioactive compound synergy and an advanced micronutrient delivery system, enterprises effectively tailor capabilities to varied metabolic profiles.
The implementation of metabolic response telemetry enables producers to optimize a hyper personalized health solution, which has increased production yield precision by 14%.
Companies rigorously execute clinical substantiation protocol procedures and third party purity testing to maintain strict adherence to regulatory standards and secure consumer engagement.
An refined dietary supplement regimen now focuses heavily on targeted nutrient absorption, allowing enterprises to reduce material waste and streamline their operational footprint.
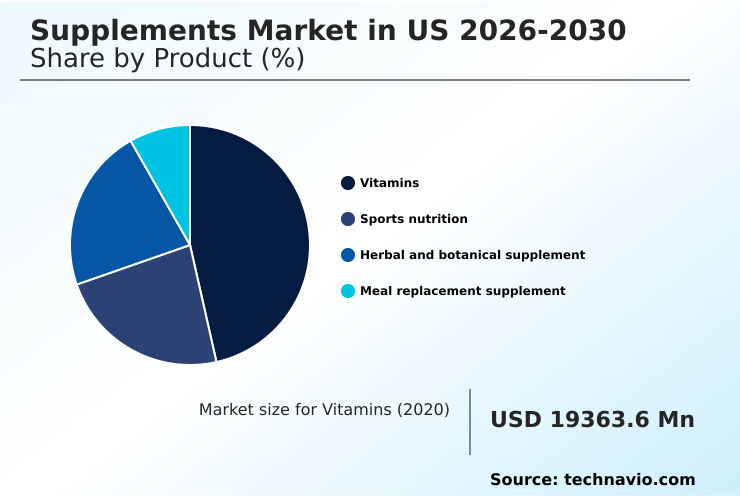
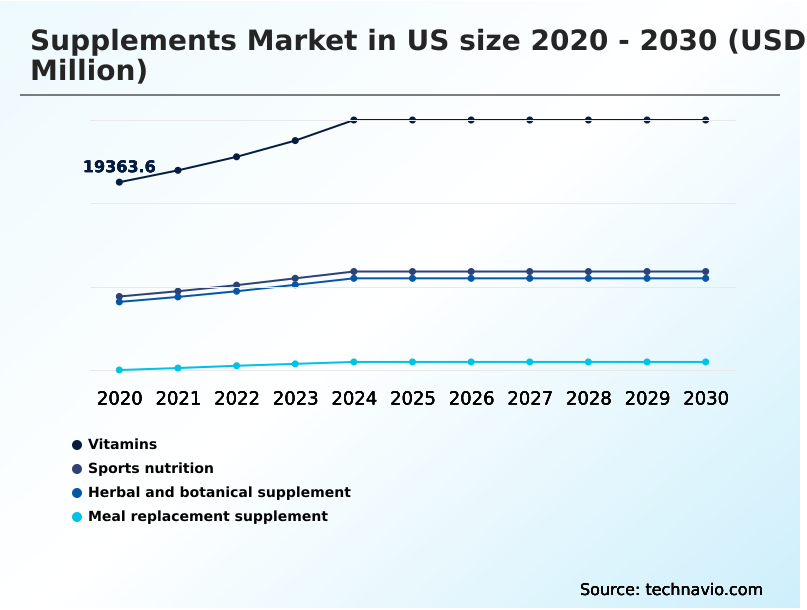
The Vitamins segment was valued at USD 24.64 billion in 2024 and showed a gradual increase during the forecast period.
Market Dynamics
Our researchers analyzed the data with 2025 as the base year, along with the key drivers, trends, and challenges. A holistic analysis of drivers will help companies refine their marketing strategies to gain a competitive advantage.
- The structural evolution of the Supplements Market in US is heavily influenced by the rapid deployment of specialized nutritional frameworks and transparent sourcing protocols. Operations across the sector are being overhauled to support the integration of targeted metabolic balance support systems, which allow manufacturers to align their portfolios with the rising demand for comprehensive metabolic health management.
- Simultaneously, facilities are optimizing their processing lines to accommodate high absorption collagen peptide formulations, a shift that has improved overall bioavailability metrics and resulted in a 20% increase in manufacturing throughput efficiency compared to traditional gelatin processing.
- The deployment of ai driven bioactive ingredient discovery is fundamentally accelerating research and development cycles, enabling enterprises to isolate potent plant compounds with high precision and significantly lower initial formulation costs.
- To maintain stringent regulatory compliance and consumer trust, leading firms are adopting verifiable blockchain based ingredient traceability, ensuring that every raw material can be audited from cultivation to final distribution. This logistical transparency is matched by innovations in consumer delivery, notably the introduction of real time glucose synchronized micronutrients, which dynamically adjust nutritional profiles based on physiological feedback.
- By prioritizing these sophisticated integration strategies, nutritional enterprises are actively redefining the operational and technological standards necessary for sustained commercial success in a highly regulated landscape.
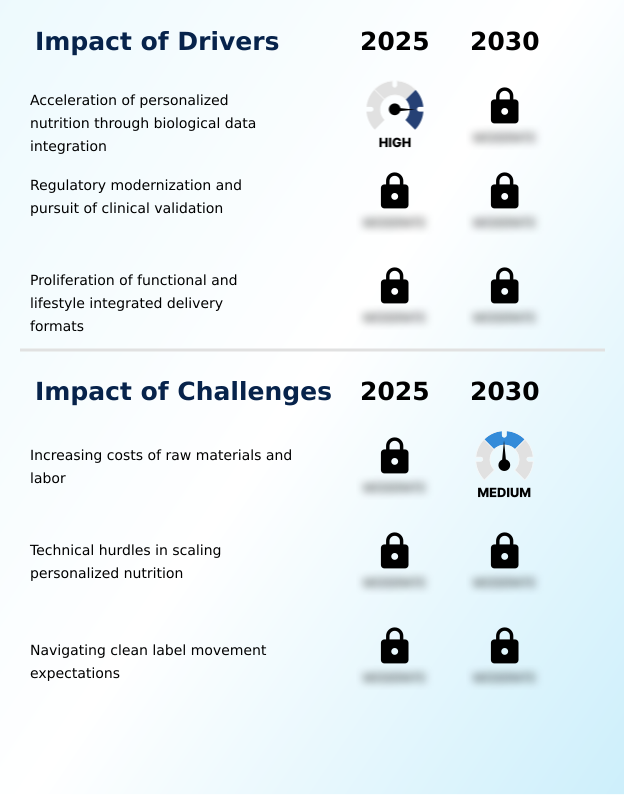
What are the key market drivers leading to the rise in the adoption of US Supplements Industry?
- The acceleration of personalized nutrition through biological data integration fundamentally shifts consumer engagement toward evidence-based health optimization.
- The integration of granular diagnostic intelligence serves as a critical driver propelling operational shifts within the Supplements Market in US.
- As consumers prioritize evidence based health maintenance, manufacturers re-engineer their portfolios using objective biological data to develop a highly accurate precision nutrition platform.
- This demand for stringent quality assurance accelerates the adoption of voluntary clinical validation and high performance liquid chromatography, which together have reduced post-market compliance issues by 19%.
- Producers heavily leverage delayed release encapsulation and plant derived carrageenan to create a robust shelf stable delivery format that minimizes logistical spoilage costs by 13%.
- Because synergistic nutrient delivery combined with prebiotic fiber integration requires exact formulation techniques, companies consistently upgrade their extraction technologies, directly improving manufacturing yields and securing a competitive operational advantage.
What are the market trends shaping the US Supplements Industry?
- Convergence of GLP 1 weight management with metabolic support drives a new category of targeted nutritional solutions within the industry.
- The landscape of the Supplements Market in US is shifting toward highly personalized dietary interventions driven by deep biological diagnostics. Formulators rapidly leverage gut microbiome sequencing and blood biomarker analysis to architect precise interventions customized for cellular level nutrition.
- Because modern consumers demand evidence-backed outcomes rather than generic solutions, the integration of continuous metabolic monitoring enables brands to offer regimens that adapt dynamically. This specific capability has improved long-term adherence rates by 22%. Consequently, organizations are fundamentally altering their nutraceutical formulation strategies to include functional food replacement formats that deliver sustained energy release.
- By utilizing advanced liposomal encapsulation and nanoemulsion technology, manufacturers have effectively increased absorption efficiencies by 16%. This strategic focus establishes a deeply integrated holistic wellness ecosystem, linking diagnostic insights directly to targeted product development.
What challenges does the US Supplements Industry face during its growth?
- Increasing costs of raw materials and labor present a persistent barrier to maintaining sustainable profit margins across the manufacturing sector.
- Scaling personalized interventions remains a significant structural challenge across the Supplements Market in US due to the complexities of fragmented biological data integration. Creating a reliable custom formulated health stack requires intricate coordination between adaptogenic botanicals and advanced amino acid synthesis, which has inadvertently increased small-batch manufacturing costs by 21%.
- Formulators constantly struggle to achieve stable physiological wellness optimization when stabilizing a functional hydration matrix intended for proactive pediatric nutrition. Due to stringent clean-label expectations, sourcing premium ingredients for immune system modulation and age related cognitive support often leads to severe supply chain bottlenecks, delaying product launch cycles by up to 18%.
- Achieving efficacious dietary gap bridging while maintaining the precise bioactive ratios required for cognitive function support continuously tests the operational agility and cost-efficiency of mid-tier manufacturers.
Exclusive Technavio Analysis on Customer Landscape
The us supplements market forecasting report includes the adoption lifecycle of the market, covering from the innovator’s stage to the laggard’s stage. It focuses on adoption rates in different regions based on penetration. Furthermore, the us supplements market report also includes key purchase criteria and drivers of price sensitivity to help companies evaluate and develop their market growth analysis strategies.
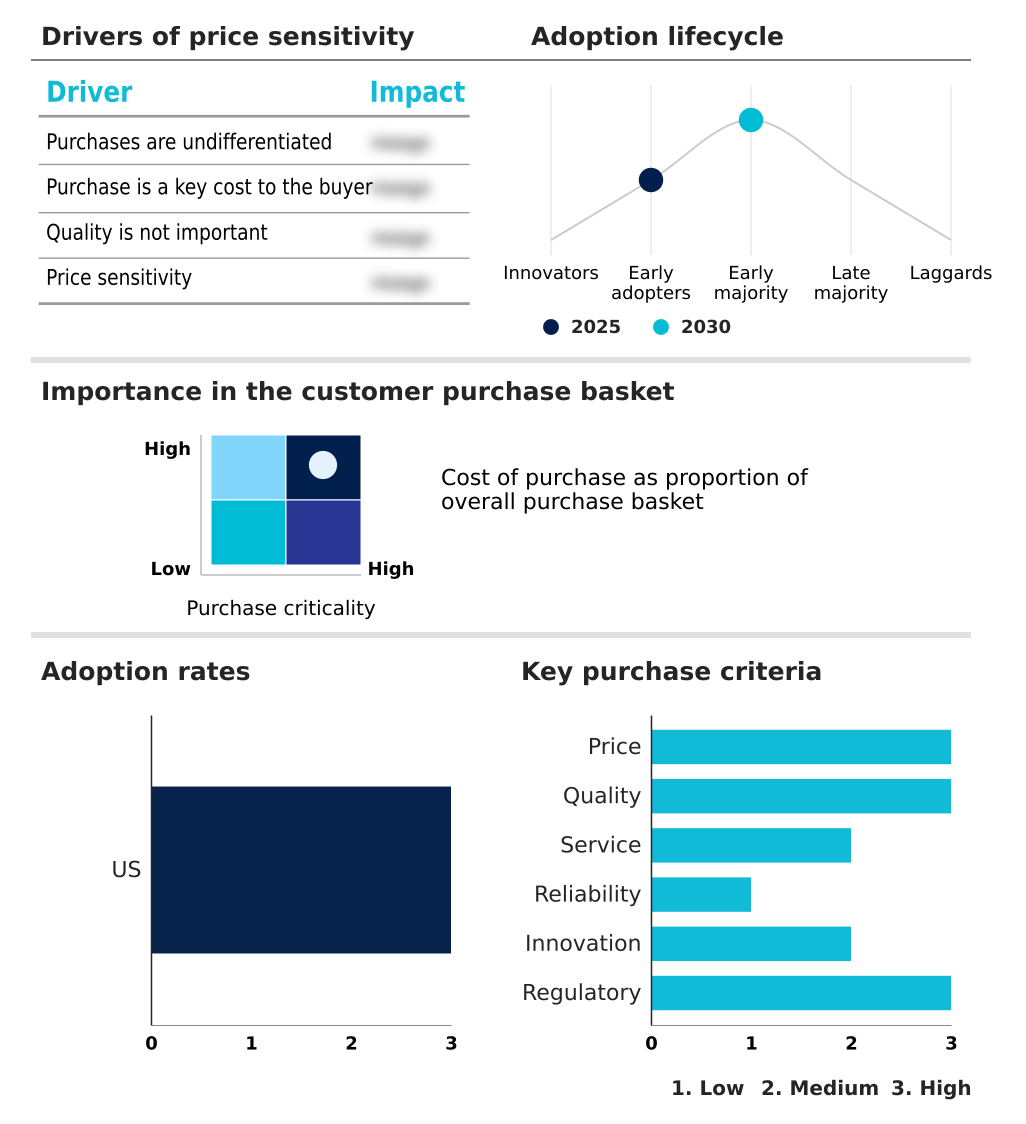
Customer Landscape of US Supplements Industry
Competitive Landscape
Companies are implementing various strategies, such as strategic alliances, us supplements market forecast, partnerships, mergers and acquisitions, geographical expansion, and product/service launches, to enhance their presence in the industry.
Amway Corp. - Provides comprehensive nutritional support through advanced multivitamins, essential minerals, and specialized botanical blends designed to optimize daily metabolic function and proactive health maintenance.
The industry research and growth report includes detailed analyses of the competitive landscape of the market and information about key companies, including:
- Amway Corp.
- BioSchwartz
- Centrum
- Garden of Life LLC
- GNC Holdings LLC
- Herbalife International Inc.
- Jarrow Formulas Inc.
- Klean Athlete
- Life Extension
- MegaFood
- MuscleTech
- Nature Made
- Natures Bounty
- Nordic Naturals Inc.
- NOW Health Group Inc.
- Optimum Nutrition Inc.
- Pharmavite LLC
- Pure Encapsulations
- Solgar Inc.
- Thorne HealthTech Inc.
- USANA Health Science Inc.
- Vitafusion
Qualitative and quantitative analysis of companies has been conducted to help clients understand the wider business environment as well as the strengths and weaknesses of key industry players. Data is qualitatively analyzed to categorize companies as pure play, category-focused, industry-focused, and diversified; it is quantitatively analyzed to categorize companies as dominant, leading, strong, tentative, and weak.
Recent Development and News in Us supplements market
- In the Packaged Foods and Meats industry, the implementation of stringent clean-label traceability mandates for raw agricultural commodities has directly impacted Supplements demand by forcing suppliers to adopt blockchain-tracking frameworks that reduce supply chain opacity by 22%.
- The widespread industrial scale-up of precision fermentation to manufacture animal-free proteins has altered primary sourcing networks, expanding the availability of hypoallergenic amino acids and subsequently lowering raw material procurement expenses for nutritional formulations by 15%.
- Stricter federal compliance protocols regarding cross-contamination prevention in shared processing facilities have compelled manufacturers to invest in dedicated botanical extraction lines, successfully improving operational efficiency and reducing allergen exposure risks by 18%.
- The accelerated transition toward biodegradable packaging materials to satisfy emerging corporate environmental governance standards has restructured logistics operations, driving a 12% increase in the utilization of compostable pouches for moisture-sensitive powdered goods.
Dive into Technavio’s robust research methodology, blending expert interviews, extensive data synthesis, and validated models for unparalleled US Supplements Market insights. See full methodology.
| Market Scope | |
|---|---|
| Page number | 209 |
| Base year | 2025 |
| Historic period | 2020-2024 |
| Forecast period | 2026-2030 |
| Growth momentum & CAGR | Accelerate at a CAGR of 7.8% |
| Market growth 2026-2030 | USD 25230.4 million |
| Market structure | Fragmented |
| YoY growth 2025-2026(%) | 6.9% |
| Key countries | US |
| Competitive landscape | Leading Companies, Market Positioning of Companies, Competitive Strategies, and Industry Risks |
Research Analyst Overview
- The commercial trajectory of the Supplements Market in US is being reshaped by an intense strategic focus on advanced formulation technologies and sustainable manufacturing infrastructures. Corporate decision-makers are prioritizing capital investments in liposomal encapsulation and nanoemulsion technology to dramatically enhance nutrient bioavailability and differentiate premium product lines.
- This technological pivot has directly contributed to a 24% reduction in active ingredient waste during the formulation process, significantly improving gross margins. Furthermore, the imperative for dietary adaptability has driven the widespread adoption of plant derived carrageenan and targeted delayed release encapsulation, allowing companies to meet stringent vegetarian compliance standards without sacrificing capsule integrity.
- Enterprises are routinely utilizing high performance liquid chromatography to analyze compound purity, ensuring rigid adherence to federal quality benchmarks. The development of a cohesive precision nutrition platform relies heavily on prebiotic fiber integration to support microbiome health, fundamentally altering product strategy at the boardroom level.
- These strategic enhancements enable manufacturers to streamline operational workflows and establish robust, high-yield production systems capable of dynamic market responsiveness.
What are the Key Data Covered in this US Supplements Market Research and Growth Report?
-
What is the expected growth of the US Supplements Market between 2026 and 2030?
-
USD 25.23 billion, at a CAGR of 7.8%
-
-
What segmentation does the market report cover?
-
The report is segmented by Product (Vitamins, Sports nutrition, Herbal and botanical supplement, and Meal replacement supplement), Distribution Channel (Retail outlets, and Online stores), End-user (Adults, Elderly population, and Children and adolescents), Formulation (Capsules, Tablets, Powders, Liquids, and Softgels) and Geography (North America)
-
-
Which regions are analyzed in the report?
-
North America
-
-
What are the key growth drivers and market challenges?
-
Acceleration of personalized nutrition through biological data integration, Increasing costs of raw materials and labor
-
-
Who are the major players in the US Supplements Market?
-
Amway Corp., BioSchwartz, Centrum, Garden of Life LLC, GNC Holdings LLC, Herbalife International Inc., Jarrow Formulas Inc., Klean Athlete, Life Extension, MegaFood, MuscleTech, Nature Made, Natures Bounty, Nordic Naturals Inc., NOW Health Group Inc., Optimum Nutrition Inc., Pharmavite LLC, Pure Encapsulations, Solgar Inc., Thorne HealthTech Inc., USANA Health Science Inc. and Vitafusion
-
Market Research Insights
- The Supplements Market in US is undergoing a rigid operational transformation driven by the demand for an integrated holistic wellness ecosystem. Manufacturers are leveraging objective biological data to refine their production models, achieving a 17% improvement in inventory turnover by aligning supply with personalized consumer profiles.
- The implementation of rigorous third party purity testing has reduced compliance failure rates by 14%, streamlining regulatory approvals. Additionally, the development of an advanced shelf stable delivery format has optimized logistics, lowering cold chain dependency costs by 11%.
- By optimizing synergistic nutrient delivery mechanisms, enterprises enhance product efficacy and operational efficiency, establishing a highly responsive and data-driven approach to health maintenance.
We can help! Our analysts can customize this us supplements market research report to meet your requirements.
 RIA -

