Surfactants Market Analysis, Size, and Forecast 2024-2028: North America (US and Canada), Europe (France, Germany, Italy, and UK), Middle East and Africa (Egypt, KSA, Oman, and UAE), APAC (China, India, and Japan), South America (Argentina and Brazil), and Rest of World (ROW)

Surfactants Market Analysis, Size, and Forecast 2024-2028:
North America (US and Canada), Europe (France, Germany, Italy, and UK), Middle East and Africa (Egypt, KSA, Oman, and UAE), APAC (China, India, and Japan), South America (Argentina and Brazil), and Rest of World (ROW)

Published: May 2024 203 Pages SKU: IRTNTR43849

Market Overview at a Glance

$13.2 B
Market Opportunity
5.23%
CAGR
4.84
YoY growth 2023-2024(%)

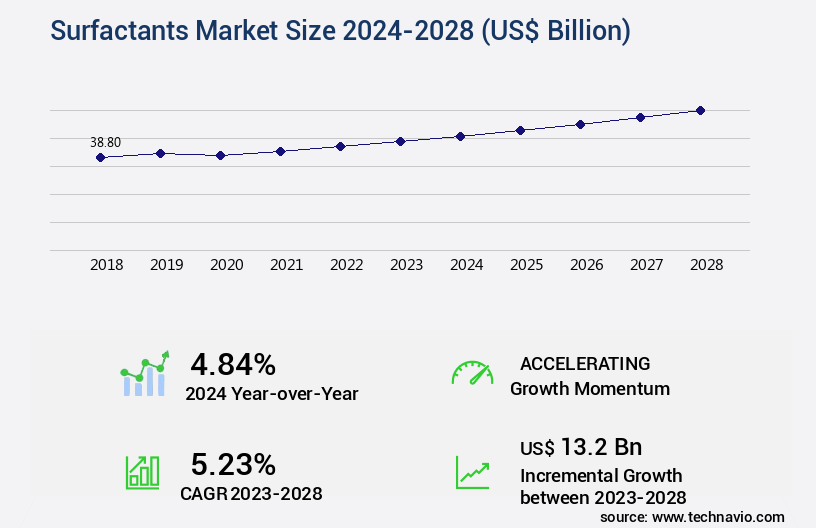
Surfactants Market Size 2024-2028

The surfactants market size is forecast to increase by USD 13.2 billion, at a CAGR of 5.23% between 2023 and 2028.

Major Market Trends & Insights

  • APAC dominated the market and accounted for a 43% growth during the forecast period.
  • By the Product - Anionic segment was valued at USD 15.40 billion in 2022
  • By the Application - Detergents segment accounted for the largest market revenue share in 2022

Market Size & Forecast

  • Market Opportunities: USD 51.29 billion
  • Market Future Opportunities: USD 13.20 billion
  • CAGR : 5.23%
  • APAC: Largest market in 2022

Market Summary

  • The market is a dynamic and expansive industry, characterized by continuous innovation and growth. According to recent studies, the global market for surfactants is projected to reach a significant index number by 2026, representing a notable increase from its current size. This expansion is driven by the increasing demand for various consumer goods, particularly in the sectors of personal care, household cleaning, and industrial applications. In the personal care industry, the adoption of surfactants has seen a substantial rise due to their ability to enhance the foaming, cleansing, and emulsifying properties of personal care products. In the household cleaning sector, surfactants are essential for the production of detergents, which are used extensively in various applications such as laundry, dish washing, and floor cleaning.
  • Moreover, the industrial sector utilizes surfactants in various applications, including oil recovery, mining, and textile processing. Despite the market's positive growth, there are challenges that persist, such as the volatility in raw material prices and the need for stringent regulations. However, the ongoing R&D activities in the industry are aimed at addressing these challenges and driving innovation, ensuring the market's continued growth and evolution.

What will be the Size of the Surfactants Market during the forecast period?

Surfactants Market Size

Explore market size, adoption trends, and growth potential for surfactants market Request Free Sample

  • The market encompasses a diverse range of chemicals that modify the interfacial properties between oil and water. These compounds, characterized by their HLB (hydrophilic-lipophilic balance) values and contact angles, play a crucial role in various industrial applications, including phase behavior, formulation optimization, and performance enhancement. The market is projected to reach a significant value by 2025, growing at a steady rate due to increasing demand for detergents, personal care products, and agrochemicals. For instance, the solubility parameter of surfactants in these industries facilitates effective emulsion stability and foam stability, contributing to their widespread use.
  • Interfacial tension, a key property of surfactants, is a critical factor in determining their efficiency at reducing surface tension between oil and water. For example, anionic surfactants typically exhibit lower interfacial tension values compared to nonionic surfactants, leading to improved wetting efficiency. Moreover, the environmental impact of surfactants is a significant consideration in the market. Biodegradation kinetics and adsorption isotherms are essential parameters for evaluating the environmental fate of surfactants, with OECD guidelines providing standardized testing methods. The shift towards sustainable surfactants, such as those derived from renewable resources, is also driving innovation in the market.
  • In summary, the market is a dynamic and evolving industry, driven by the diverse applications of these chemicals and the ongoing quest for improved sustainability and performance.

How is this Surfactants Industry segmented?

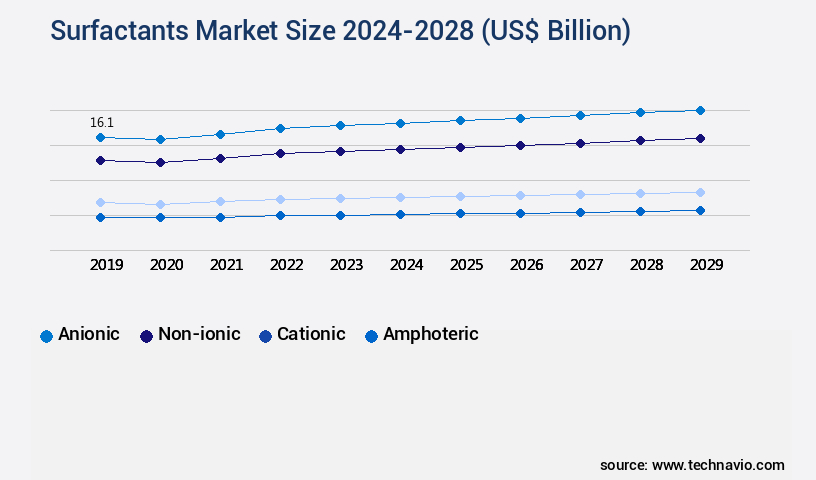
The surfactants industry research report provides comprehensive data (region-wise segment analysis), with forecasts and estimates in "USD billion" for the period 2024-2028, as well as historical data from 2018-2022 for the following segments.

  • Product
    • Anionic
    • Non-ionic
    • Cationic
    • Amphoteric
  • Application
    • Detergents
    • Industrial and institutional cleaning
    • Food processing
    • Personal care
    • Others
  • Type
    • Synthetic
    • Bio-based
  • End-User
    • Consumer Goods
    • Industrial
    • Automotive
    • Textiles
  • Geography
    • North America
      • US
      • Canada
    • Europe
      • France
      • Germany
      • Italy
      • UK
    • Middle East and Africa
      • Egypt
      • KSA
      • Oman
      • UAE
    • APAC
      • China
      • India
      • Japan
    • South America
      • Argentina
      • Brazil
    • Rest of World (ROW)

    By Product Insights

    The anionic segment is estimated to witness significant growth during the forecast period.

    Surfactants, essential ingredients in various industries, exhibit significant market growth, with anionic surfactants holding the largest share. Anionic surfactants, characterized by a negatively charged head, are extensively used in cleaning formulations, particularly in dishwashing liquids, laundering, and shampoos. Their popularity stems from their superior cleaning properties, effectively removing fabric softener residues and tackling oily and clay soils. The emulsification capacity and surface tension reduction capabilities of surfactants are crucial in industrial processes, enhancing solubilization and improving rheological properties. Nonionic surfactants, another vital market segment, offer hydrophilic-lipophilic balance, ensuring effective wetting and dispersing properties. The agricultural sector utilizes surfactants for enhancing the efficiency of agricultural chemicals, while cosmetic applications rely on surfactants for their micellar structure and wetting properties.

    The demand for environmentally friendly surfactant mixtures, such as alkyl ethoxylates and alkyl sulfates, is on the rise due to their biodegradability assessment and reduced environmental impact. Future industry growth is anticipated in areas like fluorinated surfactants, amphoteric surfactants, and cationic surfactants, which offer unique properties for specific applications. For instance, cationic surfactants ensure dispersion stability in certain industrial processes, while amphoteric surfactants cater to the need for versatile cleaning formulations. The dynamic the market continues to evolve, with ongoing research and development efforts focusing on improving performance, reducing toxicity, and enhancing sustainability. The continuous unfolding of market activities and evolving patterns underscore the importance of staying informed for businesses in this sector.

    Surfactants Market Size

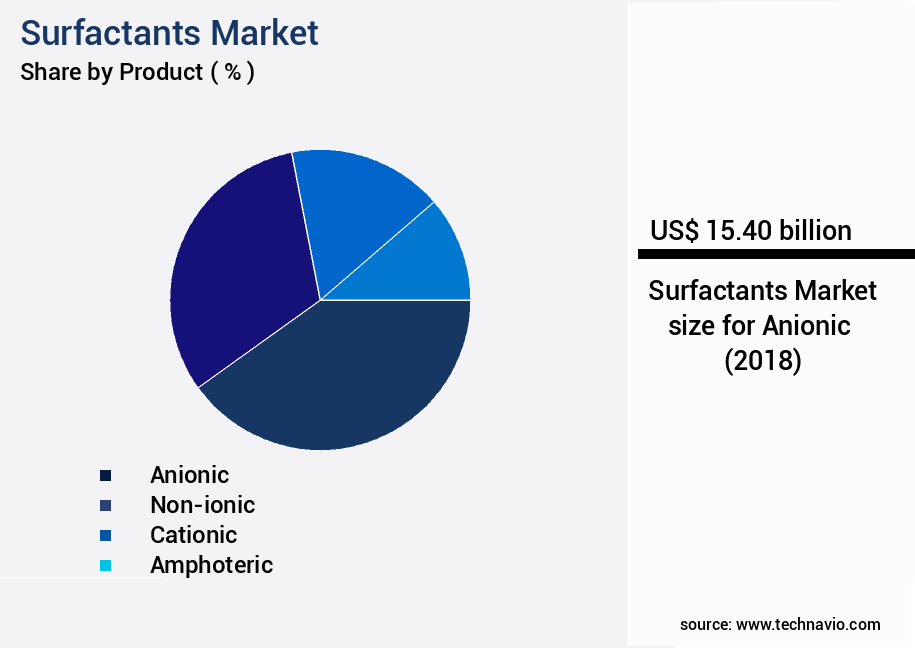
    The Anionic segment was valued at USD 15.40 billion in 2018 and showed a gradual increase during the forecast period.

    Surfactants Market Size

    Request Free Sample

    Regional Analysis

    APAC is estimated to contribute 43% to the growth of the global market during the forecast period.Technavio’s analysts have elaborately explained the regional trends and drivers that shape the market during the forecast period.

    Surfactants Market Share by Geography

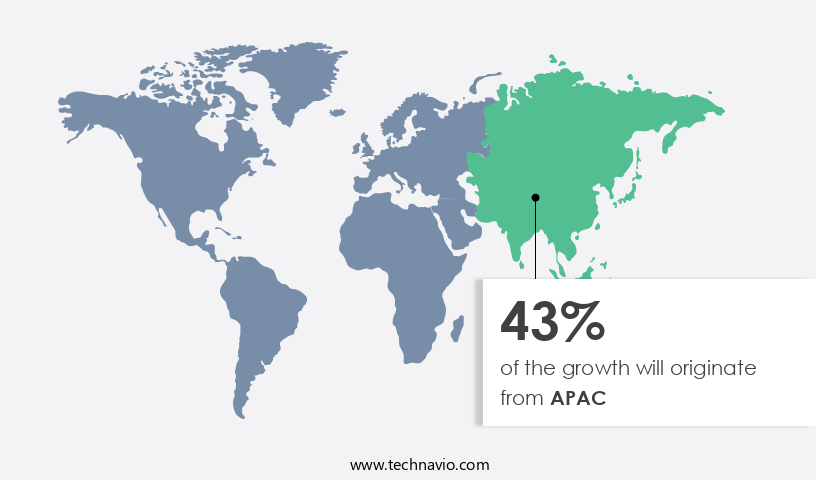
    See How Surfactants Market Demand is Rising in APAC Request Free Sample

    The market in Asia Pacific (APAC) is experiencing significant growth, with several countries, including China, India, Indonesia, Thailand, Australia, Japan, the Philippines, Malaysia, and South Korea, driving the demand for surfactants. China, as a major consumer of detergents, and its anticipated position as the largest cosmetic market globally during the forecast period, significantly contributes to the market's expansion. Population growth and increasing disposable income in APAC are key factors fueling the demand for surfactants. Furthermore, the emergence of China and India as manufacturing hubs in the region is expected to boost industrial and institutional cleaning and food processing applications.

    According to recent industry reports, APAC is projected to witness a growth rate of approximately 6% in surfactant consumption in the detergent industry. Additionally, the personal care sector is anticipated to grow by around 7%, with a similar growth rate expected in the food processing industry. The market's expansion is also influenced by the increasing adoption of surfactants in various applications, such as oilfield chemicals, pharmaceuticals, and agrochemicals. The market is expected to reach a value of around USD70 billion by 2026, growing at a rate of around 5% per year. In comparison to the current market size, the future growth prospects of the market are promising.

    The market's expansion is attributed to the growing demand for surfactants in various industries, including detergents, personal care, food processing, and others. The increasing focus on research and development in the production of eco-friendly surfactants is also expected to contribute to market growth. In conclusion, the market in APAC is experiencing substantial growth, driven by the increasing demand from various industries and the growing population and disposable income in the region. The market is expected to reach significant value by 2026, growing at a steady rate during the forecast period.

    Market Dynamics

    Our researchers analyzed the data with 2023 as the base year, along with the key drivers, trends, and challenges. A holistic analysis of drivers will help companies refine their marketing strategies to gain a competitive advantage.

    Advancements and Performance Improvements in the US Surfactant Market: Focus on Degradation Pathways, Compliance, and Innovation The US surfactant market continues to evolve, driven by advancements in technology and increasing demand for eco-friendly and high-performing products. One significant area of focus is understanding alkyl benzene sulfonate degradation pathways to minimize environmental impact. Surfactant concentration plays a crucial role in foam height, with nonionic surfactants demonstrating superior performance. To ensure optimal results, determining the cloud point of nonionic surfactants is essential. Anionic surfactant critical micelle concentrations (CMC) are also vital for formulation development and process efficiency. Innovation in the surfactant industry includes the development of antimicrobial cationic surfactants, which undergo rigorous testing to meet OECD biodegradability standards. Understanding surfactant interaction with soil particles is another critical factor, as it influences wetting and emulsification properties. Surfactants play a vital role in the detergent process, improving efficiency and reducing downtime. In the oil industry, surfactants are used in enhanced oil recovery processes to increase production. Formulation selection criteria for surfactants include performance, sustainability, and environmental impact. Comparing various surfactant types, such as anionic, cationic, and nonionic, can provide valuable insights into their respective strengths and weaknesses. Sustainable surfactant development strategies are gaining traction, with a focus on reducing toxicity to aquatic organisms and minimizing environmental impact. Synergistic effects of surfactant mixtures and micellar solubilization of hydrophobic compounds further expand their applications. In conclusion, the US surfactant market is characterized by continuous innovation, improved performance, and a growing focus on sustainability and compliance. By understanding these trends and advancements, businesses can make informed decisions and stay competitive in this dynamic industry.

    Surfactants Market Size

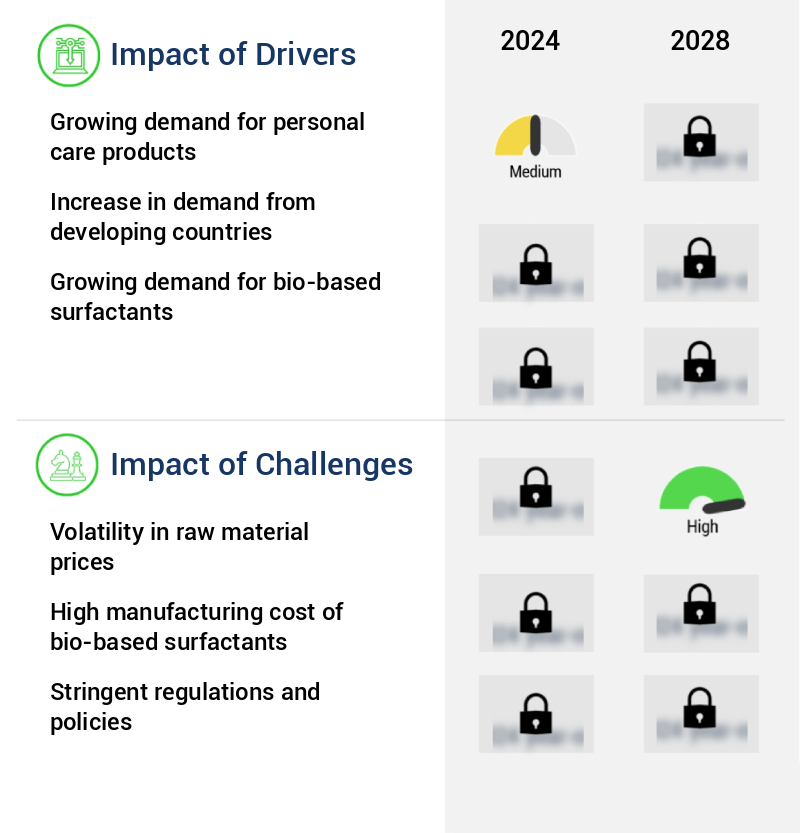
    What are the key market drivers leading to the rise in the adoption of Surfactants Industry?

    • The surge in consumer preference for personal care items serves as the primary catalyst for market expansion. 

    • The market encompasses a wide range of chemicals used to reduce the surface tension between two liquids, a solid and a liquid, or a gas and a liquid. These substances are integral to various industries, including personal care, agriculture, food and beverage, and oil and gas. In the personal care sector, surfactants play a crucial role in the production of cleansing agents, such as shampoos, shower gels, and hair conditioners. They generate foam and cleanse the skin gently, making them indispensable in personal care applications. Surfactants also function as emulsifiers in lotions and creams, stabilizing oil droplets and water.
    • This property is essential in sunscreen and skincare cosmetics, allowing for quick absorption and leaving a non-greasy finish. The demand for surfactants in personal care applications continues to expand due to the increasing popularity of cosmetics and personal care products. This trend is driven by factors such as changing consumer preferences and the growing awareness of personal hygiene. Moreover, surfactants are essential in the food and beverage industry, where they act as emulsifiers, stabilizers, and foaming agents. In agriculture, they are used as wetting agents, reducing the surface tension between water and soil, enhancing the efficiency of pesticides and fertilizers.
    • In the oil and gas sector, surfactants are used in drilling operations, improving the flow of oil and gas from reservoirs. The versatility of surfactants and their applications across various industries make them a vital component in numerous processes. The market for surfactants is continuously evolving, with ongoing research and development efforts aimed at creating more effective and sustainable surfactant solutions. This dynamic market landscape presents both opportunities and challenges for manufacturers and consumers alike.

    What are the market trends shaping the Surfactants Industry?

    • Increase in research and development (R&D) activities is a mandated market trend. This trend signifies a significant focus on innovation and improvement within industries.

    • The market is characterized by continuous evolution and growth, driven by increasing research and development (R&D) investments from major players. Manufacturers are focusing on reducing manufacturing costs and delivering products with enhanced properties to maintain their competitive edge. Clariant, for instance, offers mild surfactants for personal care applications, such as GlucoTain Plus and Gluionic Liquid, which are sulfate-free, biodegradable, preservative-free, and free from ethoxylated ingredients. These mild surfactants cater to the growing demand for eco-friendly and gentle personal care products. Another significant trend in the market is the emphasis on new product development and innovations.
    • For instance, Solvay's Pluracare range of nonionic surfactants is designed for various applications, including personal care, household cleaning, and industrial applications. These surfactants offer improved performance, biodegradability, and sustainability, making them a popular choice among consumers and businesses. The increasing adoption of these advanced surfactants in various industries, including personal care, agriculture, and food and beverage, is expected to fuel the growth of the market. Additionally, the rising awareness of environmental sustainability and the growing demand for eco-friendly products are further boosting the market's expansion. Despite the challenges posed by raw material price volatility and regulatory compliance, the market is poised for steady growth, offering significant opportunities for both established players and new entrants.

    What challenges does the Surfactants Industry face during its growth?

    • The volatility in raw material prices poses a significant challenge to the industry's growth trajectory. In order to maintain competitiveness and profitability, businesses must closely monitor and adapt to fluctuations in the cost of essential inputs. 

    • Surfactants are essential industrial chemicals used to reduce surface tension between two liquids or between a liquid and a solid. The primary raw materials for producing surfactants include linear alkylbenzene (LAB), detergent alcohols, and ethylene oxide (EO). The cost of these raw materials can be volatile due to their derivation from downstream petroleum products. In China, the average cost of domestic EO ranges between USD45 per tonne and USD1,314 per tonne, excluding warehouse fees. The price fluctuations are primarily driven by the limited supply of ethylene C2 type, a key feedstock for EO production. Furthermore, Sanjiang Fine Chemicals, a significant EO producer in China, has temporarily shuttered two plants, each with a capacity of 60,000 tonnes per year, in Zhejiang province due to insufficient ethylene availability.
    • The market is a dynamic and evolving sector, with ongoing developments and trends shaping its landscape. Applications for surfactants span various industries, including agriculture, food and beverage, textiles, and personal care. The market's continuous growth can be attributed to the increasing demand for these versatile chemicals in various applications, as well as advancements in production technologies and raw material sourcing strategies. Despite the challenges in raw material availability and price volatility, the market remains a significant contributor to the global chemical industry. Companies and researchers are actively exploring alternative raw materials and production methods to mitigate the impact of price fluctuations and ensure a stable supply of surfactants for various applications.

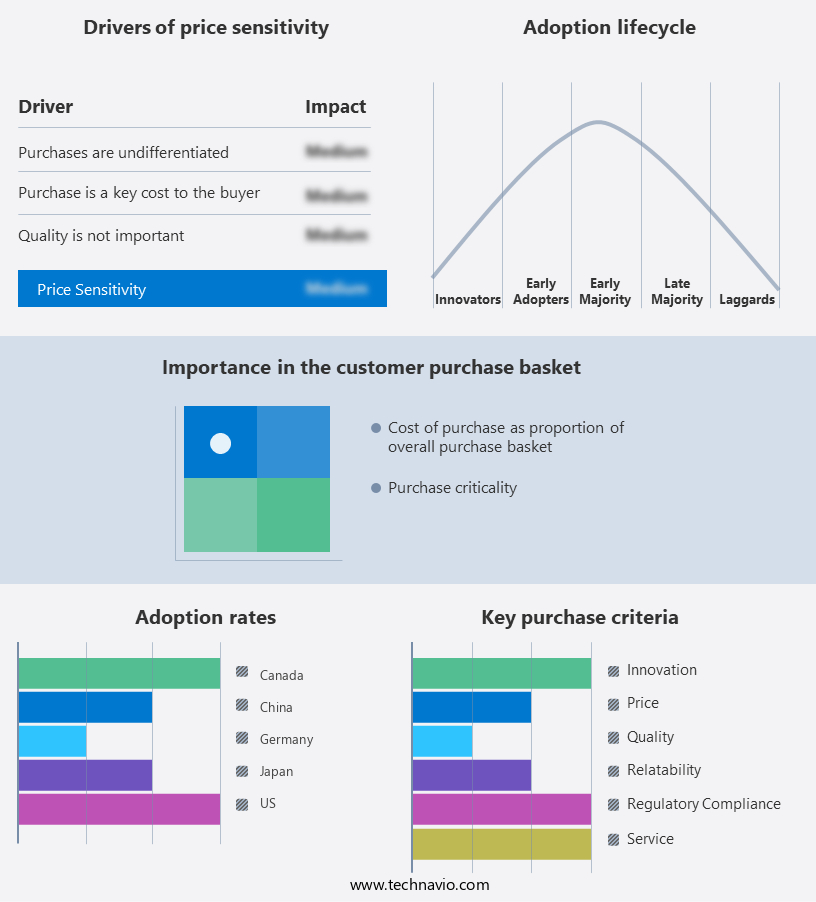
    Exclusive Customer Landscape

    The surfactants market forecasting report includes the adoption lifecycle of the market, covering from the innovator’s stage to the laggard’s stage. It focuses on adoption rates in different regions based on penetration. Furthermore, the surfactants market report also includes key purchase criteria and drivers of price sensitivity to help companies evaluate and develop their market growth analysis strategies.

    Surfactants Market Share by Geography

     Customer Landscape of Surfactants Industry

    Key Companies & Market Insights

    Companies are implementing various strategies, such as strategic alliances, surfactants market forecast, partnerships, mergers and acquisitions, geographical expansion, and product/service launches, to enhance their presence in the industry.

    3B Scientific - This company specializes in the development and distribution of innovative sports products, leveraging advanced technology and research to enhance athlete performance and consumer experience. Their offerings span various categories, including equipment, apparel, and nutrition. By focusing on product quality and consumer needs, they distinguish themselves in the competitive market.

    The industry research and growth report includes detailed analyses of the competitive landscape of the market and information about key companies, including:

    • 3B Scientific
    • AkzoNobel
    • Arkema S.A.
    • Ashland Global Holdings
    • BASF SE
    • Clariant AG
    • Croda International
    • Dow Inc.
    • Evonik Industries
    • Galaxy Surfactants
    • Huntsman Corporation
    • Kao Corporation
    • KLK Oleo
    • Lion Corporation
    • Nouryon
    • Pilot Chemical
    • Sasol
    • Stepan Company
    • Sumitomo Chemical
    • Unilever

    Qualitative and quantitative analysis of companies has been conducted to help clients understand the wider business environment as well as the strengths and weaknesses of key industry players. Data is qualitatively analyzed to categorize companies as pure play, category-focused, industry-focused, and diversified; it is quantitatively analyzed to categorize companies as dominant, leading, strong, tentative, and weak.

    Recent Development and News in Surfactants Market

    • In January 2024, BASF SE, a leading global supplier of chemicals, announced the expansion of its production capacity for alkyl polyglycosides (APG), a type of surfactant, at its Ludwigshafen site in Germany. This expansion aimed to meet the growing demand for sustainable surfactants in various industries (BASF press release, 2024).
    • In March 2024, Dow Inc. And DuPont de Nemours entered into a strategic collaboration to develop innovative surfactant solutions for the agro sciences market. This collaboration combined Dow's surfactant expertise with DuPont's agro sciences capabilities, aiming to create more effective and sustainable agrochemical formulations (Dow Inc. Press release, 2024).
    • In May 2024, Clariant International AG, a Swiss specialty chemical company, completed the acquisition of the specialty additives business of Huntsman Corporation. This acquisition included Huntsman's surfactants and intermediates business, significantly expanding Clariant's product portfolio and market presence in the market (Clariant press release, 2024).
    • In February 2025, Lonza Group AG, a Swiss life sciences company, received regulatory approval from the European Commission for its new production site for nonionic surfactants in Antwerp, Belgium. This state-of-the-art facility is expected to increase Lonza's production capacity and improve its ability to serve customers in the European market (Lonza press release, 2025).

    Research Analyst Overview

    • The market for surfactants continues to evolve, driven by advancements in technology and the expanding application scope across various industries. Silicone surfactants and fatty acid esters are among the key types of surfactants witnessing significant demand due to their unique properties. Silicone surfactants, with their low surface tension and excellent rheological properties, find extensive use in industrial processes, particularly in the production of coatings, adhesives, and personal care products. Their ability to enhance solubilization and reduce surface tension makes them indispensable in various applications. On the other hand, fatty acid esters, derived from renewable resources, are gaining popularity due to their biodegradability and low toxicity.
    • They are extensively used in cleaning formulations, cosmetics, and as emulsifiers in food and pharmaceutical industries. The market for surfactants is expected to grow at a steady pace, with an estimated growth rate of 5% per annum. This growth is attributed to the increasing demand for surfactants in various industries, including agriculture, where they are used as wetting agents and dispersants in agricultural chemicals. Cationic surfactants, with their unique ability to provide stability to dispersions and enhance detergency mechanism, are another crucial segment of the surfactant market. Their application in cleaning formulations, particularly in hard surface cleaners, is on the rise due to their superior performance.
    • The development of application-specific surfactants, such as amphoteric surfactants and polymer surfactants, is a significant trend in the market. These surfactants offer enhanced properties, such as improved foaming properties, critical micelle concentration, and hydrophilic-lipophilic balance, making them suitable for specific applications. Despite the numerous benefits, the use of surfactants is not without challenges. Toxicity evaluation and environmental impact assessment are critical considerations in the surfactant market. The development of eco-friendly surfactants, such as those derived from renewable resources, is a key focus area for researchers and manufacturers. Surfactant mixtures, including alkyl ethoxylates, alkyl sulfates, and fluorinated surfactants, are also gaining popularity due to their ability to provide enhanced performance in various applications.
    • The ongoing research and development in surfactant synthesis, biodegradability assessment, and toxicity evaluation are expected to drive the market's continued growth and evolution.

    Dive into Technavio’s robust research methodology, blending expert interviews, extensive data synthesis, and validated models for unparalleled Surfactants Market insights. See full methodology.

    Market Scope

    Report Coverage

    Details

    Page number

    203

    Base year

    2023

    Historic period

    2018-2022

    Forecast period

    2024-2028

    Growth momentum & CAGR

    Accelerate at a CAGR of 5.23%

    Market growth 2024-2028

    USD 13.2 billion

    Market structure

    Fragmented

    YoY growth 2023-2024(%)

    4.84

    Key countries

    US, Canada, Germany, UK, Italy, France, China, India, Japan, Brazil, Egypt, UAE, Oman, Argentina, KSA, UAE, Brazil, and Rest of World (ROW)

    Competitive landscape

    Leading Companies, Market Positioning of Companies, Competitive Strategies, and Industry Risks

    Request Free Sample

    What are the Key Data Covered in this Surfactants Market Research and Growth Report?

    • CAGR of the Surfactants industry during the forecast period
    • Detailed information on factors that will drive the growth and forecasting between 2024 and 2028
    • Precise estimation of the size of the market and its contribution of the industry in focus to the parent market
    • Accurate predictions about upcoming growth and trends and changes in consumer behaviour
    • Growth of the market across APAC, North America, Europe, South America, and Middle East and Africa
    • Thorough analysis of the market’s competitive landscape and detailed information about companies
    • Comprehensive analysis of factors that will challenge the surfactants market growth of industry companies

    We can help! Our analysts can customize this surfactants market research report to meet your requirements.

    Get in touch

    1 Executive Summary

    • 1.1 Market overview
      • Executive Summary - Chart on Market Overview
      • Executive Summary - Data Table on Market Overview
      • Executive Summary - Chart on Global Market Characteristics
      • Executive Summary - Chart on Market by Geography
      • Executive Summary - Chart on Market Segmentation by Product
      • Executive Summary - Chart on Market Segmentation by Application
      • Executive Summary - Chart on Market Segmentation by Type
      • Executive Summary - Chart on Incremental Growth
      • Executive Summary - Data Table on Incremental Growth
      • Executive Summary - Chart on Company Market Positioning

    2 Market Landscape

    • 2.1 Market ecosystem
      • Parent Market
      • Data Table on - Parent Market
    • 2.2 Market characteristics
      • Market characteristics analysis
    • 2.3 Value chain analysis
      • Value Chain Analysis

    3 Market Sizing

    • 3.1 Market definition
      • Offerings of companies included in the market definition
    • 3.2 Market segment analysis
      • Market segments
    • 3.3 Market size 2023
      • 3.4 Market outlook: Forecast for 2023-2028
        • Chart on Global - Market size and forecast 2023-2028 ($ billion)
        • Data Table on Global - Market size and forecast 2023-2028 ($ billion)
        • Chart on Global Market: Year-over-year growth 2023-2028 (%)
        • Data Table on Global Market: Year-over-year growth 2023-2028 (%)

      4 Historic Market Size

      • 4.1 Global Surfactants Market 2018 - 2022
        • Historic Market Size - Data Table on Global Surfactants Market 2018 - 2022 ($ billion)
      • 4.2 Product segment analysis 2018 - 2022
        • Historic Market Size - Product Segment 2018 - 2022 ($ billion)
      • 4.3 Application segment analysis 2018 - 2022
        • Historic Market Size - Application Segment 2018 - 2022 ($ billion)
      • 4.4 Type segment analysis 2018 - 2022
        • Historic Market Size - Type Segment 2018 - 2022 ($ billion)
      • 4.5 Geography segment analysis 2018 - 2022
        • Historic Market Size - Geography Segment 2018 - 2022 ($ billion)
      • 4.6 Country segment analysis 2018 - 2022
        • Historic Market Size - Country Segment 2018 - 2022 ($ billion)

      5 Five Forces Analysis

      • 5.1 Five forces summary
        • Five forces analysis - Comparison between 2023 and 2028
      • 5.2 Bargaining power of buyers
        • Bargaining power of buyers - Impact of key factors 2023 and 2028
      • 5.3 Bargaining power of suppliers
        • Bargaining power of suppliers - Impact of key factors in 2023 and 2028
      • 5.4 Threat of new entrants
        • Threat of new entrants - Impact of key factors in 2023 and 2028
      • 5.5 Threat of substitutes
        • Threat of substitutes - Impact of key factors in 2023 and 2028
      • 5.6 Threat of rivalry
        • Threat of rivalry - Impact of key factors in 2023 and 2028
      • 5.7 Market condition
        • Chart on Market condition - Five forces 2023 and 2028

      6 Market Segmentation by Product

      • 6.1 Market segments
        • Chart on Product - Market share (2023-2028) (%)
        • Data Table on Product - Market share (2023-2028) (%)
      • 6.2 Comparison by Product
        • Chart on Comparison by Product
        • Data Table on Comparison by Product
      • 6.3 Anionic - Market size and forecast (2023-2028)
        • Chart on Anionic - Market size and forecast (2023-2028) ($ billion)
        • Data Table on Anionic - Market size and forecast (2023-2028) ($ billion)
        • Chart on Anionic - Year-over-year growth (2023-2028) (%)
        • Data Table on Anionic - Year-over-year growth (2023-2028) (%)
      • 6.4 Non-ionic - Market size and forecast (2023-2028)
        • Chart on Non-ionic - Market size and forecast (2023-2028) ($ billion)
        • Data Table on Non-ionic - Market size and forecast (2023-2028) ($ billion)
        • Chart on Non-ionic - Year-over-year growth (2023-2028) (%)
        • Data Table on Non-ionic - Year-over-year growth (2023-2028) (%)
      • 6.5 Cationic - Market size and forecast (2023-2028)
        • Chart on Cationic - Market size and forecast (2023-2028) ($ billion)
        • Data Table on Cationic - Market size and forecast (2023-2028) ($ billion)
        • Chart on Cationic - Year-over-year growth (2023-2028) (%)
        • Data Table on Cationic - Year-over-year growth (2023-2028) (%)
      • 6.6 Amphoteric - Market size and forecast (2023-2028)
        • Chart on Amphoteric - Market size and forecast (2023-2028) ($ billion)
        • Data Table on Amphoteric - Market size and forecast (2023-2028) ($ billion)
        • Chart on Amphoteric - Year-over-year growth (2023-2028) (%)
        • Data Table on Amphoteric - Year-over-year growth (2023-2028) (%)
      • 6.7 Market opportunity by Product
        • Market opportunity by Product ($ billion)
        • Data Table on Market opportunity by Product ($ billion)

      7 Market Segmentation by Application

      • 7.1 Market segments
        • Chart on Application - Market share (2023-2028) (%)
        • Data Table on Application - Market share (2023-2028) (%)
      • 7.2 Comparison by Application
        • Chart on Comparison by Application
        • Data Table on Comparison by Application
      • 7.3 Detergents - Market size and forecast (2023-2028)
        • Chart on Detergents - Market size and forecast (2023-2028) ($ billion)
        • Data Table on Detergents - Market size and forecast (2023-2028) ($ billion)
        • Chart on Detergents - Year-over-year growth (2023-2028) (%)
        • Data Table on Detergents - Year-over-year growth (2023-2028) (%)
      • 7.4 Industrial and institutional cleaning - Market size and forecast (2023-2028)
        • Chart on Industrial and institutional cleaning - Market size and forecast (2023-2028) ($ billion)
        • Data Table on Industrial and institutional cleaning - Market size and forecast (2023-2028) ($ billion)
        • Chart on Industrial and institutional cleaning - Year-over-year growth (2023-2028) (%)
        • Data Table on Industrial and institutional cleaning - Year-over-year growth (2023-2028) (%)
      • 7.5 Food processing - Market size and forecast (2023-2028)
        • Chart on Food processing - Market size and forecast (2023-2028) ($ billion)
        • Data Table on Food processing - Market size and forecast (2023-2028) ($ billion)
        • Chart on Food processing - Year-over-year growth (2023-2028) (%)
        • Data Table on Food processing - Year-over-year growth (2023-2028) (%)
      • 7.6 Personal care - Market size and forecast (2023-2028)
        • Chart on Personal care - Market size and forecast (2023-2028) ($ billion)
        • Data Table on Personal care - Market size and forecast (2023-2028) ($ billion)
        • Chart on Personal care - Year-over-year growth (2023-2028) (%)
        • Data Table on Personal care - Year-over-year growth (2023-2028) (%)
      • 7.7 Others - Market size and forecast (2023-2028)
        • Chart on Others - Market size and forecast (2023-2028) ($ billion)
        • Data Table on Others - Market size and forecast (2023-2028) ($ billion)
        • Chart on Others - Year-over-year growth (2023-2028) (%)
        • Data Table on Others - Year-over-year growth (2023-2028) (%)
      • 7.8 Market opportunity by Application
        • Market opportunity by Application ($ billion)
        • Data Table on Market opportunity by Application ($ billion)

      8 Market Segmentation by Type

      • 8.1 Market segments
        • Chart on Type - Market share (2023-2028) (%)
        • Data Table on Type - Market share (2023-2028) (%)
      • 8.2 Comparison by Type
        • Chart on Comparison by Type
        • Data Table on Comparison by Type
      • 8.3 Synthetic - Market size and forecast (2023-2028)
        • Chart on Synthetic - Market size and forecast (2023-2028) ($ billion)
        • Data Table on Synthetic - Market size and forecast (2023-2028) ($ billion)
        • Chart on Synthetic - Year-over-year growth (2023-2028) (%)
        • Data Table on Synthetic - Year-over-year growth (2023-2028) (%)
      • 8.4 Bio-based - Market size and forecast (2023-2028)
        • Chart on Bio-based - Market size and forecast (2023-2028) ($ billion)
        • Data Table on Bio-based - Market size and forecast (2023-2028) ($ billion)
        • Chart on Bio-based - Year-over-year growth (2023-2028) (%)
        • Data Table on Bio-based - Year-over-year growth (2023-2028) (%)
      • 8.5 Market opportunity by Type
        • Market opportunity by Type ($ billion)
        • Data Table on Market opportunity by Type ($ billion)

      9 Market Segmentation by End-User

      • 9.1 Market segments
        • Chart on End-User - Market share (2023-2028) (%)
        • Data Table on End-User - Market share (2023-2028) (%)
      • 9.2 Comparison by End-User
        • Chart on Comparison by End-User
        • Data Table on Comparison by End-User
      • 9.3 Consumer Goods - Market size and forecast (2023-2028)
        • Chart on Consumer Goods - Market size and forecast (2023-2028) ($ billion)
        • Data Table on Consumer Goods - Market size and forecast (2023-2028) ($ billion)
        • Chart on Consumer Goods - Year-over-year growth (2023-2028) (%)
        • Data Table on Consumer Goods - Year-over-year growth (2023-2028) (%)
      • 9.4 Industrial - Market size and forecast (2023-2028)
        • Chart on Industrial - Market size and forecast (2023-2028) ($ billion)
        • Data Table on Industrial - Market size and forecast (2023-2028) ($ billion)
        • Chart on Industrial - Year-over-year growth (2023-2028) (%)
        • Data Table on Industrial - Year-over-year growth (2023-2028) (%)
      • 9.5 Automotive - Market size and forecast (2023-2028)
        • Chart on Automotive - Market size and forecast (2023-2028) ($ billion)
        • Data Table on Automotive - Market size and forecast (2023-2028) ($ billion)
        • Chart on Automotive - Year-over-year growth (2023-2028) (%)
        • Data Table on Automotive - Year-over-year growth (2023-2028) (%)
      • 9.6 Textiles - Market size and forecast (2023-2028)
        • Chart on Textiles - Market size and forecast (2023-2028) ($ billion)
        • Data Table on Textiles - Market size and forecast (2023-2028) ($ billion)
        • Chart on Textiles - Year-over-year growth (2023-2028) (%)
        • Data Table on Textiles - Year-over-year growth (2023-2028) (%)
      • 9.7 Market opportunity by End-User
        • Market opportunity by End-User ($ billion)
        • Data Table on Market opportunity by End-User ($ billion)

      10 Customer Landscape

      • 10.1 Customer landscape overview
        • Analysis of price sensitivity, lifecycle, customer purchase basket, adoption rates, and purchase criteria

      11 Geographic Landscape

      • 11.1 Geographic segmentation
        • Chart on Market share by geography 2023-2028 (%)
        • Data Table on Market share by geography 2023-2028 (%)
      • 11.2 Geographic comparison
        • Chart on Geographic comparison
        • Data Table on Geographic comparison
      • 11.3 APAC - Market size and forecast 2023-2028
        • Chart on APAC - Market size and forecast 2023-2028 ($ billion)
        • Data Table on APAC - Market size and forecast 2023-2028 ($ billion)
        • Chart on APAC - Year-over-year growth 2023-2028 (%)
        • Data Table on APAC - Year-over-year growth 2023-2028 (%)
      • 11.4 North America - Market size and forecast 2023-2028
        • Chart on North America - Market size and forecast 2023-2028 ($ billion)
        • Data Table on North America - Market size and forecast 2023-2028 ($ billion)
        • Chart on North America - Year-over-year growth 2023-2028 (%)
        • Data Table on North America - Year-over-year growth 2023-2028 (%)
      • 11.5 Europe - Market size and forecast 2023-2028
        • Chart on Europe - Market size and forecast 2023-2028 ($ billion)
        • Data Table on Europe - Market size and forecast 2023-2028 ($ billion)
        • Chart on Europe - Year-over-year growth 2023-2028 (%)
        • Data Table on Europe - Year-over-year growth 2023-2028 (%)
      • 11.6 South America - Market size and forecast 2023-2028
        • Chart on South America - Market size and forecast 2023-2028 ($ billion)
        • Data Table on South America - Market size and forecast 2023-2028 ($ billion)
        • Chart on South America - Year-over-year growth 2023-2028 (%)
        • Data Table on South America - Year-over-year growth 2023-2028 (%)
      • 11.7 Middle East and Africa - Market size and forecast 2023-2028
        • Chart on Middle East and Africa - Market size and forecast 2023-2028 ($ billion)
        • Data Table on Middle East and Africa - Market size and forecast 2023-2028 ($ billion)
        • Chart on Middle East and Africa - Year-over-year growth 2023-2028 (%)
        • Data Table on Middle East and Africa - Year-over-year growth 2023-2028 (%)
      • 11.8 US - Market size and forecast 2023-2028
        • Chart on US - Market size and forecast 2023-2028 ($ billion)
        • Data Table on US - Market size and forecast 2023-2028 ($ billion)
        • Chart on US - Year-over-year growth 2023-2028 (%)
        • Data Table on US - Year-over-year growth 2023-2028 (%)
      • 11.9 China - Market size and forecast 2023-2028
        • Chart on China - Market size and forecast 2023-2028 ($ billion)
        • Data Table on China - Market size and forecast 2023-2028 ($ billion)
        • Chart on China - Year-over-year growth 2023-2028 (%)
        • Data Table on China - Year-over-year growth 2023-2028 (%)
      • 11.10 Germany - Market size and forecast 2023-2028
        • Chart on Germany - Market size and forecast 2023-2028 ($ billion)
        • Data Table on Germany - Market size and forecast 2023-2028 ($ billion)
        • Chart on Germany - Year-over-year growth 2023-2028 (%)
        • Data Table on Germany - Year-over-year growth 2023-2028 (%)
      • 11.11 Japan - Market size and forecast 2023-2028
        • Chart on Japan - Market size and forecast 2023-2028 ($ billion)
        • Data Table on Japan - Market size and forecast 2023-2028 ($ billion)
        • Chart on Japan - Year-over-year growth 2023-2028 (%)
        • Data Table on Japan - Year-over-year growth 2023-2028 (%)
      • 11.12 Canada - Market size and forecast 2023-2028
        • Chart on Canada - Market size and forecast 2023-2028 ($ billion)
        • Data Table on Canada - Market size and forecast 2023-2028 ($ billion)
        • Chart on Canada - Year-over-year growth 2023-2028 (%)
        • Data Table on Canada - Year-over-year growth 2023-2028 (%)
      • 11.13 Market opportunity by geography
        • Market opportunity by geography ($ billion)
        • Data Tables on Market opportunity by geography ($ billion)
      • 11.14 UK - Market size and forecast (2023-2028)
        • Chart on UK - Market size and forecast (2023-2028) ($ billion)
        • Data Table on UK - Market size and forecast (2023-2028) ($ billion)
        • Chart on UK - Year-over-year growth (2023-2028) (%)
        • Data Table on UK - Year-over-year growth (2023-2028) (%)
      • 11.15 Italy - Market size and forecast (2023-2028)
        • Chart on Italy - Market size and forecast (2023-2028) ($ billion)
        • Data Table on Italy - Market size and forecast (2023-2028) ($ billion)
        • Chart on Italy - Year-over-year growth (2023-2028) (%)
        • Data Table on Italy - Year-over-year growth (2023-2028) (%)
      • 11.16 France - Market size and forecast (2023-2028)
        • Chart on France - Market size and forecast (2023-2028) ($ billion)
        • Data Table on France - Market size and forecast (2023-2028) ($ billion)
        • Chart on France - Year-over-year growth (2023-2028) (%)
        • Data Table on France - Year-over-year growth (2023-2028) (%)
      • 11.17 India - Market size and forecast (2023-2028)
        • Chart on India - Market size and forecast (2023-2028) ($ billion)
        • Data Table on India - Market size and forecast (2023-2028) ($ billion)
        • Chart on India - Year-over-year growth (2023-2028) (%)
        • Data Table on India - Year-over-year growth (2023-2028) (%)
      • 11.18 Brazil - Market size and forecast (2023-2028)
        • Chart on Brazil - Market size and forecast (2023-2028) ($ billion)
        • Data Table on Brazil - Market size and forecast (2023-2028) ($ billion)
        • Chart on Brazil - Year-over-year growth (2023-2028) (%)
        • Data Table on Brazil - Year-over-year growth (2023-2028) (%)
      • 11.19 Egypt - Market size and forecast (2023-2028)
        • Chart on Egypt - Market size and forecast (2023-2028) ($ billion)
        • Data Table on Egypt - Market size and forecast (2023-2028) ($ billion)
        • Chart on Egypt - Year-over-year growth (2023-2028) (%)
        • Data Table on Egypt - Year-over-year growth (2023-2028) (%)
      • 11.20 UAE - Market size and forecast (2023-2028)
        • Chart on UAE - Market size and forecast (2023-2028) ($ billion)
        • Data Table on UAE - Market size and forecast (2023-2028) ($ billion)
        • Chart on UAE - Year-over-year growth (2023-2028) (%)
        • Data Table on UAE - Year-over-year growth (2023-2028) (%)
      • 11.21 Oman - Market size and forecast (2023-2028)
        • Chart on Oman - Market size and forecast (2023-2028) ($ billion)
        • Data Table on Oman - Market size and forecast (2023-2028) ($ billion)
        • Chart on Oman - Year-over-year growth (2023-2028) (%)
        • Data Table on Oman - Year-over-year growth (2023-2028) (%)
      • 11.22 Argentina - Market size and forecast (2023-2028)
        • Chart on Argentina - Market size and forecast (2023-2028) ($ billion)
        • Data Table on Argentina - Market size and forecast (2023-2028) ($ billion)
        • Chart on Argentina - Year-over-year growth (2023-2028) (%)
        • Data Table on Argentina - Year-over-year growth (2023-2028) (%)
      • 11.23 KSA - Market size and forecast (2023-2028)
        • Chart on KSA - Market size and forecast (2023-2028) ($ billion)
        • Data Table on KSA - Market size and forecast (2023-2028) ($ billion)
        • Chart on KSA - Year-over-year growth (2023-2028) (%)
        • Data Table on KSA - Year-over-year growth (2023-2028) (%)
      • 11.24 UAE - Market size and forecast (2023-2028)
        • Chart on UAE - Market size and forecast (2023-2028) ($ billion)
        • Data Table on UAE - Market size and forecast (2023-2028) ($ billion)
        • Chart on UAE - Year-over-year growth (2023-2028) (%)
        • Data Table on UAE - Year-over-year growth (2023-2028) (%)
      • 11.25 Brazil - Market size and forecast (2023-2028)
        • Chart on Brazil - Market size and forecast (2023-2028) ($ billion)
        • Data Table on Brazil - Market size and forecast (2023-2028) ($ billion)
        • Chart on Brazil - Year-over-year growth (2023-2028) (%)
        • Data Table on Brazil - Year-over-year growth (2023-2028) (%)
      • 11.26 Rest of World (ROW) - Market size and forecast (2023-2028)
        • Chart on Rest of World (ROW) - Market size and forecast (2023-2028) ($ billion)
        • Data Table on Rest of World (ROW) - Market size and forecast (2023-2028) ($ billion)
        • Chart on Rest of World (ROW) - Year-over-year growth (2023-2028) (%)
        • Data Table on Rest of World (ROW) - Year-over-year growth (2023-2028) (%)

      12 Drivers, Challenges, and Opportunity/Restraints

      • 12.1 Market drivers
        • 12.2 Market challenges
          • 12.3 Impact of drivers and challenges
            • Impact of drivers and challenges in 2023 and 2028
          • 12.4 Market opportunities/restraints

            13 Competitive Landscape

            • 13.1 Overview
              • 13.2 Competitive Landscape
                • Overview on criticality of inputs and factors of differentiation
              • 13.3 Landscape disruption
                • Overview on factors of disruption
              • 13.4 Industry risks
                • Impact of key risks on business

              14 Competitive Analysis

              • 14.1 Companies profiled
                • Companies covered
              • 14.2 Market positioning of companies
                • Matrix on companies position and classification
              • 3B Scientific
                • 3B Scientific - Overview
                • 3B Scientific - Product / Service
                • 3B Scientific - Key offerings
              • 14.4 AkzoNobel
                • AkzoNobel - Overview
                • AkzoNobel - Product / Service
                • AkzoNobel - Key offerings
              • 14.5 Arkema S.A.
                • Arkema S.A. - Overview
                • Arkema S.A. - Product / Service
                • Arkema S.A. - Key offerings
              • 14.6 Ashland Global Holdings
                • Ashland Global Holdings - Overview
                • Ashland Global Holdings - Product / Service
                • Ashland Global Holdings - Key offerings
              • 14.7 BASF SE
                • BASF SE - Overview
                • BASF SE - Product / Service
                • BASF SE - Key offerings
              • 14.8 Clariant AG
                • Clariant AG - Overview
                • Clariant AG - Product / Service
                • Clariant AG - Key offerings
              • 14.9 Croda International
                • Croda International - Overview
                • Croda International - Product / Service
                • Croda International - Key offerings
              • 14.10 Dow Inc.
                • Dow Inc. - Overview
                • Dow Inc. - Product / Service
                • Dow Inc. - Key offerings
              • 14.11 Evonik Industries
                • Evonik Industries - Overview
                • Evonik Industries - Product / Service
                • Evonik Industries - Key offerings
              • 14.12 Galaxy Surfactants
                • Galaxy Surfactants - Overview
                • Galaxy Surfactants - Product / Service
                • Galaxy Surfactants - Key offerings
              • 14.13 Huntsman Corporation
                • Huntsman Corporation - Overview
                • Huntsman Corporation - Product / Service
                • Huntsman Corporation - Key offerings
              • 14.14 Kao Corporation
                • Kao Corporation - Overview
                • Kao Corporation - Product / Service
                • Kao Corporation - Key offerings
              • 14.15 KLK Oleo
                • KLK Oleo - Overview
                • KLK Oleo - Product / Service
                • KLK Oleo - Key offerings
              • 14.16 Lion Corporation
                • Lion Corporation - Overview
                • Lion Corporation - Product / Service
                • Lion Corporation - Key offerings
              • 14.17 Nouryon
                • Nouryon - Overview
                • Nouryon - Product / Service
                • Nouryon - Key offerings
              • 14.18 Pilot Chemical
                • Pilot Chemical - Overview
                • Pilot Chemical - Product / Service
                • Pilot Chemical - Key offerings
              • 14.19 Sasol
                • Sasol - Overview
                • Sasol - Product / Service
                • Sasol - Key offerings
              • 14.20 Stepan Company
                • Stepan Company - Overview
                • Stepan Company - Product / Service
                • Stepan Company - Key offerings
              • 14.21 Sumitomo Chemical
                • Sumitomo Chemical - Overview
                • Sumitomo Chemical - Product / Service
                • Sumitomo Chemical - Key offerings
              • 14.22 Unilever
                • Unilever - Overview
                • Unilever - Product / Service
                • Unilever - Key offerings
              • 14.23 Abitec
                • Abitec - Overview
                • Abitec - Product / Service
                • Abitec - Key offerings
              • 14.24 Arkema Group
                • Arkema Group - Overview
                • Arkema Group - Product / Service
                • Arkema Group - Key offerings
              • 14.25 BASF SE
                • BASF SE - Overview
                • BASF SE - Product / Service
                • BASF SE - Key offerings
              • 14.26 Bo International
                • Bo International - Overview
                • Bo International - Product / Service
                • Bo International - Key offerings
              • 14.27 Clariant International Ltd.
                • Clariant International Ltd. - Overview
                • Clariant International Ltd. - Product / Service
                • Clariant International Ltd. - Key offerings
              • 14.28 Croda International Plc
                • Croda International Plc - Overview
                • Croda International Plc - Product / Service
                • Croda International Plc - Key offerings
              • 14.29 Evonik Industries AG
                • Evonik Industries AG - Overview
                • Evonik Industries AG - Product / Service
                • Evonik Industries AG - Key offerings
              • 14.30 Galaxy Surfactants Ltd.
                • Galaxy Surfactants Ltd. - Overview
                • Galaxy Surfactants Ltd. - Product / Service
                • Galaxy Surfactants Ltd. - Key offerings
              • 14.31 Indorama Ventures Public Co. Ltd.
                • Indorama Ventures Public Co. Ltd. - Overview
                • Indorama Ventures Public Co. Ltd. - Product / Service
                • Indorama Ventures Public Co. Ltd. - Key offerings
              • 14.32 Innospec Inc.
                • Innospec Inc. - Overview
                • Innospec Inc. - Product / Service
                • Innospec Inc. - Key offerings
              • 14.33 Jiangsu WanQi Biotechnology Co. Ltd.
                • Jiangsu WanQi Biotechnology Co. Ltd. - Overview
                • Jiangsu WanQi Biotechnology Co. Ltd. - Product / Service
                • Jiangsu WanQi Biotechnology Co. Ltd. - Key offerings
              • 14.34 Kao Corp.
                • Kao Corp. - Overview
                • Kao Corp. - Product / Service
                • Kao Corp. - Key offerings
              • 14.35 Kensing LLC
                • Kensing LLC - Overview
                • Kensing LLC - Product / Service
                • Kensing LLC - Key offerings
              • 14.36 KLK Oleo
                • KLK Oleo - Overview
                • KLK Oleo - Product / Service
                • KLK Oleo - Key offerings
              • 14.37 Lonza Group Ltd.
                • Lonza Group Ltd. - Overview
                • Lonza Group Ltd. - Product / Service
                • Lonza Group Ltd. - Key offerings
              • 14.38 NutraSkin USA
                • NutraSkin USA - Overview
                • NutraSkin USA - Product / Service
                • NutraSkin USA - Key offerings
              • 14.39 Pacmoore Products Inc.
                • Pacmoore Products Inc. - Overview
                • Pacmoore Products Inc. - Product / Service
                • Pacmoore Products Inc. - Key offerings
              • 14.40 PCC Rokita SA
                • PCC Rokita SA - Overview
                • PCC Rokita SA - Product / Service
                • PCC Rokita SA - Key offerings
              • 14.41 Sirius International BV
                • Sirius International BV - Overview
                • Sirius International BV - Product / Service
                • Sirius International BV - Key offerings
              • 14.42 Solvay SA
                • Solvay SA - Overview
                • Solvay SA - Product / Service
                • Solvay SA - Key offerings
              • 14.43 Stepan Co.
                • Stepan Co. - Overview
                • Stepan Co. - Product / Service
                • Stepan Co. - Key offerings

              15 Appendix

              • 15.1 Scope of the report
                • 15.2 Inclusions and exclusions checklist
                  • Inclusions checklist
                  • Exclusions checklist
                • 15.3 Currency conversion rates for US$
                  • Currency conversion rates for US$
                • 15.4 Research methodology
                  • Research methodology
                • 15.5 Data procurement
                  • Information sources
                • 15.6 Data validation
                  • Data validation
                • 15.7 Validation techniques employed for market sizing
                  • Validation techniques employed for market sizing
                • 15.8 Data synthesis
                  • Data synthesis
                • 15.9 360 degree market analysis
                  • 360 degree market analysis
                • 15.10 List of abbreviations
                  • List of abbreviations

                Research Methodology

                Technavio presents a detailed picture of the market by way of study, synthesis, and summation of data from multiple sources. The analysts have presented the various facets of the market with a particular focus on identifying the key industry influencers. The data thus presented is comprehensive, reliable, and the result of extensive research, both primary and secondary.

                INFORMATION SOURCES

                Primary sources

                • Manufacturers and suppliers
                • Channel partners
                • Industry experts
                • Strategic decision makers

                Secondary sources

                • Industry journals and periodicals
                • Government data
                • Financial reports of key industry players
                • Historical data
                • Press releases

                DATA ANALYSIS

                Data Synthesis

                • Collation of data
                • Estimation of key figures
                • Analysis of derived insights

                Data Validation

                • Triangulation with data models
                • Reference against proprietary databases
                • Corroboration with industry experts

                REPORT WRITING

                Qualitative

                • Market drivers
                • Market challenges
                • Market trends
                • Five forces analysis

                Quantitative

                • Market size and forecast
                • Market segmentation
                • Geographical insights
                • Competitive landscape

                Interested in this report?

                Get your sample now to see our research methodology and insights!

                Download Now

                Frequently Asked Questions

                Surfactants market growth will increase by $ 13.2 bn during 2024-2028.

                The Surfactants market is expected to grow at a CAGR of 5.23% during 2024-2028.

                Surfactants market is segmented by Product( Anionic, Non-ionic, Cationic, Amphoteric) Application( Detergents, Industrial and institutional cleaning, Food processing, Personal care, Others) Type( Synthetic, Bio-based, North America, MEA, South America)

                3B Scientific, AkzoNobel, Arkema S.A., Ashland Global Holdings, BASF SE, Clariant AG, Croda International, Dow Inc., Evonik Industries, Galaxy Surfactants, Huntsman Corporation, Kao Corporation, KLK Oleo, Lion Corporation, Nouryon, Pilot Chemical, Sasol, Stepan Company, Sumitomo Chemical, Unilever are a few of the key vendors in the Surfactants market.

                APAC will register the highest growth rate of 43% among the other regions. Therefore, the Surfactants market in APAC is expected to garner significant business opportunities for the vendors during the forecast period.

                US, Canada, Germany, UK, Italy, France, China, India, Japan, Brazil, Egypt, UAE, Oman, Argentina, KSA, UAE, Brazil, Rest of World (ROW)

                • Growing demand for personal care productsThe demand for surfactants in personal care applications is growing due to the increasing use of cosmetics and personal care products such as hair care is the driving factor this market.
                • skin care is the driving factor this market.
                • and baby care products. Surfactants clean and produce foam in shampoos is the driving factor this market.
                • shower gels is the driving factor this market.
                • and hair conditioners. The mild shampoos with surfactants are gentle on the skin. Compatible skin surfactants function as emulsifiers is the driving factor this market.
                • and they stabilize the oil droplets or water in lotions and creams. These emulsions in sunscreen and skincare cosmetics are absorbed quickly by the skin and do not cause a greasy and shiny film on the skin's surface. They also do not leave grease spots on the clothing. In lipstick and make-up is the driving factor this market.
                • surfactants are mainly used in the dispersion of color pigments. They also help in dispersing perfumes in aftershaves is the driving factor this market.
                • toilet water is the driving factor this market.
                • hair lotions is the driving factor this market.
                • and shaving creams. Hence is the driving factor this market.
                • the growing demand for personal care products is expected to boost the demand for surfactants and thereby expected to foster the growth of the global surfactants market during the forecast period. is the driving factor this market.

                The Surfactants market vendors should focus on grabbing business opportunities from the Anionic segment as it accounted for the largest market share in the base year.
                RIA - Research AI Assistant
                Ask RIA