Surgical Navigation Systems Market Analysis, Size, and Forecast 2024-2028: North America (US and Canada), Europe (France, Germany, Italy, UK), Asia (China), and Rest of World (ROW)

Surgical Navigation Systems Market Analysis, Size, and Forecast 2024-2028:
North America (US and Canada), Europe (France, Germany, Italy, UK), Asia (China), and Rest of World (ROW)

Published: Jan 2024 164 Pages SKU: IRTNTR77244

Market Overview at a Glance

$580.92 Mn
Market Opportunity
6.92%
CAGR
5.83
YoY growth 2023-2024(%)

Surgical Navigation Systems Market Size 2024-2028

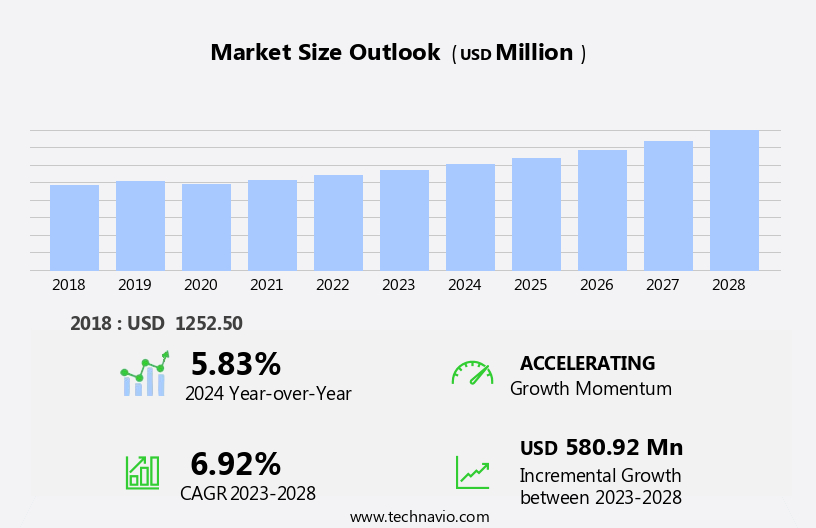
The surgical navigation systems market size is forecast to increase by USD 580.92 million, at a CAGR of 6.92% between 2023 and 2028.

  • The market is driven by the high prevalence of cardiovascular diseases (CVD) and ongoing technological advancements. The increasing incidence of CVDs necessitates the use of advanced surgical navigation systems to enhance precision and improve patient outcomes. These systems enable surgeons to visualize and navigate complex anatomies, leading to reduced invasiveness and faster recovery times. However, the high initial cost for acquiring surgical navigation systems poses a significant challenge for market growth. The substantial investment required for purchasing and implementing these systems may deter some healthcare providers, particularly smaller facilities, from adopting them.
  • Despite this obstacle, companies can capitalize on the market's potential by focusing on cost-effective solutions, collaborating with healthcare providers to offer flexible financing options, and demonstrating the long-term cost savings and improved patient outcomes associated with surgical navigation systems.

What will be the Size of the Surgical Navigation Systems Market during the forecast period?

Surgical Navigation Systems Market Size

Explore in-depth regional segment analysis with market size data - historical 2018-2022 and forecasts 2024-2028 - in the full report.  
Request Free Sample

The market continues to evolve, driven by advancements in technology and the increasing demand for precision and minimally invasive procedures. Anatomical modeling and image fusion algorithms play a crucial role in preoperative planning, enabling surgeons to visualize and plan complex surgeries with greater accuracy. Computer-assisted surgery, including neurosurgical navigation and electrode placement guidance, benefits from these tools, ensuring bone registration accuracy and reducing calibration procedures. Surgical workflow efficiency is enhanced through the integration of ultrasound, depth perception enhancement, and computed tomography guidance. Augmented reality overlay and laser guidance systems provide real-time visualization, while intraoperative imaging and instrument tracking offer precise navigation during surgery.

Surgical robotics and virtual reality simulation are gaining popularity, leveraging sensor fusion techniques, fluorescence guidance, and real-time tracking for enhanced precision. Intraoperative imaging and data integration platforms facilitate surgical trajectory planning and error reduction, further improving surgical outcomes. The market dynamics remain continuous and evolving, with ongoing research and development in areas such as tissue deformation compensation, radiation therapy integration, and haptic feedback. These advancements contribute to the growing adoption of surgical navigation systems across various sectors, including orthopedic and neurosurgery.

How is this Surgical Navigation Systems Industry segmented?

The surgical navigation systems industry research report provides comprehensive data (region-wise segment analysis), with forecasts and estimates in "USD million" for the period 2024-2028, as well as historical data from 2018-2022 for the following segments.

  • Application
    • Neurology
    • Orthopedic
    • ENT
    • Dental
    • Spinal
    • Cardiac
    • Urology
    • Oncology
    • Others
  • Technology
    • Electromagnetic
    • Optical
    • Hybrid
    • Fluoroscopy-Based
    • CT-Based
    • Imageless
    • Others
  • End-User
    • Hospitals
    • ASCs
    • Clinics
    • Research Institutes
  • Component
    • Hardware
    • Software
    • Services
  • Geography
    • North America
      • US
      • Canada
    • Europe
      • France
      • Germany
      • Italy
      • UK
    • Middle East and Africa
      • UAE
    • APAC
      • China
    • South America
      • Brazil
    • Rest of World (ROW)

    By Application Insights

    The neurology segment is estimated to witness significant growth during the forecast period.

    In the medical field, surgical navigation systems have gained significant traction, particularly in the neurology segment. These advanced technologies offer real-time imaging and navigation guidance during intricate neurosurgical procedures, ensuring high precision and accuracy. Neurosurgeons rely on surgical navigation systems to map out tumor locations, delicate nerve pathways, and intricate brain structures, enabling minimally invasive interventions. For instance, during neurosurgical tumor resections, these systems help identify and avoid critical brain regions, thereby minimizing neurological deficits post-surgery. Moreover, surgical navigation systems are indispensable in procedures like deep brain stimulation (DBS) for Parkinson's disease and essential tremor. Image fusion algorithms, preoperative planning, patient positioning systems, and 3D visualization are integral components of these systems, enhancing surgical workflow efficiency and depth perception.

    In addition, real-time tracking, instrument tracking, and sensor fusion techniques contribute to navigation accuracy. Surgical planning software, ultrasound integration, and computed tomography guidance further expand the capabilities of surgical navigation systems. Furthermore, radiation therapy integration and haptic feedback offer enhanced capabilities for neurosurgical procedures. Surgical robotics, virtual reality simulation, and laser guidance systems are also integral parts of these advanced systems, offering minimally invasive and precise surgical interventions. Overall, surgical navigation systems are revolutionizing neurosurgery by providing critical guidance during complex procedures, ensuring optimal patient outcomes.

    Surgical Navigation Systems Market Size

    Request Free Sample

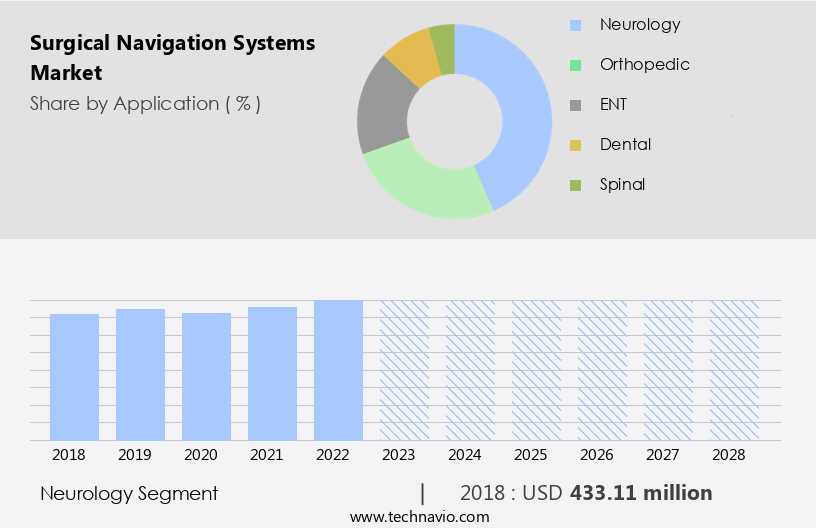
    The Neurology segment was valued at USD 433.11 million in 2018 and showed a gradual increase during the forecast period.

    Regional Analysis

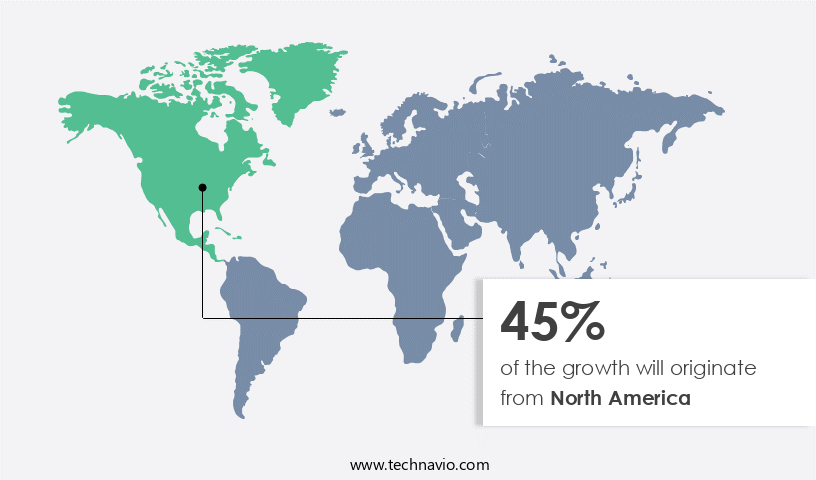
    North America is estimated to contribute 45% to the growth of the global market during the forecast period.Technavio’s analysts have elaborately explained the regional trends and drivers that shape the market during the forecast period.

    Surgical Navigation Systems Market Share by Geography

     Request Free Sample

    The market is witnessing significant growth due to the integration of advanced technologies such as anatomical modeling, image fusion algorithms, and preoperative planning in precision surgery. Minimally invasive procedures are becoming increasingly popular, leading to a demand for surgical navigation systems that enhance workflow efficiency and provide real-time tracking of instruments. Haptic feedback and computer-assisted surgery enable surgeons to perform neurosurgical procedures with greater accuracy, while electrode placement guidance and bone registration accuracy ensure optimal results. Image-guided surgery and patient positioning systems offer 3D visualization and tissue deformation compensation, allowing for more effective radiation therapy integration.

    Surgical planning software, ultrasound integration, and depth perception enhancement are essential components of the market, providing surgeons with valuable data for informed decision-making. Computed tomography guidance, augmented reality overlay, and laser guidance systems offer enhanced precision and accuracy during procedures. Intraoperative imaging and instrument tracking enable real-time monitoring, while surgical robotics and virtual reality simulation provide immersive and harmonious surgical experiences. Sensor fusion techniques, fluorescence guidance, and real-time tracking further improve navigation accuracy. The data integration platform and surgical trajectory planning facilitate seamless data exchange and reduce surgical errors, making surgical navigation systems an indispensable tool in modern healthcare.

    Orthopedic navigation and optical tracking systems cater to the unique needs of orthopedic procedures, further expanding the market's scope. The integration of these advanced technologies is driving the market, with North America holding a significant share due to the high prevalence of chronic disorders such as diabetes and cardiovascular diseases.

    Market Dynamics

    Our researchers analyzed the data with 2023 as the base year, along with the key drivers, trends, and challenges. A holistic analysis of drivers will help companies refine their marketing strategies to gain a competitive advantage.

    What are the key market drivers leading to the rise in the adoption of Surgical Navigation Systems Industry?

    • The high prevalence of cardiovascular diseases (CVD) serves as the primary driver for the market's growth. 

    • Cardiovascular diseases (CVD) are a significant global health concern, accounting for approximately one-third of annual worldwide deaths, according to the World Health Organization. In the US, as reported by the Centers for Disease Control and Prevention (CDC), heart disease claims around 610,000 lives each year, with about 790,000 Americans experiencing a heart attack, of which nearly 580,000 are first-time occurrences and 210,000 are recurrent. To enhance precision in surgical procedures for treating CVD, advanced technologies like surgical navigation systems are increasingly being adopted.
    • These systems utilize anatomical modeling, image fusion algorithms, and preoperative planning to facilitate minimally invasive surgeries, improving surgical workflow efficiency and accuracy. Additionally, haptic feedback and computer-assisted surgery technologies further refine the surgical experience, ensuring harmonious interaction between the surgeon and the system. Neurosurgical navigation systems are a prime application of these advanced technologies, enabling surgeons to navigate complex anatomical structures with greater accuracy and confidence.

    What are the market trends shaping the Surgical Navigation Systems Industry?

    • Surgical navigation systems are experiencing significant technological advancements, which is currently a prominent trend in the medical industry. These innovative systems enhance the precision and effectiveness of surgical procedures.

    • Surgical navigation systems are revolutionizing the medical field with advanced technologies that enhance precision and optimize surgical procedures. These systems leverage electrode placement guidance, bone registration accuracy, and calibration procedures to ensure accurate and efficient surgical interventions. The integration of surgical simulation, image-guided surgery, patient positioning systems, 3D visualization, tissue deformation compensation, and radiation therapy integration is transforming the landscape of various medical specialties. One significant technological advancement is the incorporation of augmented reality (AR) and virtual reality (VR) capabilities into surgical navigation systems. AR technology provides surgeons with real-time imaging data overlay, offering enhanced spatial orientation and precise anatomical guidance during procedures.
    • In orthopedic surgeries, AR-assisted navigation systems enable detailed visualization of bone structures and implant positioning, reducing the risk of postoperative complications and improving the accuracy of joint replacement procedures. Moreover, ongoing advancements in surgical navigation systems are driving innovation and improving patient outcomes across multiple medical specialties. The market is expected to continue growing, as healthcare providers seek to provide the most advanced and precise surgical interventions possible. With the integration of advanced technologies, surgical navigation systems are becoming an essential tool in modern healthcare, transforming the way surgeons approach complex procedures and ultimately improving patient care.

    What challenges does the Surgical Navigation Systems Industry face during its growth?

    • The significant upfront expense associated with procuring surgical navigation systems poses a substantial challenge to the industry's growth trajectory. 

    • Surgical navigation systems, which incorporate advanced technologies such as surgical planning software, ultrasound integration, depth perception enhancement, computed tomography guidance, augmented reality overlay, laser guidance systems, intraoperative imaging, and instrument tracking, have gained significant attention in the healthcare industry due to their potential to enhance surgical precision and improve patient outcomes. However, the high cost of acquiring and implementing these systems remains a significant barrier to widespread adoption. The substantial investment required for hardware, software, training, and infrastructure upgrades can strain the financial resources of hospitals and surgical facilities.
    • Furthermore, the integration of technologies like ultrasound and computed tomography guidance, as well as the implementation of immersive and harmonious surgical robotics, can add to the overall cost. Despite these challenges, the potential benefits of surgical navigation systems, including improved accuracy, reduced operative time, and enhanced patient safety, continue to drive demand for these advanced technologies in healthcare settings.

    Exclusive Customer Landscape

    The surgical navigation systems market forecasting report includes the adoption lifecycle of the market, covering from the innovator’s stage to the laggard’s stage. It focuses on adoption rates in different regions based on penetration. Furthermore, the surgical navigation systems market report also includes key purchase criteria and drivers of price sensitivity to help companies evaluate and develop their market growth analysis strategies.
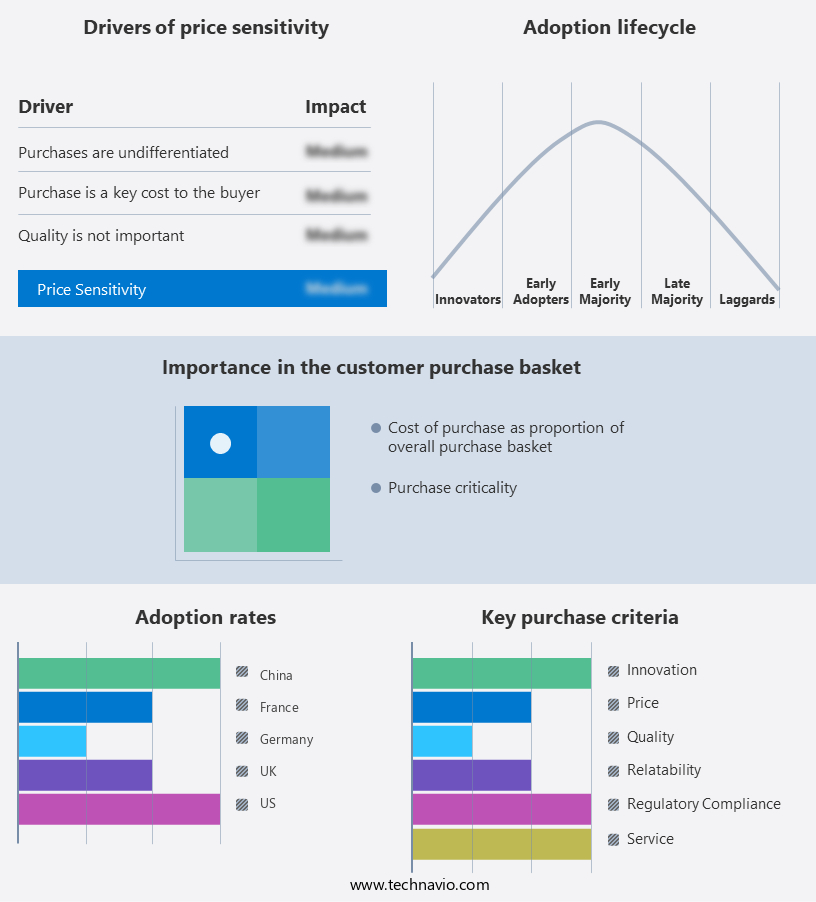
    Surgical Navigation Systems Market Share by Geography

     Customer Landscape

    Key Companies & Market Insights

    Companies are implementing various strategies, such as strategic alliances, surgical navigation systems market forecast, partnerships, mergers and acquisitions, geographical expansion, and product/service launches, to enhance their presence in the industry.

    B.Braun SE - The company specializes in providing surgical navigation systems, including the AMPLIVISION system, which enables surgeons to perform procedures efficiently and accurately with customized preferences. This technology enhances surgical precision and reliability, contributing significantly to the medical field.

    The industry research and growth report includes detailed analyses of the competitive landscape of the market and information about key companies, including:

    • B.Braun SE
    • Brainlab AG
    • CASCINATION AG
    • Corin Group Plc
    • Fiagon GmbH
    • General Electric Co.
    • Johnson and Johnson
    • KARL STORZ SE and Co. KG
    • Lexmark International Inc.
    • Medacta International SA
    • Medtronic Plc
    • Navigate Surgical Technologies Inc.
    • OrthAlign Corp.
    • Orthofix Medical Inc.
    • Samsung Electronics Co. Ltd.
    • Siemens AG
    • Smith and Nephew plc
    • Stryker Corp.
    • Zimmer Biomet Holdings Inc.
    • Amplitude Surgical

    Qualitative and quantitative analysis of companies has been conducted to help clients understand the wider business environment as well as the strengths and weaknesses of key industry players. Data is qualitatively analyzed to categorize companies as pure play, category-focused, industry-focused, and diversified; it is quantitatively analyzed to categorize companies as dominant, leading, strong, tentative, and weak.

    Recent Development and News in Surgical Navigation Systems Market

    • In January 2024, Medtronic plc, a leading medical technology, services, and solutions company, announced the U.S. Food and Drug Administration (FDA) clearance for its StealthStation S7 System, an advanced surgical navigation platform designed to enhance precision in spine procedures (Medtronic Press Release, 2024).
    • In March 2024, Stryker Corporation, a global medical technology company, entered into a strategic partnership with Brainlab AG, a leading provider of medical technology solutions, to expand its surgical navigation offerings and enhance its neuro and spine portfolios (Stryker Press Release, 2024).
    • In May 2024, Intuitive Surgical, Inc., a pioneer in robotic-assisted surgery, received FDA clearance for the Ion EndoWrist Stapler, an addition to its da Vinci surgical system, enabling more precise and efficient surgical procedures (Intuitive Surgical Press Release, 2024).
    • In April 2025, Zimmer Biomet Holdings, Inc., a global leader in musculoskeletal healthcare, completed the acquisition of Medtech Surgical, a privately-held company specializing in image-guided surgery and surgical navigation systems, to strengthen its portfolio and expand its presence in the growing image-guided surgery market (Zimmer Biomet Press Release, 2025).

    Research Analyst Overview

    • In the market, image registration metrics play a crucial role in ensuring accurate and effective navigation during complex procedures. User interface design is another significant factor, as intuitive interfaces streamline clinical workflow optimization and enhance surgical technique optimization. Performance benchmarking is essential for assessing system capabilities, while sensor data fusion and error detection mechanisms improve overall system reliability. Preoperative image acquisition requires data privacy safeguards, and training simulation modules enable usability testing and regulatory compliance. Surgical navigation software and hardware components must integrate seamlessly, with safety features and system security prioritized. Intraoperative image analysis and postoperative image review rely on medical image processing and data visualization tools.
    • Registration algorithms and 3D reconstruction algorithms utilize optical tracking technology and computer vision techniques to enhance accuracy. System calibration methods and system maintenance protocols ensure consistent performance, while system integration challenges persist as new technologies emerge. Motion tracking sensors and system integration are key areas of focus for market growth.

    Dive into Technavio’s robust research methodology, blending expert interviews, extensive data synthesis, and validated models for unparalleled Surgical Navigation Systems Market insights. See full methodology.

    Market Scope

    Report Coverage

    Details

    Page number

    164

    Base year

    2023

    Historic period

    2018-2022

    Forecast period

    2024-2028

    Growth momentum & CAGR

    Accelerate at a CAGR of 6.92%

    Market growth 2024-2028

    USD 580.92 million

    Market structure

    Fragmented

    YoY growth 2023-2024(%)

    5.83

    Key countries

    US, Germany, France, UK, China, Canada, Italy, UAE, Brazil, and Rest of World(ROW)

    Competitive landscape

    Leading Companies, Market Positioning of Companies, Competitive Strategies, and Industry Risks

    Request Free Sample

    What are the Key Data Covered in this Surgical Navigation Systems Market Research and Growth Report?

    • CAGR of the Surgical Navigation Systems industry during the forecast period
    • Detailed information on factors that will drive the growth and forecasting between 2024 and 2028
    • Precise estimation of the size of the market and its contribution of the industry in focus to the parent market
    • Accurate predictions about upcoming growth and trends and changes in consumer behaviour
    • Growth of the market across North America, Europe, Asia, and Rest of World (ROW)
    • Thorough analysis of the market’s competitive landscape and detailed information about companies
    • Comprehensive analysis of factors that will challenge the surgical navigation systems market growth of industry companies

    We can help! Our analysts can customize this surgical navigation systems market research report to meet your requirements.

    Get in touch


    1 Executive Summary

    • 1.1 Market overview
      • Exhibit 01: Executive Summary – Chart on Market Overview
      • Exhibit 02: Executive Summary – Data Table on Market Overview
      • Exhibit 03: Executive Summary – Chart on Global Market Characteristics
      • Exhibit 04: Executive Summary – Chart on Market by Geography
      • Exhibit 05: Executive Summary – Chart on Market Segmentation by Application
      • Exhibit 06: Executive Summary – Chart on Market Segmentation by Technology
      • Exhibit 07: Executive Summary – Chart on Incremental Growth
      • Exhibit 08: Executive Summary – Data Table on Incremental Growth
      • Exhibit 09: Executive Summary – Chart on Vendor Market Positioning

    2 Market Landscape

    • 2.1 Market ecosystem
      • Exhibit 10: Parent market
      • Exhibit 11: Market Characteristics

    3 Market Sizing

    • 3.1 Market definition
      • Exhibit 12: Offerings of vendors included in the market definition
    • 3.2 Market segment analysis
      • Exhibit 13: Market segments
    • 3.3 Market size 2023
      • 3.4 Market outlook: Forecast for 2023-2028
        • Exhibit 14: Chart on Global - Market size and forecast 2023-2028 ($ million)
        • Exhibit 15: Data Table on Global - Market size and forecast 2023-2028 ($ million)
        • Exhibit 16: Chart on Global Market: Year-over-year growth 2023-2028 (%)
        • Exhibit 17: Data Table on Global Market: Year-over-year growth 2023-2028 (%)

      4 Historic Market Size

      • 4.1 Global surgical navigation systems market 2018 - 2022
        • Exhibit 18: Historic Market Size – Data Table on global surgical navigation systems market 2018 - 2022 ($ million)
      • 4.2 Application Segment Analysis 2018 - 2022
        • Exhibit 19: Historic Market Size – Application Segment 2018 - 2022 ($ million)
      • 4.3 Technology Segment Analysis 2018 - 2022
        • Exhibit 20: Historic Market Size – Technology Segment 2018 - 2022 ($ million)
      • 4.4 Geography Segment Analysis 2018 - 2022
        • Exhibit 21: Historic Market Size – Geography Segment 2018 - 2022 ($ million)
      • 4.5 Country Segment Analysis 2018 - 2022
        • Exhibit 22: Historic Market Size – Country Segment 2018 - 2022 ($ million)

      5 Five Forces Analysis

      • 5.1 Five forces summary
        • Exhibit 23: Five forces analysis - Comparison between 2023 and 2028
      • 5.2 Bargaining power of buyers
        • Exhibit 24: Chart on Bargaining power of buyers – Impact of key factors 2023 and 2028
      • 5.3 Bargaining power of suppliers
        • Exhibit 25: Bargaining power of suppliers – Impact of key factors in 2023 and 2028
      • 5.4 Threat of new entrants
        • Exhibit 26: Threat of new entrants – Impact of key factors in 2023 and 2028
      • 5.5 Threat of substitutes
        • Exhibit 27: Threat of substitutes – Impact of key factors in 2023 and 2028
      • 5.6 Threat of rivalry
        • Exhibit 28: Threat of rivalry – Impact of key factors in 2023 and 2028
      • 5.7 Market condition
        • Exhibit 29: Chart on Market condition - Five forces 2023 and 2028

      6 Market Segmentation by Application

      • 6.1 Market segments
        • Chart on Application - Market share (2023-2028) (%)
        • Data Table on Application - Market share (2023-2028) (%)
        • Chart on Urology - Market size and forecast (2023-2028) ($ million)
        • Data Table on Urology - Market size and forecast (2023-2028) ($ million)
        • Chart on Urology - Year-over-year growth (2023-2028) (%)
        • Data Table on Urology - Year-over-year growth (2023-2028) (%)
      • 6.2 Comparison by Application
        • Chart on Comparison by Application
        • Data Table on Comparison by Application
        • Chart on Oncology - Market size and forecast (2023-2028) ($ million)
        • Data Table on Oncology - Market size and forecast (2023-2028) ($ million)
        • Chart on Oncology - Year-over-year growth (2023-2028) (%)
        • Data Table on Oncology - Year-over-year growth (2023-2028) (%)
      • 6.3 Neurology - Market size and forecast (2023-2028)
        • Chart on Neurology - Market size and forecast (2023-2028) ($ million)
        • Data Table on Neurology - Market size and forecast (2023-2028) ($ million)
        • Chart on Neurology - Year-over-year growth (2023-2028) (%)
        • Data Table on Neurology - Year-over-year growth (2023-2028) (%)
        • Chart on Others - Market size and forecast (2023-2028) ($ million)
        • Data Table on Others - Market size and forecast (2023-2028) ($ million)
        • Chart on Others - Year-over-year growth (2023-2028) (%)
        • Data Table on Others - Year-over-year growth (2023-2028) (%)
      • 6.4 Orthopedic - Market size and forecast (2023-2028)
        • Chart on Orthopedic - Market size and forecast (2023-2028) ($ million)
        • Data Table on Orthopedic - Market size and forecast (2023-2028) ($ million)
        • Chart on Orthopedic - Year-over-year growth (2023-2028) (%)
        • Data Table on Orthopedic - Year-over-year growth (2023-2028) (%)
        • Market opportunity by Application ($ million)
        • Data Table on Market opportunity by Application ($ million)
      • 6.5 ENT - Market size and forecast (2023-2028)
        • Chart on ENT - Market size and forecast (2023-2028) ($ million)
        • Data Table on ENT - Market size and forecast (2023-2028) ($ million)
        • Chart on ENT - Year-over-year growth (2023-2028) (%)
        • Data Table on ENT - Year-over-year growth (2023-2028) (%)
      • 6.6 Dental - Market size and forecast (2023-2028)
        • Chart on Dental - Market size and forecast (2023-2028) ($ million)
        • Data Table on Dental - Market size and forecast (2023-2028) ($ million)
        • Chart on Dental - Year-over-year growth (2023-2028) (%)
        • Data Table on Dental - Year-over-year growth (2023-2028) (%)
      • 6.7 Spinal - Market size and forecast (2023-2028)
        • Chart on Spinal - Market size and forecast (2023-2028) ($ million)
        • Data Table on Spinal - Market size and forecast (2023-2028) ($ million)
        • Chart on Spinal - Year-over-year growth (2023-2028) (%)
        • Data Table on Spinal - Year-over-year growth (2023-2028) (%)
      • 6.8 Cardiac - Market size and forecast (2023-2028)
        • Chart on Cardiac - Market size and forecast (2023-2028) ($ million)
        • Data Table on Cardiac - Market size and forecast (2023-2028) ($ million)
        • Chart on Cardiac - Year-over-year growth (2023-2028) (%)
        • Data Table on Cardiac - Year-over-year growth (2023-2028) (%)
      • 6.9 - Market size and forecast (2023-2028)
        • Chart on - Market size and forecast (2023-2028) ($ million)
        • Data Table on - Market size and forecast (2023-2028) ($ million)
        • Chart on - Year-over-year growth (2023-2028) (%)
        • Data Table on - Year-over-year growth (2023-2028) (%)

      7 Market Segmentation by Technology

      • 7.1 Market segments
        • Chart on Technology - Market share (2023-2028) (%)
        • Data Table on Technology - Market share (2023-2028) (%)
        • Market opportunity by Technology ($ million)
        • Data Table on Market opportunity by Technology ($ million)
      • 7.2 Comparison by Technology
        • Chart on Comparison by Technology
        • Data Table on Comparison by Technology
      • 7.3 Electromagnetic - Market size and forecast (2023-2028)
        • Chart on Electromagnetic - Market size and forecast (2023-2028) ($ million)
        • Data Table on Electromagnetic - Market size and forecast (2023-2028) ($ million)
        • Chart on Electromagnetic - Year-over-year growth (2023-2028) (%)
        • Data Table on Electromagnetic - Year-over-year growth (2023-2028) (%)
      • 7.4 Optical - Market size and forecast (2023-2028)
        • Chart on Optical - Market size and forecast (2023-2028) ($ million)
        • Data Table on Optical - Market size and forecast (2023-2028) ($ million)
        • Chart on Optical - Year-over-year growth (2023-2028) (%)
        • Data Table on Optical - Year-over-year growth (2023-2028) (%)
      • 7.5 Hybrid - Market size and forecast (2023-2028)
        • Chart on Hybrid - Market size and forecast (2023-2028) ($ million)
        • Data Table on Hybrid - Market size and forecast (2023-2028) ($ million)
        • Chart on Hybrid - Year-over-year growth (2023-2028) (%)
        • Data Table on Hybrid - Year-over-year growth (2023-2028) (%)
      • 7.6 Fluoroscopy-Based - Market size and forecast (2023-2028)
        • Chart on Fluoroscopy-Based - Market size and forecast (2023-2028) ($ million)
        • Data Table on Fluoroscopy-Based - Market size and forecast (2023-2028) ($ million)
        • Chart on Fluoroscopy-Based - Year-over-year growth (2023-2028) (%)
        • Data Table on Fluoroscopy-Based - Year-over-year growth (2023-2028) (%)
      • 7.7 CT-Based - Market size and forecast (2023-2028)
        • Chart on CT-Based - Market size and forecast (2023-2028) ($ million)
        • Data Table on CT-Based - Market size and forecast (2023-2028) ($ million)
        • Chart on CT-Based - Year-over-year growth (2023-2028) (%)
        • Data Table on CT-Based - Year-over-year growth (2023-2028) (%)
      • 7.8 Imageless - Market size and forecast (2023-2028)
        • Chart on Imageless - Market size and forecast (2023-2028) ($ million)
        • Data Table on Imageless - Market size and forecast (2023-2028) ($ million)
        • Chart on Imageless - Year-over-year growth (2023-2028) (%)
        • Data Table on Imageless - Year-over-year growth (2023-2028) (%)
      • 7.9 Others - Market size and forecast (2023-2028)
        • Chart on Others - Market size and forecast (2023-2028) ($ million)
        • Data Table on Others - Market size and forecast (2023-2028) ($ million)
        • Chart on Others - Year-over-year growth (2023-2028) (%)
        • Data Table on Others - Year-over-year growth (2023-2028) (%)

      8 Market Segmentation by End-User

      • 8.1 Market segments
        • Chart on End-User - Market share (2023-2028) (%)
        • Data Table on End-User - Market share (2023-2028) (%)
      • 8.2 Comparison by End-User
        • Chart on Comparison by End-User
        • Data Table on Comparison by End-User
      • 8.3 Hospitals - Market size and forecast (2023-2028)
        • Chart on Hospitals - Market size and forecast (2023-2028) ($ million)
        • Data Table on Hospitals - Market size and forecast (2023-2028) ($ million)
        • Chart on Hospitals - Year-over-year growth (2023-2028) (%)
        • Data Table on Hospitals - Year-over-year growth (2023-2028) (%)
      • 8.4 ASCs - Market size and forecast (2023-2028)
        • Chart on ASCs - Market size and forecast (2023-2028) ($ million)
        • Data Table on ASCs - Market size and forecast (2023-2028) ($ million)
        • Chart on ASCs - Year-over-year growth (2023-2028) (%)
        • Data Table on ASCs - Year-over-year growth (2023-2028) (%)
      • 8.5 Clinics - Market size and forecast (2023-2028)
        • Chart on Clinics - Market size and forecast (2023-2028) ($ million)
        • Data Table on Clinics - Market size and forecast (2023-2028) ($ million)
        • Chart on Clinics - Year-over-year growth (2023-2028) (%)
        • Data Table on Clinics - Year-over-year growth (2023-2028) (%)
      • 8.6 Research Institutes - Market size and forecast (2023-2028)
        • Chart on Research Institutes - Market size and forecast (2023-2028) ($ million)
        • Data Table on Research Institutes - Market size and forecast (2023-2028) ($ million)
        • Chart on Research Institutes - Year-over-year growth (2023-2028) (%)
        • Data Table on Research Institutes - Year-over-year growth (2023-2028) (%)
      • 8.7 Market opportunity by End-User
        • Market opportunity by End-User ($ million)
        • Data Table on Market opportunity by End-User ($ million)

      9 Market Segmentation by Component

      • 9.1 Market segments
        • Chart on Component - Market share (2023-2028) (%)
        • Data Table on Component - Market share (2023-2028) (%)
      • 9.2 Comparison by Component
        • Chart on Comparison by Component
        • Data Table on Comparison by Component
      • 9.3 Hardware - Market size and forecast (2023-2028)
        • Chart on Hardware - Market size and forecast (2023-2028) ($ million)
        • Data Table on Hardware - Market size and forecast (2023-2028) ($ million)
        • Chart on Hardware - Year-over-year growth (2023-2028) (%)
        • Data Table on Hardware - Year-over-year growth (2023-2028) (%)
      • 9.4 Software - Market size and forecast (2023-2028)
        • Chart on Software - Market size and forecast (2023-2028) ($ million)
        • Data Table on Software - Market size and forecast (2023-2028) ($ million)
        • Chart on Software - Year-over-year growth (2023-2028) (%)
        • Data Table on Software - Year-over-year growth (2023-2028) (%)
      • 9.5 Services - Market size and forecast (2023-2028)
        • Chart on Services - Market size and forecast (2023-2028) ($ million)
        • Data Table on Services - Market size and forecast (2023-2028) ($ million)
        • Chart on Services - Year-over-year growth (2023-2028) (%)
        • Data Table on Services - Year-over-year growth (2023-2028) (%)
      • 9.6 Market opportunity by Component
        • Market opportunity by Component ($ million)
        • Data Table on Market opportunity by Component ($ million)

      8 Customer Landscape

      • 8.1 Customer landscape overview
        • Exhibit 74: Analysis of price sensitivity, lifecycle, customer purchase basket, adoption rates, and purchase criteria

      9 Geographic Landscape

      • 9.1 Geographic segmentation
        • Exhibit 75: Chart on Market share by geography 2023-2028 (%)
        • Exhibit 76: Data Table on Market share by geography 2023-2028 (%)
      • 9.2 Geographic comparison
        • Exhibit 77: Chart on Geographic comparison
        • Exhibit 78: Data Table on Geographic comparison
      • 9.3 North America - Market size and forecast 2023-2028
        • Exhibit 79: Chart on North America - Market size and forecast 2023-2028 ($ million)
        • Exhibit 80: Data Table on North America - Market size and forecast 2023-2028 ($ million)
        • Exhibit 81: Chart on North America - Year-over-year growth 2023-2028 (%)
        • Exhibit 82: Data Table on North America - Year-over-year growth 2023-2028 (%)
      • 9.4 Europe - Market size and forecast 2023-2028
        • Exhibit 83: Chart on Europe - Market size and forecast 2023-2028 ($ million)
        • Exhibit 84: Data Table on Europe - Market size and forecast 2023-2028 ($ million)
        • Exhibit 85: Chart on Europe - Year-over-year growth 2023-2028 (%)
        • Exhibit 86: Data Table on Europe - Year-over-year growth 2023-2028 (%)
      • 9.5 Asia - Market size and forecast 2023-2028
        • Exhibit 87: Chart on Asia - Market size and forecast 2023-2028 ($ million)
        • Exhibit 88: Data Table on Asia - Market size and forecast 2023-2028 ($ million)
        • Exhibit 89: Chart on Asia - Year-over-year growth 2023-2028 (%)
        • Exhibit 90: Data Table on Asia - Year-over-year growth 2023-2028 (%)
      • 9.6 Rest of World (ROW) - Market size and forecast 2023-2028
        • Exhibit 91: Chart on Rest of World (ROW) - Market size and forecast 2023-2028 ($ million)
        • Exhibit 92: Data Table on Rest of World (ROW) - Market size and forecast 2023-2028 ($ million)
        • Exhibit 93: Chart on Rest of World (ROW) - Year-over-year growth 2023-2028 (%)
        • Exhibit 94: Data Table on Rest of World (ROW) - Year-over-year growth 2023-2028 (%)
      • 9.7 US - Market size and forecast 2023-2028
        • Exhibit 95: Chart on US - Market size and forecast 2023-2028 ($ million)
        • Exhibit 96: Data Table on US - Market size and forecast 2023-2028 ($ million)
        • Exhibit 97: Chart on US - Year-over-year growth 2023-2028 (%)
        • Exhibit 98: Data Table on US - Year-over-year growth 2023-2028 (%)
      • 9.8 Germany - Market size and forecast 2023-2028
        • Exhibit 99: Chart on Germany - Market size and forecast 2023-2028 ($ million)
        • Exhibit 100: Data Table on Germany - Market size and forecast 2023-2028 ($ million)
        • Exhibit 101: Chart on Germany - Year-over-year growth 2023-2028 (%)
        • Exhibit 102: Data Table on Germany - Year-over-year growth 2023-2028 (%)
      • 9.9 China - Market size and forecast 2023-2028
        • Exhibit 103: Chart on China - Market size and forecast 2023-2028 ($ million)
        • Exhibit 104: Data Table on China - Market size and forecast 2023-2028 ($ million)
        • Exhibit 105: Chart on China - Year-over-year growth 2023-2028 (%)
        • Exhibit 106: Data Table on China - Year-over-year growth 2023-2028 (%)
      • 9.10 France - Market size and forecast 2023-2028
        • Exhibit 107: Chart on France - Market size and forecast 2023-2028 ($ million)
        • Exhibit 108: Data Table on France - Market size and forecast 2023-2028 ($ million)
        • Exhibit 109: Chart on France - Year-over-year growth 2023-2028 (%)
        • Exhibit 110: Data Table on France - Year-over-year growth 2023-2028 (%)
      • 9.11 UK - Market size and forecast 2023-2028
        • Exhibit 111: Chart on UK - Market size and forecast 2023-2028 ($ million)
        • Exhibit 112: Data Table on UK - Market size and forecast 2023-2028 ($ million)
        • Exhibit 113: Chart on UK - Year-over-year growth 2023-2028 (%)
        • Exhibit 114: Data Table on UK - Year-over-year growth 2023-2028 (%)
      • 9.12 Market opportunity by geography
        • Exhibit 115: Market opportunity by geography ($ million)
        • Exhibit 116: Data Tables on Market opportunity by geography ($ million)
      • 11.13 Canada - Market size and forecast (2023-2028)
        • Chart on Canada - Market size and forecast (2023-2028) ($ million)
        • Data Table on Canada - Market size and forecast (2023-2028) ($ million)
        • Chart on Canada - Year-over-year growth (2023-2028) (%)
        • Data Table on Canada - Year-over-year growth (2023-2028) (%)
      • 11.14 Italy - Market size and forecast (2023-2028)
        • Chart on Italy - Market size and forecast (2023-2028) ($ million)
        • Data Table on Italy - Market size and forecast (2023-2028) ($ million)
        • Chart on Italy - Year-over-year growth (2023-2028) (%)
        • Data Table on Italy - Year-over-year growth (2023-2028) (%)
      • 11.15 UAE - Market size and forecast (2023-2028)
        • Chart on UAE - Market size and forecast (2023-2028) ($ million)
        • Data Table on UAE - Market size and forecast (2023-2028) ($ million)
        • Chart on UAE - Year-over-year growth (2023-2028) (%)
        • Data Table on UAE - Year-over-year growth (2023-2028) (%)
      • 11.16 Brazil - Market size and forecast (2023-2028)
        • Chart on Brazil - Market size and forecast (2023-2028) ($ million)
        • Data Table on Brazil - Market size and forecast (2023-2028) ($ million)
        • Chart on Brazil - Year-over-year growth (2023-2028) (%)
        • Data Table on Brazil - Year-over-year growth (2023-2028) (%)
      • 11.17 Rest of World(ROW) - Market size and forecast (2023-2028)
        • Chart on Rest of World(ROW) - Market size and forecast (2023-2028) ($ million)
        • Data Table on Rest of World(ROW) - Market size and forecast (2023-2028) ($ million)
        • Chart on Rest of World(ROW) - Year-over-year growth (2023-2028) (%)
        • Data Table on Rest of World(ROW) - Year-over-year growth (2023-2028) (%)

      10 Drivers, Challenges, and Trends

      • 10.1 Market drivers
        • 10.2 Market challenges
          • 10.3 Impact of drivers and challenges
            • Exhibit 117: Impact of drivers and challenges in 2023 and 2028
          • 10.4 Market trends

            11 Vendor Landscape

            • 11.1 Overview
              • 11.2 Vendor landscape
                • Exhibit 118: Overview on Criticality of inputs and Factors of differentiation
              • 11.3 Landscape disruption
                • Exhibit 119: Overview on factors of disruption
              • 11.4 Industry risks
                • Exhibit 120: Impact of key risks on business

              12 Vendor Analysis

              • 12.1 Vendors covered
                • Exhibit 121: Vendors covered
              • 12.2 Market positioning of vendors
                • Exhibit 122: Matrix on vendor position and classification
              • 12.3 Amplitude Surgical
                • Exhibit 123: Amplitude Surgical - Overview
                • Exhibit 124: Amplitude Surgical - Product / Service
                • Exhibit 125: Amplitude Surgical - Key offerings
              • 12.4 B.Braun SE
                • Exhibit 126: B.Braun SE - Overview
                • Exhibit 127: B.Braun SE - Business segments
                • Exhibit 128: B.Braun SE - Key news
                • Exhibit 129: B.Braun SE - Key offerings
                • Exhibit 130: B.Braun SE - Segment focus
              • 12.5 Brainlab AG
                • Exhibit 131: Brainlab AG - Overview
                • Exhibit 132: Brainlab AG - Product / Service
                • Exhibit 133: Brainlab AG - Key offerings
              • 12.6 Corin Group Plc
                • Exhibit 134: Corin Group Plc - Overview
                • Exhibit 135: Corin Group Plc - Key offerings
              • 12.7 General Electric Co.
                • Exhibit 136: General Electric Co. - Overview
                • Exhibit 137: General Electric Co. - Business segments
                • Exhibit 138: General Electric Co. - Key news
                • Exhibit 139: General Electric Co. - Key offerings
                • Exhibit 140: General Electric Co. - Segment focus
              • 12.8 Johnson and Johnson
                • Exhibit 141: Johnson and Johnson - Overview
                • Exhibit 142: Johnson and Johnson - Business segments
                • Exhibit 143: Johnson and Johnson - Key news
                • Exhibit 144: Johnson and Johnson - Key offerings
                • Exhibit 145: Johnson and Johnson - Segment focus
              • 12.9 KARL STORZ SE and Co. KG
                • Exhibit 146: KARL STORZ SE and Co. KG - Overview
                • Exhibit 147: KARL STORZ SE and Co. KG - Product / Service
                • Exhibit 148: KARL STORZ SE and Co. KG - Key news
                • Exhibit 149: KARL STORZ SE and Co. KG - Key offerings
              • 12.10 Medacta International SA
                • Exhibit 150: Medacta International SA - Overview
                • Exhibit 151: Medacta International SA - Product / Service
                • Exhibit 152: Medacta International SA - Key offerings
              • 12.11 Medtronic Plc
                • Exhibit 153: Medtronic Plc - Overview
                • Exhibit 154: Medtronic Plc - Business segments
                • Exhibit 155: Medtronic Plc - Key news
                • Exhibit 156: Medtronic Plc - Key offerings
                • Exhibit 157: Medtronic Plc - Segment focus
              • 12.12 Navigate Surgical Technologies Inc.
                • Exhibit 158: Navigate Surgical Technologies Inc. - Overview
                • Exhibit 159: Navigate Surgical Technologies Inc. - Product / Service
                • Exhibit 160: Navigate Surgical Technologies Inc. - Key offerings
              • 12.13 OrthAlign Corp.
                • Exhibit 161: OrthAlign Corp. - Overview
                • Exhibit 162: OrthAlign Corp. - Product / Service
                • Exhibit 163: OrthAlign Corp. - Key offerings
              • 12.14 Siemens AG
                • Exhibit 164: Siemens AG - Overview
                • Exhibit 165: Siemens AG - Business segments
                • Exhibit 166: Siemens AG - Key news
                • Exhibit 167: Siemens AG - Key offerings
                • Exhibit 168: Siemens AG - Segment focus
              • 12.15 Smith and Nephew plc
                • Exhibit 169: Smith and Nephew plc - Overview
                • Exhibit 170: Smith and Nephew plc - Business segments
                • Exhibit 171: Smith and Nephew plc - Key news
                • Exhibit 172: Smith and Nephew plc - Key offerings
                • Exhibit 173: Smith and Nephew plc - Segment focus
              • 12.16 Stryker Corp.
                • Exhibit 174: Stryker Corp. - Overview
                • Exhibit 175: Stryker Corp. - Business segments
                • Exhibit 176: Stryker Corp. - Key news
                • Exhibit 177: Stryker Corp. - Key offerings
                • Exhibit 178: Stryker Corp. - Segment focus
              • 12.17 Zimmer Biomet Holdings Inc.
                • Exhibit 179: Zimmer Biomet Holdings Inc. - Overview
                • Exhibit 180: Zimmer Biomet Holdings Inc. - Business segments
                • Exhibit 181: Zimmer Biomet Holdings Inc. - Key news
                • Exhibit 182: Zimmer Biomet Holdings Inc. - Key offerings
                • Exhibit 183: Zimmer Biomet Holdings Inc. - Segment focus

              13 Appendix

              • 13.1 Scope of the report
                • 13.2 Inclusions and exclusions checklist
                  • Exhibit 184: Inclusions checklist
                  • Exhibit 185: Exclusions checklist
                • 13.3 Currency conversion rates for US$
                  • Exhibit 186: Currency conversion rates for US$
                • 13.4 Research methodology
                  • Exhibit 187: Research methodology
                  • Exhibit 188: Validation techniques employed for market sizing
                  • Exhibit 189: Information sources
                • 13.5 List of abbreviations
                  • Exhibit 190: List of abbreviations

                Research Methodology

                Technavio presents a detailed picture of the market by way of study, synthesis, and summation of data from multiple sources. The analysts have presented the various facets of the market with a particular focus on identifying the key industry influencers. The data thus presented is comprehensive, reliable, and the result of extensive research, both primary and secondary.

                INFORMATION SOURCES

                Primary sources

                • Manufacturers and suppliers
                • Channel partners
                • Industry experts
                • Strategic decision makers

                Secondary sources

                • Industry journals and periodicals
                • Government data
                • Financial reports of key industry players
                • Historical data
                • Press releases

                DATA ANALYSIS

                Data Synthesis

                • Collation of data
                • Estimation of key figures
                • Analysis of derived insights

                Data Validation

                • Triangulation with data models
                • Reference against proprietary databases
                • Corroboration with industry experts

                REPORT WRITING

                Qualitative

                • Market drivers
                • Market challenges
                • Market trends
                • Five forces analysis

                Quantitative

                • Market size and forecast
                • Market segmentation
                • Geographical insights
                • Competitive landscape

                Interested in this report?

                Get your sample now to see our research methodology and insights!

                Download Now

                Frequently Asked Questions

                Surgical Navigation Systems market growth will increase by $ 580.92 mn during 2024-2028 .

                The Surgical Navigation Systems market is expected to grow at a CAGR of 6.92% during 2024-2028 .

                Surgical Navigation Systems market is segmented by Application( Neurology, Orthopedic, ENT, Dental, Spinal) Technology( Electromagnetic, Optical, Hybrid, Fluoroscopy-Based, CT-Based)

                B.Braun SE, Brainlab AG, CASCINATION AG, Corin Group Plc, Fiagon GmbH, General Electric Co., Johnson and Johnson, KARL STORZ SE and Co. KG, Lexmark International Inc., Medacta International SA, Medtronic Plc, Navigate Surgical Technologies Inc., OrthAlign Corp., Orthofix Medical Inc., Samsung Electronics Co. Ltd., Siemens AG, Smith and Nephew plc, Stryker Corp., Zimmer Biomet Holdings Inc., Amplitude Surgical are a few of the key vendors in the Surgical Navigation Systems market.

                North America will register the highest growth rate of 45% among the other regions. Therefore, the Surgical Navigation Systems market in North America is expected to garner significant business opportunities for the vendors during the forecast period.

                US, Germany, France, UK, China, Canada, Italy, UAE, Brazil, Rest of World(ROW)

                • High prevalence of CVDCVD is the leading cause of death globally. The prevalence of these diseases is high due to an unhealthy and sedentary lifestyle. The geriatric population is more prone to CVD as their heart functionality becomes weak. According to the World Health Organization is the driving factor this market.
                • CVD is the major cause of death across the world and accounts for about one-third of the total annual deaths. According to the Centers for Disease Control and Prevention (CDC) is the driving factor this market.
                • in the US is the driving factor this market.
                • approximately 610 is the driving factor this market.
                • 000 people succumb to heart disease every year. The CDC also reports that every year is the driving factor this market.
                • approximately 790 is the driving factor this market.
                • 000 Americans have a heart attack is the driving factor this market.
                • of which nearly 580 is the driving factor this market.
                • 000 are first attacks and 210 is the driving factor this market.
                • 000 are recurrent attacks. CVD is the most prevalent disease is the driving factor this market.
                • and it accounts for 40% of all deaths in European accounts. More than 4 million deaths occur every year in Europe with CVD is the driving factor this market.
                • primarily due to stroke and coronary heart disease (CHD). Annually is the driving factor this market.
                • sudden cardiac deaths occur in approximately 400 persons per million inhabitants in each country in Asia. This has made surgical navigation systems essential to prevent recurrent cases and secondary heart complications. The prevalence of CVD is expected to increase significantly in the upcoming decade (by 2030) owing to a growing sedentary lifestyle. This will also increase awareness about surgical navigation systems to prevent the recurrence of diseases is the driving factor this market.
                • which will lead to the growth of the global surgical navigation systems market during the forecast period. is the driving factor this market.

                The Surgical Navigation Systems market vendors should focus on grabbing business opportunities from the Neurology segment as it accounted for the largest market share in the base year.