
Sustainable AI Market Size 2026-2030
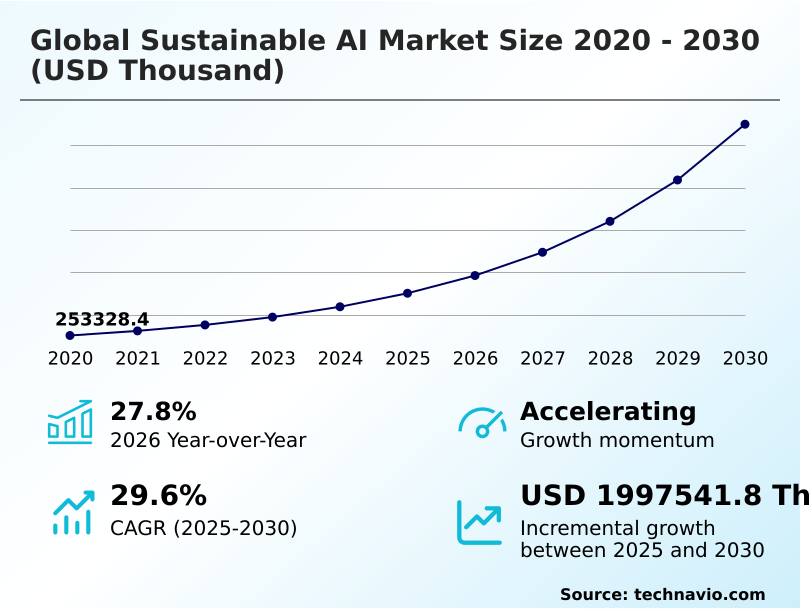
The Sustainable AI Market size was valued at USD 752.54 million in 2025, growing at a CAGR of 29.6% during the forecast period 2026-2030.
Major Market Trends & Insights
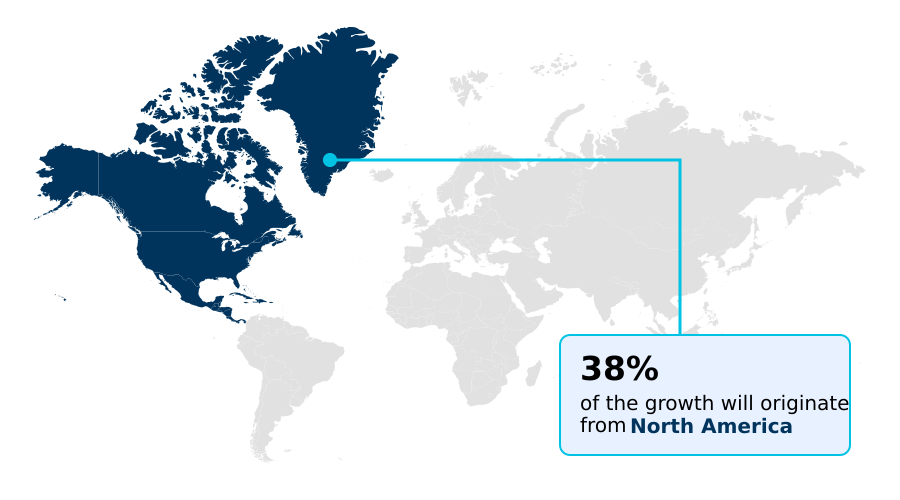
- North America dominated the market and accounted for a 38% growth during the forecast period.
- By Technology - Machine learning segment was valued at USD 222.36 million in 2024
- By End-user - Healthcare segment accounted for the largest market revenue share in 2024
Market Size & Forecast
- Historic Market Opportunities 2020-2024:
- Market Future Opportunities 2025-2030: USD 2.00 billion
- CAGR from 2025 to 2030 : 29.6%
Market Summary
- The sustainable AI market is expanding as organizations prioritize both technological advancement and environmental responsibility, with adoption in manufacturing reducing energy use by up to 25%. A key driver is the implementation of stringent regulatory frameworks, compelling companies to adopt AI for automated compliance tracking and environmental impact assessment.
- For example, a global logistics firm can deploy AI to optimize shipping routes, cutting fuel consumption by 15% and lowering its computational carbon footprint. However, the market faces a significant challenge in the high energy consumption of the AI models themselves, which can strain power grids and increase operational costs.
- This paradox necessitates continuous innovation in energy-efficient algorithms and hardware to ensure that the benefits of AI-driven sustainability initiatives are not offset by the technology's own environmental cost, forcing a focus on green software development.
What will be the Size of the Sustainable AI Market during the forecast period?
Get Key Insights on Market Forecast (PDF) Request Free Sample
How is the Sustainable AI Market Segmented?
The sustainable ai industry research report provides comprehensive data (region-wise segment analysis), with forecasts and analysis for the period 2026-2030, as well as historical data from 2020-2024 for the following segments.
- Technology
- Machine learning
- Natural language processing
- Deep learning
- Others
- End-user
- Healthcare
- Retail and e-commerce
- Manufacturing
- Others
- Deployment
- Cloud-based
- On-premises
- Application
- Energy management
- Carbon emission tracking
- Climate risk assessment
- Smart agriculture
- Others
- Geography
- North America
- US
- Canada
- Mexico
- Europe
- Germany
- UK
- France
- APAC
- China
- Japan
- India
- South America
- Brazil
- Argentina
- Middle East and Africa
- Saudi Arabia
- UAE
- South Africa
- Rest of World (ROW)
- North America
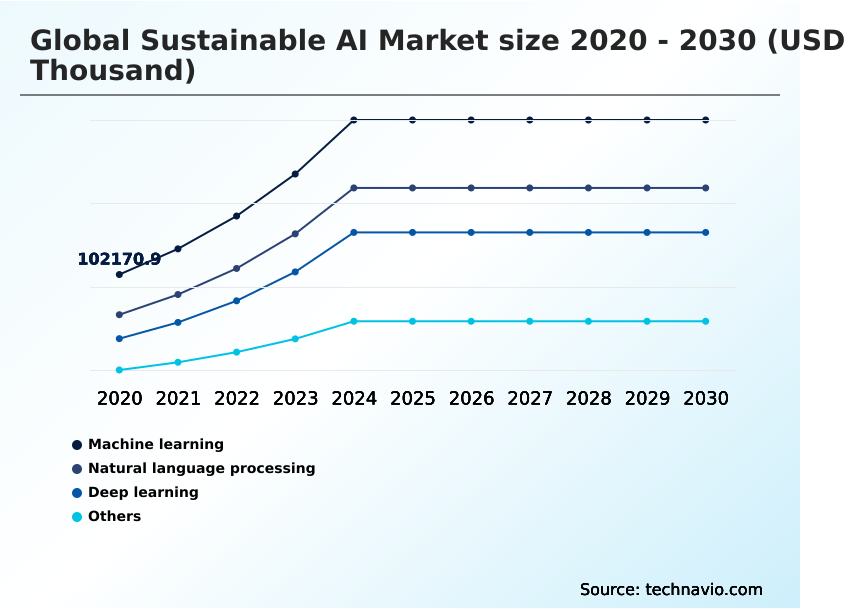
How is the Sustainable AI Market Segmented by Technology?
The machine learning segment is estimated to witness significant growth during the forecast period.
Machine learning is the largest technology segment, accounting for over 35% of the market, driven by its application in predictive maintenance and supply chain optimization.
Within this segment, a key focus is on Green ML, where techniques like model pruning and quantization techniques reduce model size and computational load, improving energy efficiency by up to 50% without a significant drop in accuracy.
These methods, along with knowledge distillation, allow for the deployment of effective systems on less power-hungry infrastructure.
Furthermore, federated learning is gaining traction, enabling model training on decentralized data, which enhances privacy and reduces the energy footprint associated with large-scale data transfers by more than 70%, making it a crucial component of sustainable AI strategies.
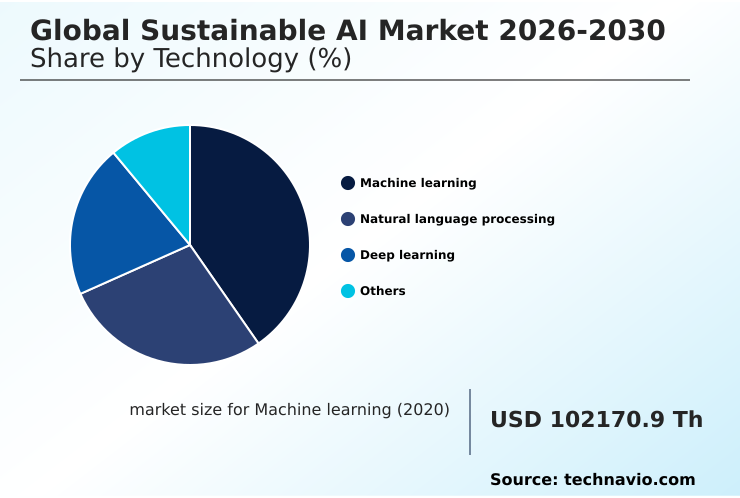
The Machine learning segment was valued at USD 222.36 million in 2024 and showed a gradual increase during the forecast period.
How demand for the Sustainable AI market is rising in the leading region?
North America is estimated to contribute 38% to the growth of the global market during the forecast period.Technavio’s analysts have elaborately explained the regional trends and drivers that shape the market during the forecast period.
See How Sustainable AI Market demand is rising in North America Request Free Sample
North America dominates the sustainable AI market, accounting for over 38% of the global share, driven by strong government incentives and a mature technology ecosystem in the United States and Canada.
In contrast, APAC is the fastest-growing region, with a CAGR projected to be 2.6 percentage points higher than North America, fueled by rapid industrialization and smart city initiatives in China and India.
Adoption varies significantly, with North American firms focusing on AI-powered grid management and financial ESG analytics, while APAC investment is concentrated in sustainable agriculture AI and manufacturing optimization.
This regional difference influences green IT procurement strategies; for instance, demand for low-power AI hardware is soaring in APAC to support edge deployments, while North American buyers prioritize cloud solutions with comprehensive environmental data platforms.
What are the key Drivers, Trends, and Challenges in the Sustainable AI Market?
Our researchers analyzed the data with 2025 as the base year, along with the key drivers, trends, and challenges. A holistic analysis of drivers will help companies refine their marketing strategies to gain a competitive advantage.
- Organizations are increasingly exploring the benefits of green AI in manufacturing, where AI-driven process controls can reduce energy consumption by up to 20% and material waste by 15%. This operational efficiency is a direct result of deploying systems that provide real-time optimization.
- Similarly, implementing sustainable AI for supply chain transparency is becoming a competitive differentiator, as it allows companies to verify ethical sourcing and track Scope 3 emissions across their value chain, satisfying both regulatory demands and consumer expectations.
- A critical step in this journey is accurately measuring the carbon footprint of AI models themselves, a process that has become more streamlined with new software tools. Enterprises are discovering that AI-driven energy management system benefits extend beyond cost savings, contributing significantly to corporate sustainability goals.
- The adoption of ethical AI frameworks for social good further enhances brand reputation by ensuring that technology deployment promotes fairness and digital equity. These frameworks guide companies to build AI that is not only environmentally sound but also socially responsible, creating a holistic approach to sustainability that is more than twice as likely to achieve long-term success.
What are the key market drivers leading to the rise in the adoption of Sustainable AI Industry?
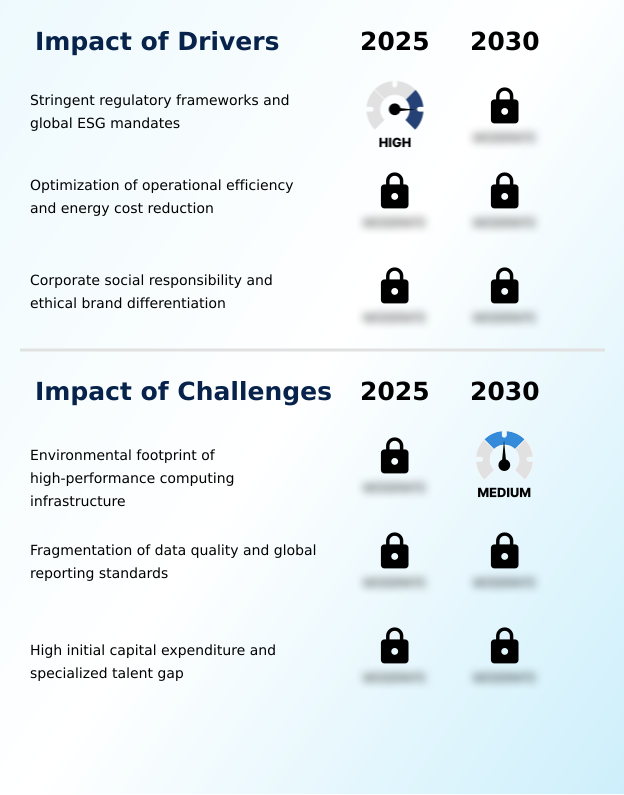
- The market is primarily driven by increasingly stringent regulatory frameworks and global environmental, social, and governance mandates compelling organizations to adopt sustainable technologies.
- Stringent regulatory frameworks and global ESG mandates are major drivers, compelling over 70% of large enterprises to adopt an AI-driven ESG strategy. These regulations necessitate robust corporate sustainability reporting and automated compliance tracking, pushing firms toward sustainable AI solutions.
- The economic pressure to improve operational efficiency and reduce high energy costs is another catalyst, promoting the use of energy-efficient algorithms and green AI techniques which can lower operational overhead by 15%.
- This focus on algorithmic efficiency is central to responsible AI governance. Finally, a growing emphasis on corporate social responsibility motivates companies to invest in AI ethics and fairness, using sustainable AI to build consumer trust.
What are the market trends shaping the Sustainable AI Industry?
- Strategic migration to data centers integrated with renewable energy sources is a primary trend, complemented by the adoption of energy-aware workload scheduling to minimize carbon intensity.
- A key trend is the adoption of decentralized AI models, which process data at the source and reduce energy-intensive data transfers by over 60%. This shift toward edge computing AI is enabling smarter waste sorting for the circular economy and AI for biodiversity monitoring in remote locations.
- Concurrently, energy-aware workload scheduling allows data centers to shift tasks to periods of high renewable energy availability, improving computational resource efficiency. This green software development approach cuts the carbon intensity of AI workloads by up to 30%.
- Furthermore, collaborative multi-agent systems and digital twin simulation are creating industrial symbiosis AI, where the waste from one process becomes the input for another, fundamentally redesigning resource optimization models for low-carbon AI deployment and AI-enabled industrial automation.
What challenges does the Sustainable AI Industry face during its growth?
- A key challenge facing the market is the substantial environmental footprint of the high-performance computing infrastructure required for large-scale AI model training and deployment.
- A primary challenge is the significant environmental footprint of high-performance computing infrastructure, where the computational carbon footprint of training a single large AI model can equal the lifetime emissions of five cars. This paradox complicates ESG data analytics and makes accurate environmental impact assessment difficult.
- Another barrier is the fragmentation of ESG data, which hinders the effectiveness of AI for climate modeling and climate risk analytics, leading to unreliable insights. The high initial capital required for sustainable HPC architecture and green data centers, often 20% more than traditional setups, creates a barrier for many firms.
- Without standardized data and more accessible sustainable infrastructure, the full potential of AI for resource management remains constrained.
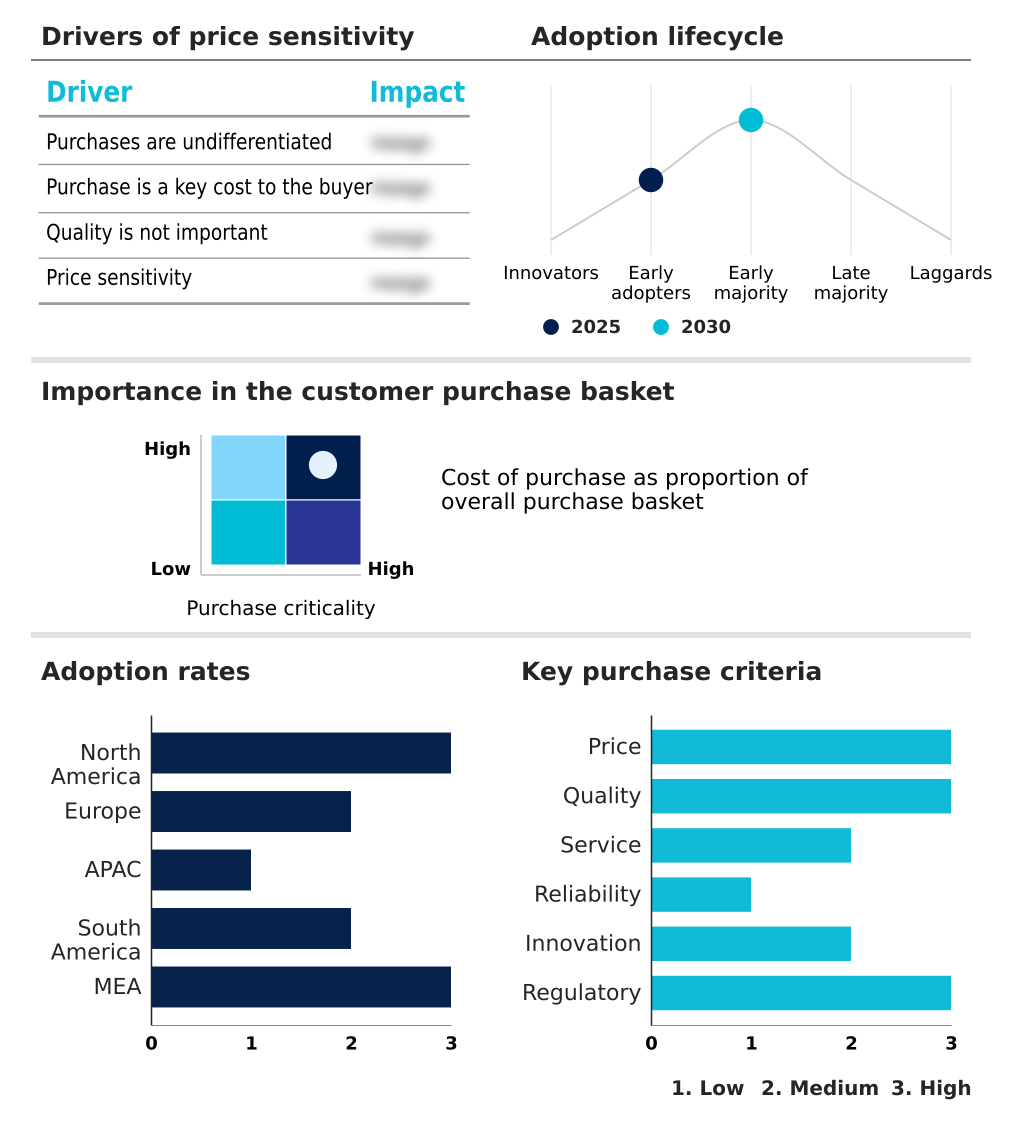
Exclusive Technavio Analysis on Customer Landscape
The sustainable ai market forecasting report includes the adoption lifecycle of the market, covering from the innovator’s stage to the laggard’s stage. It focuses on adoption rates in different regions based on penetration. Furthermore, the sustainable ai market report also includes key purchase criteria and drivers of price sensitivity to help companies evaluate and develop their market growth analysis strategies.
Customer Landscape of Sustainable AI Industry
Competitive Landscape
Companies are implementing various strategies, such as strategic alliances, sustainable ai market forecast, partnerships, mergers and acquisitions, geographical expansion, and product/service launches, to enhance their presence in the industry.
Amazon Web Services Inc. - Key offerings focus on energy-efficient cloud infrastructure and optimized AI hardware, designed to reduce the power consumption and environmental footprint of enterprise AI workloads.
The industry research and growth report includes detailed analyses of the competitive landscape of the market and information about key companies, including:
- Amazon Web Services Inc.
- BrainBox AI
- C3.ai Inc.
- Capgemini SE
- Cognizant Technology Solution
- Databricks Inc.
- Fujitsu Ltd.
- Google LLC
- Hewlett Packard Enterprise Co.
- Hitachi Ltd.
- IBM Corp.
- Infosys Ltd.
- Intel Corp.
- Microsoft Corp.
- NVIDIA Corp.
- Oracle Corp.
- Salesforce Inc.
- SAP SE
- Siemens AG
- Snowflake Inc.
Qualitative and quantitative analysis of companies has been conducted to help clients understand the wider business environment as well as the strengths and weaknesses of key industry players. Data is qualitatively analyzed to categorize companies as pure play, category-focused, industry-focused, and diversified; it is quantitatively analyzed to categorize companies as dominant, leading, strong, tentative, and weak.
Market Intelligence Radar: High-Impact Developments & Growth Signals
- In the Application Software industry, the widespread shift to cloud-native and SaaS delivery models has accelerated the adoption of sustainable cloud services, where enterprises leverage hyperscalers’ renewable energy investments to reduce the Scope 2 emissions of their AI workloads by over 15%. This trend directly impacts sustainable AI by making green IT procurement and computational resource efficiency central to vendor selection.
- The increasing integration of robotic process automation (RPA) and business process management (BPM) tools within the Application Software industry is creating significant demand for AI-enabled industrial automation. This directly fuels the sustainable AI market, as organizations seek to optimize automated workflows for energy efficiency, reducing operational energy costs by up to 10% through data-driven sustainability practices.
- Heightened data security concerns and the enforcement of regulations like GDPR within the Application Software industry have propelled the adoption of decentralized AI models. This directly impacts the sustainable AI market by promoting federated learning and edge computing architectures, which not only enhance data privacy but also reduce the energy consumption associated with large-scale data transfers to central servers, improving environmental impact assessment accuracy.
- The growing availability and adoption of open-source applications in the Application Software industry have created a competitive environment that pressures proprietary vendors to add value through specialized features. For the sustainable AI market, this means a greater focus on providing robust, auditable automated compliance tracking and ESG reporting capabilities that free open-source alternatives often lack, justifying a price premium of 20-30% for verified solutions.
Dive into Technavio’s robust research methodology, blending expert interviews, extensive data synthesis, and validated models for unparalleled Sustainable AI Market insights. See full methodology.
| Market Scope | |
|---|---|
| Page number | 335 |
| Base year | 2025 |
| Historic period | 2020-2024 |
| Forecast period | 2026-2030 |
| Growth momentum & CAGR | Accelerate at a CAGR of 29.6% |
| Market growth 2026-2030 | USD 1997541.8 thousand |
| Market structure | Fragmented |
| YoY growth 2025-2026(%) | 27.8% |
| Key countries | US, Canada, Mexico, Germany, UK, France, Italy, Spain, The Netherlands, China, Japan, India, South Korea, Australia, Indonesia, Brazil, Argentina, Chile, Saudi Arabia, UAE, South Africa, Israel and Turkey |
| Competitive landscape | Leading Companies, Market Positioning of Companies, Competitive Strategies, and Industry Risks |
Research Analyst Overview
- The sustainable AI market ecosystem is a complex network where technology suppliers, solution providers, and end-users interact within a framework shaped by regulatory bodies. It begins with suppliers of low-power AI hardware and cloud platforms with net-zero compute infrastructure, enabling developers to build energy-efficient algorithms.
- These solutions are then adopted by enterprises in sectors like manufacturing and finance, which comprised over 40% of the market, to optimize operations and meet ESG mandates. Regulatory agencies influence the ecosystem by setting standards for corporate sustainability reporting and environmental impact assessment.
- The value chain is supported by research institutions advancing ethical AI frameworks and consulting firms that guide AI-driven ESG strategy, creating a cycle where technology innovation is driven by both market demand and compliance requirements, leading to operational efficiencies of up to 30%.
What are the Key Data Covered in this Sustainable AI Market Research and Growth Report?
-
What is the expected growth of the Sustainable AI Market between 2026 and 2030?
-
The Sustainable AI Market is expected to grow by USD 2.00 billion during 2026-2030, registering a CAGR of 29.6%. Year-over-year growth in 2026 is estimated at 27.8%%. This acceleration is shaped by stringent regulatory frameworks and global esg mandates, which is intensifying demand across multiple end-use verticals covered in the report.
-
-
What segmentation does the market report cover?
-
The report is segmented by Technology (Machine learning, Natural language processing, Deep learning, and Others), End-user (Healthcare, Retail and e-commerce, Manufacturing, and Others), Deployment (Cloud-based, and On-premises), Application (Energy management, Carbon emission tracking, Climate risk assessment, Smart agriculture, and Others) and Geography (North America, Europe, APAC, South America, Middle East and Africa). Among these, the Machine learning segment is estimated to witness significant growth during the forecast period, driven by rising adoption across key application areas. Each segment includes detailed qualitative and quantitative analysis, along with historical data from 2020-2024 and forecasts through 2030 with year-over-year growth rates.
-
-
Which regions are analyzed in the report?
-
The report covers North America, Europe, APAC, South America and Middle East and Africa. North America is estimated to contribute 38% to market growth during the forecast period. Country-level analysis includes US, Canada, Mexico, Germany, UK, France, Italy, Spain, The Netherlands, China, Japan, India, South Korea, Australia, Indonesia, Brazil, Argentina, Chile, Saudi Arabia, UAE, South Africa, Israel and Turkey, with dedicated market size tables and year-over-year growth for each.
-
-
What are the key growth drivers and market challenges?
-
The primary driver is stringent regulatory frameworks and global esg mandates, which is accelerating investment and industry demand. The main challenge is environmental footprint of high-performance computing infrastructure, creating operational barriers for key market participants. The report quantifies the impact of each driver and challenge across 2026 and 2030 with comparative analysis.
-
-
Who are the major players in the Sustainable AI Market?
-
Key vendors include Amazon Web Services Inc., BrainBox AI, C3.ai Inc., Capgemini SE, Cognizant Technology Solution, Databricks Inc., Fujitsu Ltd., Google LLC, Hewlett Packard Enterprise Co., Hitachi Ltd., IBM Corp., Infosys Ltd., Intel Corp., Microsoft Corp., NVIDIA Corp., Oracle Corp., Salesforce Inc., SAP SE, Siemens AG and Snowflake Inc.. The report provides qualitative and quantitative analysis categorizing companies as dominant, leading, strong, tentative, and weak based on their market positioning. Company profiles include business segment analysis, SWOT assessment, key offerings, and recent strategic developments.
-
Market Research Insights
- The competitive landscape for sustainable AI is consolidating as major technology firms and specialized providers vie for market share, with the top five vendors commanding over 38% of revenue. Recent developments highlight a focus on industry-specific applications; for instance, IBM's partnership with L'Oreal aims to reformulate cosmetic products using AI to identify sustainable materials, reducing waste by an estimated 10%.
- Similarly, Intel's EU-backed research center in Germany focuses on developing energy-efficient AI hardware and algorithms. These actions reflect enterprise demand for tangible ROI from AI-driven ESG strategy. However, companies face the persistent challenge of sourcing high-quality ESG data, which can compromise the effectiveness of these advanced solutions and hinder progress toward sustainability goals.
- This forces vendors to build robust data integration and validation capabilities into their platforms.
We can help! Our analysts can customize this sustainable ai market research report to meet your requirements.
 RIA -
RIA - 
