Switchgear And Switchboard Apparatus Market Analysis, Size, and Forecast 2025-2029: APAC (China, Japan, and India), Europe (Germany, UK, and France), North America (US, Canada, and Mexico), Middle East and Africa (Saudi Arabia and UAE), South America (Brazil and Argentina), and Rest of World (ROW)

Switchgear And Switchboard Apparatus Market Analysis, Size, and Forecast 2025-2029:
APAC (China, Japan, and India), Europe (Germany, UK, and France), North America (US, Canada, and Mexico), Middle East and Africa (Saudi Arabia and UAE), South America (Brazil and Argentina), and Rest of World (ROW)

Published: Dec 2025 271 Pages SKU: IRTNTR77292

Market Overview at a Glance

$40.27 B
Market Opportunity
7%
CAGR 2024 - 2029
52.2%
APAC Growth
$55.47 B
GIS segment 2023

Switchgear And Switchboard Apparatus Market Size 2025-2029

The switchgear and switchboard apparatus market size is valued to increase by USD 40.27 billion, at a CAGR of 7% from 2024 to 2029. Increasing global demand for power will drive the switchgear and switchboard apparatus market.

Major Market Trends & Insights

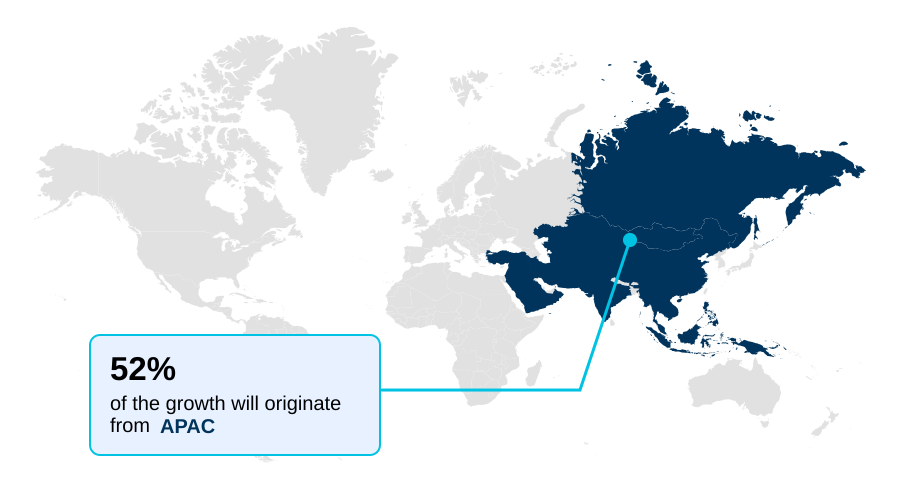
  • APAC dominated the market and accounted for a 52.2% growth during the forecast period.
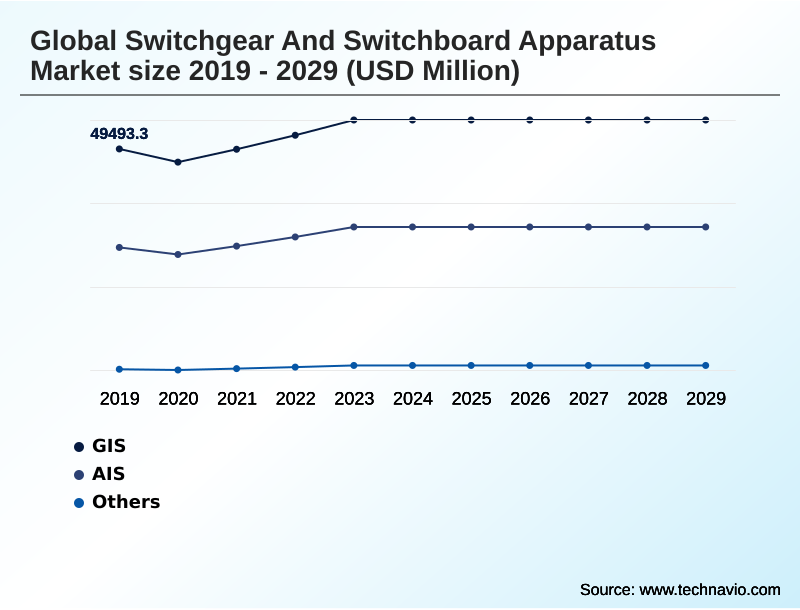
  • By Type - GIS segment was valued at USD 55.47 billion in 2023
  • By Power Rating - Medium voltage (2 to 36 kV) segment accounted for the largest market revenue share in 2023

Market Size & Forecast

  • Market Opportunities: USD 57.32 billion
  • Market Future Opportunities: USD 40.27 billion
  • CAGR from 2024 to 2029 : 7%

Market Summary

  • The switchgear and switchboard apparatus market is foundational to modern electrical infrastructure, ensuring the safe and reliable distribution of power. This market is driven by escalating global energy needs, the critical push for grid modernization, and the large-scale integration of renewable energy sources.
  • A primary trend is the adoption of intelligent systems, with a significant shift towards digital substations and smart grid infrastructure that enable enhanced control and automation. For instance, a utility provider upgrading its aging power T and D networks can deploy smart switchgear with remote monitoring systems to improve fault detection and isolation, significantly reducing outage durations and operational costs.
  • This digital transformation is further supported by the development of eco-efficient switchgear using SF6-free insulation. However, the industry navigates challenges related to volatile raw material pricing and the necessity of adhering to stringent international electrical safety standards, which influences the design of electrical protection devices and circuit protection devices, impacting both cost and innovation.

What will be the Size of the Switchgear And Switchboard Apparatus Market during the forecast period?

Get Key Insights on Market Forecast (PDF) Request Free Sample

How is the Switchgear And Switchboard Apparatus Market Segmented?

The switchgear and switchboard apparatus industry research report provides comprehensive data (region-wise segment analysis), with forecasts and estimates in "USD million" for the period 2025-2029, as well as historical data from 2019-2023 for the following segments.

  • Type
    • GIS
    • AIS
    • Others
  • Power rating
    • Medium voltage (2 to 36 kV)
    • High voltage (above 36 kV)
    • Low voltage (upto 1 kV)
  • Installation type
    • Indoor
    • Outdoor
  • Geography
    • APAC
      • China
      • Japan
      • India
    • Europe
      • Germany
      • UK
      • France
    • North America
      • US
      • Canada
      • Mexico
    • Middle East and Africa
      • Saudi Arabia
      • UAE
    • South America
      • Brazil
      • Argentina
    • Rest of World (ROW)

By Type Insights

The gis segment is estimated to witness significant growth during the forecast period.

The switchgear and switchboard apparatus market is segmented by type, power rating, and installation. Key types include gas-insulated switchgear (GIS) and air-insulated switchgear (AIS), each serving distinct operational environments.

The power rating segmentation comprises low-voltage switchgear, medium voltage switchgear, and high-voltage systems, addressing needs from commercial building power systems to large-scale industrial power control. Power distribution equipment is further categorized by indoor or outdoor installation, influencing design and durability.

Analysis shows the APAC region is a significant contributor, accounting for 52.2% of the market's incremental growth, reflecting extensive developments in electrical infrastructure safety and a focus on power system reliability for effective energy distribution management.

Request Free Sample

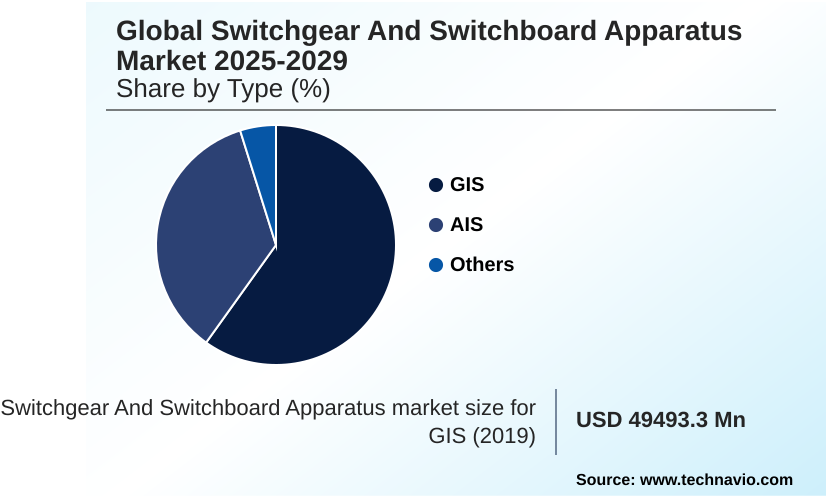
The GIS segment was valued at USD 55.47 billion in 2023 and showed a gradual increase during the forecast period.

Request Free Sample

Regional Analysis

APAC is estimated to contribute 52.2% to the growth of the global market during the forecast period.Technavio’s analysts have elaborately explained the regional trends and drivers that shape the market during the forecast period.

See How Switchgear And Switchboard Apparatus Market Demand is Rising in APAC Request Free Sample

The geographic landscape is led by APAC, which is set to contribute over half of the market's growth, driven by massive grid modernization projects and rapid industrialization in countries like China, where the market is valued at over 13,902 million.

In North America, the focus is on grid hardening solutions and retrofitting aging infrastructure to improve grid resilience, particularly in the US. These initiatives require advanced turnkey solutions and substation automation to manage new energy demands.

The deployment of high-voltage direct current systems for long-distance power transmission is also a key factor.

Meanwhile, regions like Europe are advancing the adoption of vacuum circuit breaker technology and sophisticated motor control centers to support industrial efficiency and electrical network protection, often involving complex substation design and engineering to accommodate compact urban environments and arc fault containment standards.

Market Dynamics

Our researchers analyzed the data with 2024 as the base year, along with the key drivers, trends, and challenges. A holistic analysis of drivers will help companies refine their marketing strategies to gain a competitive advantage.

  • The global switchgear and switchboard apparatus market is evolving with highly specialized demands from various sectors. For example, the increasing construction of hyperscale facilities creates a significant need for medium voltage switchgear for data centers, where uptime and power quality are non-negotiable.
  • Similarly, the global expansion of sustainable transport gives rise to specific switchgear requirements for EV charging infrastructure, demanding compact and highly reliable systems. This trend toward specialization is also seen in industrial settings, where smart switchboard apparatus for industrial automation is crucial for enhancing productivity and safety, often incorporating advanced motor control centers in manufacturing facilities.
  • As urban density increases, compact switchgear for urban substations becomes essential for maximizing real estate. Furthermore, the push for decarbonization drives interest in the benefits of SF6-free gas insulated switchgear, while asset managers focus on high voltage circuit breaker maintenance procedures to extend equipment life.
  • The nearshoring trend also has an impact on switchgear demand, as new industrial hubs require robust power distribution equipment for semiconductor plants and other critical manufacturing. Turnkey solutions for power distribution substations that integrate battery storage with switchgear are gaining traction to improve grid resilience with smart switchgear.
  • In this context, systems that offer a fault isolation speed over 15% faster than legacy equipment are becoming the standard for new installations.

What are the key market drivers leading to the rise in the adoption of Switchgear And Switchboard Apparatus Industry?

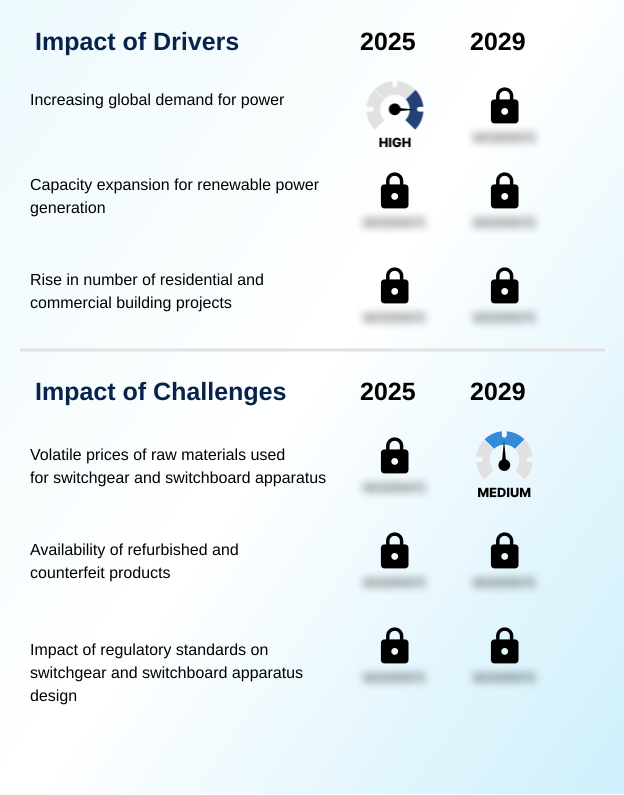
  • The increasing global demand for power, fueled by population growth, rapid urbanization, and ongoing industrialization, serves as a key driver for the switchgear and switchboard apparatus market.

  • Market growth is fundamentally driven by the global need for expanded and modernized power T and D networks.
  • Electrification projects and the urgent need for grid integration of renewables are necessitating significant T and D infrastructure upgrades, particularly with utility-scale electrical equipment like high-voltage circuit breakers.
  • For instance, robust construction activity, reflected in a 6.33% growth in new housing launches in key urban centers, directly fuels demand for reliable power distribution. This, coupled with a 6% rise in electricity demand, underscores the pressure on grid resilience.
  • Consequently, investments in grid modernization and UHVDC transmission systems are increasing to enhance power transmission efficiency and support rising energy consumption across residential and industrial sectors.

What are the market trends shaping the Switchgear And Switchboard Apparatus Industry?

  • The increasing application of Air-Insulated Switchgear (AIS) marks a significant market trend, driven by its pivotal role in smart grid development and overall grid efficiency enhancements.

  • Key trends are reshaping the market, with a strong emphasis on digitalization and sustainability. The adoption of smart grid infrastructure is accelerating, leveraging remote monitoring systems and digital substations to enhance asset management for utilities and enable predictive maintenance, improving grid uptime by over 20%.
  • Concurrently, the push for sustainability is driving the development of eco-efficient switchgear and SF6-free insulation technologies. Manufacturers are launching more compact switchgear, such as new panel versions that reduce the physical footprint by up to 25%, addressing space constraints in urban and industrial settings.
  • These smart switchgear solutions offer sophisticated digital power management, which is critical for managing distributed energy resources management effectively and ensuring power system reliability.

What challenges does the Switchgear And Switchboard Apparatus Industry face during its growth?

  • The volatile prices of essential raw materials, particularly copper and aluminum, present a key challenge impacting manufacturing costs and profit margins across the industry.

  • The market faces significant challenges related to supply chain volatility and stringent regulatory environments. Fluctuations in raw material prices directly impact the production cost of electrical protection devices and circuit protection devices, creating margin pressures.
  • A critical issue is adherence to complex electrical safety standards compliance, such as IEC 61439 for panelboards, which dictates design and testing protocols, raising development costs. Furthermore, ensuring robust fault detection and isolation and arc-flash mitigation capabilities requires advanced operational technology in power grids.
  • The presence of counterfeit components poses a severe risk, as these unverified products can compromise electrical network protection and power quality monitoring, leading to system failures and safety hazards.

Exclusive Technavio Analysis on Customer Landscape

The switchgear and switchboard apparatus market forecasting report includes the adoption lifecycle of the market, covering from the innovator’s stage to the laggard’s stage. It focuses on adoption rates in different regions based on penetration. Furthermore, the switchgear and switchboard apparatus market report also includes key purchase criteria and drivers of price sensitivity to help companies evaluate and develop their market growth analysis strategies.

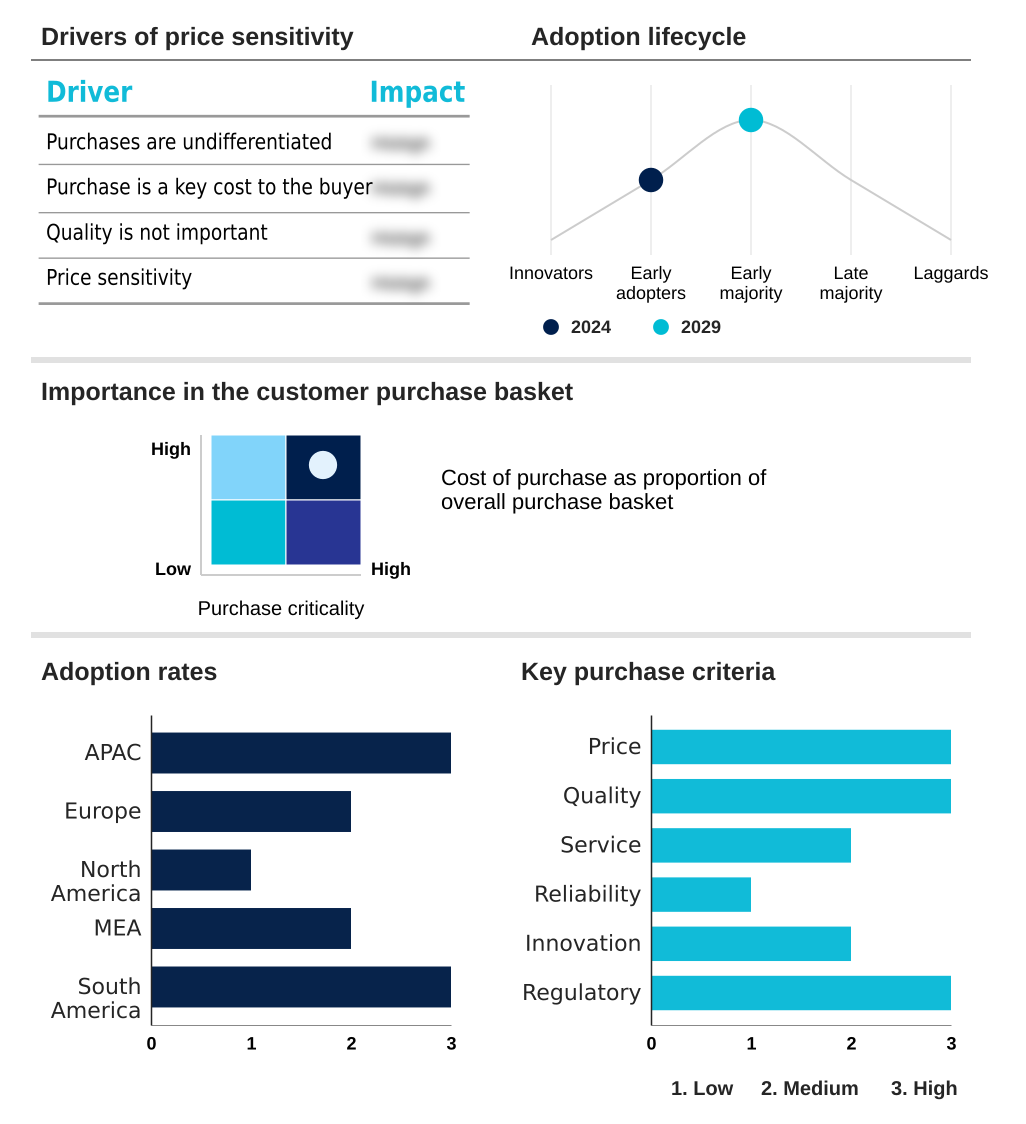
Customer Landscape of Switchgear And Switchboard Apparatus Industry

Competitive Landscape

Companies are implementing various strategies, such as strategic alliances, switchgear and switchboard apparatus market forecast, partnerships, mergers and acquisitions, geographical expansion, and product/service launches, to enhance their presence in the industry.

ABB Ltd. - Key offerings include specialized switchgear and switchboard apparatus for reliable power control, protection, and electrical system isolation across diverse applications.

The industry research and growth report includes detailed analyses of the competitive landscape of the market and information about key companies, including:

  • ABB Ltd.
  • Bharat Heavy Electricals Ltd.
  • CG Power and Industrial Ltd.
  • Eaton Corp. Plc
  • General Electric Co.
  • Havells India Ltd.
  • Hitachi Ltd.
  • Hubbell Inc.
  • Hyosung Corp.
  • Hyundai Electric and Energy Systems Co. Ltd.
  • Legrand SA
  • Luck Switchgear
  • Mitsubishi Electric Corp.
  • Powell Industries Inc.
  • Schneider Electric SE
  • Secheron SA
  • Siemens AG
  • Switchgear and Control Technics Pvt. Ltd.
  • Toshiba Corp.
  • Tricolite Electrical Industries Ltd.

Qualitative and quantitative analysis of companies has been conducted to help clients understand the wider business environment as well as the strengths and weaknesses of key industry players. Data is qualitatively analyzed to categorize companies as pure play, category-focused, industry-focused, and diversified; it is quantitatively analyzed to categorize companies as dominant, leading, strong, tentative, and weak.

Recent Development and News in Switchgear and switchboard apparatus market

  • In August 2024, TEPCO announced plans to invest $3.2 billion in its power grid to meet surging electricity demand from AI data centers and semiconductor plants, planning 18 new large-scale substations by 2030.
  • In September 2024, the Indian government launched Pradhan Mantri Awas Yojana Urban 2.0, an initiative targeting 10 million additional urban families with financial support for housing, stimulating demand for residential electrical infrastructure.
  • In February 2025, ABB introduced its LIORA modular switch range at ELECRAMA 2025, a product line designed for modern smart residential, commercial, and hospitality environments.
  • In April 2025, ABB launched a new circuit breaker solution engineered for next-generation wind turbines, which includes the industry's highest power rating with a 7200A Emax 2 air circuit breaker.

Dive into Technavio’s robust research methodology, blending expert interviews, extensive data synthesis, and validated models for unparalleled Switchgear And Switchboard Apparatus Market insights. See full methodology.

Market Scope
Page number 271
Base year 2024
Historic period 2019-2023
Forecast period 2025-2029
Growth momentum & CAGR Accelerate at a CAGR of 7%
Market growth 2025-2029 USD 40268.0 million
Market structure Fragmented
YoY growth 2024-2025(%) 6.6%
Key countries China, Japan, India, South Korea, Germany, UK, France, Italy, The Netherlands, US, Canada, Mexico, Saudi Arabia, UAE, Brazil and Argentina
Competitive landscape Leading Companies, Market Positioning of Companies, Competitive Strategies, and Industry Risks

Request Free Sample

Research Analyst Overview

  • The switchgear and switchboard apparatus market is undergoing a significant transformation, driven by the dual needs of modernizing aging power T and D networks and integrating decentralized energy sources. A key technological shift is the move towards digital substations, which incorporate advanced substation automation and remote monitoring systems for enhanced operational intelligence and grid resilience.
  • This evolution from analog to digital is compelling a strategic reallocation of capital expenditures toward smart grid infrastructure. Innovations in materials, such as SF6-free insulation, and designs, like compact switchgear and advanced vacuum circuit breaker technology, are becoming standard. These systems, including gas-insulated switchgear and air-insulated switchgear, are crucial power distribution equipment.
  • The market also sees demand for specialized electrical protection devices and circuit protection devices, with a focus on arc-flash mitigation and arc fault containment. Modern medium voltage switchgear and low-voltage switchgear now offer integrated diagnostics that can reduce system downtime by up to 30%, directly impacting operational continuity and profitability, making their adoption a critical boardroom-level decision.

What are the Key Data Covered in this Switchgear And Switchboard Apparatus Market Research and Growth Report?

  • What is the expected growth of the Switchgear And Switchboard Apparatus Market between 2025 and 2029?

    • USD 40.27 billion, at a CAGR of 7%

  • What segmentation does the market report cover?

    • The report is segmented by Type (GIS, AIS, Others), Power Rating (Medium voltage (2 to 36 kV), High voltage (above 36 kV), Low voltage (upto 1 kV)), Installation Type (Indoor, Outdoor) and Geography (APAC, Europe, North America, Middle East and Africa, South America)

  • Which regions are analyzed in the report?

    • APAC, Europe, North America, Middle East and Africa and South America

  • What are the key growth drivers and market challenges?

    • Increasing global demand for power, Volatile prices of raw materials used for switchgear and switchboard apparatus

  • Who are the major players in the Switchgear And Switchboard Apparatus Market?

    • ABB Ltd., Bharat Heavy Electricals Ltd., CG Power and Industrial Ltd., Eaton Corp. Plc, General Electric Co., Havells India Ltd., Hitachi Ltd., Hubbell Inc., Hyosung Corp., Hyundai Electric and Energy Systems Co. Ltd., Legrand SA, Luck Switchgear, Mitsubishi Electric Corp., Powell Industries Inc., Schneider Electric SE, Secheron SA, Siemens AG, Switchgear and Control Technics Pvt. Ltd., Toshiba Corp. and Tricolite Electrical Industries Ltd.

Market Research Insights

  • The market is shaped by dynamic forces driving investments in power system reliability and T and D infrastructure upgrades. A key factor is the global imperative for the grid integration of renewables, which demands more sophisticated energy distribution management.
  • For example, electrification projects in developing regions are accelerating, with electricity demand in some nations projected to grow by 6.6% in the coming years. In contrast, mature markets are focusing on upgrading aging infrastructure, where smart switchgear solutions can improve operational efficiency by over 15% through better asset management for utilities and load forecasting and management.
  • This shift toward digital power management and eco-efficient switchgear highlights a strategic move to enhance electrical infrastructure safety and performance globally.

We can help! Our analysts can customize this switchgear and switchboard apparatus market research report to meet your requirements.

Get in touch

1. Executive Summary

1.1 Market overview

Executive Summary - Chart on Market Overview
Executive Summary - Data Table on Market Overview
Executive Summary - Chart on Global Market Characteristics
Executive Summary - Chart on Market by Geography
Executive Summary - Chart on Market Segmentation by Type
Executive Summary - Chart on Market Segmentation by Power Rating
Executive Summary - Chart on Market Segmentation by Installation Type
Executive Summary - Chart on Incremental Growth
Executive Summary - Data Table on Incremental Growth
Executive Summary - Chart on Company Market Positioning

2. Technavio Analysis

2.1 Analysis of price sensitivity, lifecycle, customer purchase basket, adoption rates, and purchase criteria

2.2 Criticality of inputs and Factors of differentiation

Chart on Overview on criticality of inputs and factors of differentiation

2.3 Factors of disruption

Chart on Overview on factors of disruption

2.4 Impact of drivers and challenges

Chart on Impact of drivers and challenges in 2024 and 2029

3. Market Landscape

3.1 Market ecosystem

Chart on Parent Market
Data Table on - Parent Market

3.2 Market characteristics

Chart on Market characteristics analysis

3.3 Value chain analysis

Chart on Value chain analysis

4. Market Sizing

4.1 Market definition

Data Table on Offerings of companies included in the market definition

4.2 Market segment analysis

Market segments

4.3 Market size 2024

4.4 Market outlook: Forecast for 2024-2029

Chart on Global - Market size and forecast 2024-2029 ($ million)
Data Table on Global - Market size and forecast 2024-2029 ($ million)
Chart on Global Market: Year-over-year growth 2024-2029 (%)
Data Table on Global Market: Year-over-year growth 2024-2029 (%)

5. Historic Market Size

5.1 Global Switchgear And Switchboard Apparatus Market 2019 - 2023

Historic Market Size - Data Table on Global Switchgear And Switchboard Apparatus Market 2019 - 2023 ($ million)

5.2 Type segment analysis 2019 - 2023

Historic Market Size - Type Segment 2019 - 2023 ($ million)

5.3 Power Rating segment analysis 2019 - 2023

Historic Market Size - Power Rating Segment 2019 - 2023 ($ million)

5.4 Installation Type segment analysis 2019 - 2023

Historic Market Size - Installation Type Segment 2019 - 2023 ($ million)

5.5 Geography segment analysis 2019 - 2023

Historic Market Size - Geography Segment 2019 - 2023 ($ million)

5.6 Country segment analysis 2019 - 2023

Historic Market Size - Country Segment 2019 - 2023 ($ million)

6. Qualitative Analysis

6.1 The AI impact on Global Switchgear and Switchboard Apparatus Market

7. Five Forces Analysis

7.1 Five forces summary

Five forces analysis - Comparison between 2024 and 2029

7.2 Bargaining power of buyers

Bargaining power of buyers - Impact of key factors 2024 and 2029

7.3 Bargaining power of suppliers

Bargaining power of suppliers - Impact of key factors in 2024 and 2029

7.4 Threat of new entrants

Threat of new entrants - Impact of key factors in 2024 and 2029

7.5 Threat of substitutes

Threat of substitutes - Impact of key factors in 2024 and 2029

7.6 Threat of rivalry

Threat of rivalry - Impact of key factors in 2024 and 2029

7.7 Market condition

Chart on Market condition - Five forces 2024 and 2029

8. Market Segmentation by Type

8.1 Market segments

Chart on Type - Market share 2024-2029 (%)
Data Table on Type - Market share 2024-2029 (%)

8.2 Comparison by Type

Chart on Comparison by Type
Data Table on Comparison by Type

8.3 GIS - Market size and forecast 2024-2029

Chart on GIS - Market size and forecast 2024-2029 ($ million)
Data Table on GIS - Market size and forecast 2024-2029 ($ million)
Chart on GIS - Year-over-year growth 2024-2029 (%)
Data Table on GIS - Year-over-year growth 2024-2029 (%)

8.4 AIS - Market size and forecast 2024-2029

Chart on AIS - Market size and forecast 2024-2029 ($ million)
Data Table on AIS - Market size and forecast 2024-2029 ($ million)
Chart on AIS - Year-over-year growth 2024-2029 (%)
Data Table on AIS - Year-over-year growth 2024-2029 (%)

8.5 Others - Market size and forecast 2024-2029

Chart on Others - Market size and forecast 2024-2029 ($ million)
Data Table on Others - Market size and forecast 2024-2029 ($ million)
Chart on Others - Year-over-year growth 2024-2029 (%)
Data Table on Others - Year-over-year growth 2024-2029 (%)

8.6 Market opportunity by Type

Market opportunity by Type ($ million)
Data Table on Market opportunity by Type ($ million)

9. Market Segmentation by Power Rating

9.1 Market segments

Chart on Power Rating - Market share 2024-2029 (%)
Data Table on Power Rating - Market share 2024-2029 (%)

9.2 Comparison by Power Rating

Chart on Comparison by Power Rating
Data Table on Comparison by Power Rating

9.3 Medium voltage (2 to 36 kV) - Market size and forecast 2024-2029

Chart on Medium voltage (2 to 36 kV) - Market size and forecast 2024-2029 ($ million)
Data Table on Medium voltage (2 to 36 kV) - Market size and forecast 2024-2029 ($ million)
Chart on Medium voltage (2 to 36 kV) - Year-over-year growth 2024-2029 (%)
Data Table on Medium voltage (2 to 36 kV) - Year-over-year growth 2024-2029 (%)

9.4 High voltage (above 36 kV) - Market size and forecast 2024-2029

Chart on High voltage (above 36 kV) - Market size and forecast 2024-2029 ($ million)
Data Table on High voltage (above 36 kV) - Market size and forecast 2024-2029 ($ million)
Chart on High voltage (above 36 kV) - Year-over-year growth 2024-2029 (%)
Data Table on High voltage (above 36 kV) - Year-over-year growth 2024-2029 (%)

9.5 Low voltage (upto 1 kV) - Market size and forecast 2024-2029

Chart on Low voltage (upto 1 kV) - Market size and forecast 2024-2029 ($ million)
Data Table on Low voltage (upto 1 kV) - Market size and forecast 2024-2029 ($ million)
Chart on Low voltage (upto 1 kV) - Year-over-year growth 2024-2029 (%)
Data Table on Low voltage (upto 1 kV) - Year-over-year growth 2024-2029 (%)

9.6 Market opportunity by Power Rating

Market opportunity by Power Rating ($ million)
Data Table on Market opportunity by Power Rating ($ million)

10. Market Segmentation by Installation Type

10.1 Market segments

Chart on Market Segmentation by Installation Type - Market share 2024-2029 (%)
Data Table on Market Segmentation by Installation Type - Market share 2024-2029 (%)

10.2 Comparison by Market Segmentation by Installation Type

Chart on Comparison by Market Segmentation by Installation Type
Data Table on Comparison by Market Segmentation by Installation Type

10.3 Indoor - Market size and forecast 2024-2029

Chart on Indoor - Market size and forecast 2024-2029 ($ million)
Data Table on Indoor - Market size and forecast 2024-2029 ($ million)
Chart on Indoor - Year-over-year growth 2024-2029 (%)
Data Table on Indoor - Year-over-year growth 2024-2029 (%)

10.4 Outdoor - Market size and forecast 2024-2029

Chart on Outdoor - Market size and forecast 2024-2029 ($ million)
Data Table on Outdoor - Market size and forecast 2024-2029 ($ million)
Chart on Outdoor - Year-over-year growth 2024-2029 (%)
Data Table on Outdoor - Year-over-year growth 2024-2029 (%)

10.5 Market opportunity by Market Segmentation by Installation Type

Market opportunity by Market Segmentation by Installation Type ($ million)
Data Table on Market opportunity by Market Segmentation by Installation Type ($ million)

11. Customer Landscape

11.1 Customer landscape overview

Analysis of price sensitivity, lifecycle, customer purchase basket, adoption rates, and purchase criteria

12. Geographic Landscape

12.1 Geographic segmentation

Chart on Market share by geography 2024-2029 (%)
Data Table on Market share by geography 2024-2029 (%)

12.2 Geographic comparison

Chart on Geographic comparison
Data Table on Geographic comparison

12.3 APAC - Market size and forecast 2024-2029

Chart on APAC - Market size and forecast 2024-2029 ($ million)
Data Table on APAC - Market size and forecast 2024-2029 ($ million)
Chart on APAC - Year-over-year growth 2024-2029 (%)
Data Table on APAC - Year-over-year growth 2024-2029 (%)
Chart on Regional Comparison - APAC
Data Table on Regional Comparison - APAC

12.3.1 China - Market size and forecast 2024-2029

Chart on China - Market size and forecast 2024-2029 ($ million)
Data Table on China - Market size and forecast 2024-2029 ($ million)
Chart on China - Year-over-year growth 2024-2029 (%)
Data Table on China - Year-over-year growth 2024-2029 (%)

12.3.2 Japan - Market size and forecast 2024-2029

Chart on Japan - Market size and forecast 2024-2029 ($ million)
Data Table on Japan - Market size and forecast 2024-2029 ($ million)
Chart on Japan - Year-over-year growth 2024-2029 (%)
Data Table on Japan - Year-over-year growth 2024-2029 (%)

12.3.3 India - Market size and forecast 2024-2029

Chart on India - Market size and forecast 2024-2029 ($ million)
Data Table on India - Market size and forecast 2024-2029 ($ million)
Chart on India - Year-over-year growth 2024-2029 (%)
Data Table on India - Year-over-year growth 2024-2029 (%)

12.3.4 South Korea - Market size and forecast 2024-2029

Chart on South Korea - Market size and forecast 2024-2029 ($ million)
Data Table on South Korea - Market size and forecast 2024-2029 ($ million)
Chart on South Korea - Year-over-year growth 2024-2029 (%)
Data Table on South Korea - Year-over-year growth 2024-2029 (%)

12.4 Europe - Market size and forecast 2024-2029

Chart on Europe - Market size and forecast 2024-2029 ($ million)
Data Table on Europe - Market size and forecast 2024-2029 ($ million)
Chart on Europe - Year-over-year growth 2024-2029 (%)
Data Table on Europe - Year-over-year growth 2024-2029 (%)
Chart on Regional Comparison - Europe
Data Table on Regional Comparison - Europe

12.4.1 Germany - Market size and forecast 2024-2029

Chart on Germany - Market size and forecast 2024-2029 ($ million)
Data Table on Germany - Market size and forecast 2024-2029 ($ million)
Chart on Germany - Year-over-year growth 2024-2029 (%)
Data Table on Germany - Year-over-year growth 2024-2029 (%)

12.4.2 UK - Market size and forecast 2024-2029

Chart on UK - Market size and forecast 2024-2029 ($ million)
Data Table on UK - Market size and forecast 2024-2029 ($ million)
Chart on UK - Year-over-year growth 2024-2029 (%)
Data Table on UK - Year-over-year growth 2024-2029 (%)

12.4.3 France - Market size and forecast 2024-2029

Chart on France - Market size and forecast 2024-2029 ($ million)
Data Table on France - Market size and forecast 2024-2029 ($ million)
Chart on France - Year-over-year growth 2024-2029 (%)
Data Table on France - Year-over-year growth 2024-2029 (%)

12.4.4 Italy - Market size and forecast 2024-2029

Chart on Italy - Market size and forecast 2024-2029 ($ million)
Data Table on Italy - Market size and forecast 2024-2029 ($ million)
Chart on Italy - Year-over-year growth 2024-2029 (%)
Data Table on Italy - Year-over-year growth 2024-2029 (%)

12.4.5 The Netherlands - Market size and forecast 2024-2029

Chart on The Netherlands - Market size and forecast 2024-2029 ($ million)
Data Table on The Netherlands - Market size and forecast 2024-2029 ($ million)
Chart on The Netherlands - Year-over-year growth 2024-2029 (%)
Data Table on The Netherlands - Year-over-year growth 2024-2029 (%)

12.5 North America - Market size and forecast 2024-2029

Chart on North America - Market size and forecast 2024-2029 ($ million)
Data Table on North America - Market size and forecast 2024-2029 ($ million)
Chart on North America - Year-over-year growth 2024-2029 (%)
Data Table on North America - Year-over-year growth 2024-2029 (%)
Chart on Regional Comparison - North America
Data Table on Regional Comparison - North America

12.5.1 US - Market size and forecast 2024-2029

Chart on US - Market size and forecast 2024-2029 ($ million)
Data Table on US - Market size and forecast 2024-2029 ($ million)
Chart on US - Year-over-year growth 2024-2029 (%)
Data Table on US - Year-over-year growth 2024-2029 (%)

12.5.2 Canada - Market size and forecast 2024-2029

Chart on Canada - Market size and forecast 2024-2029 ($ million)
Data Table on Canada - Market size and forecast 2024-2029 ($ million)
Chart on Canada - Year-over-year growth 2024-2029 (%)
Data Table on Canada - Year-over-year growth 2024-2029 (%)

12.5.3 Mexico - Market size and forecast 2024-2029

Chart on Mexico - Market size and forecast 2024-2029 ($ million)
Data Table on Mexico - Market size and forecast 2024-2029 ($ million)
Chart on Mexico - Year-over-year growth 2024-2029 (%)
Data Table on Mexico - Year-over-year growth 2024-2029 (%)

12.6 Middle East and Africa - Market size and forecast 2024-2029

Chart on Middle East and Africa - Market size and forecast 2024-2029 ($ million)
Data Table on Middle East and Africa - Market size and forecast 2024-2029 ($ million)
Chart on Middle East and Africa - Year-over-year growth 2024-2029 (%)
Data Table on Middle East and Africa - Year-over-year growth 2024-2029 (%)
Chart on Regional Comparison - Middle East and Africa
Data Table on Regional Comparison - Middle East and Africa

12.6.1 Saudi Arabia - Market size and forecast 2024-2029

Chart on Saudi Arabia - Market size and forecast 2024-2029 ($ million)
Data Table on Saudi Arabia - Market size and forecast 2024-2029 ($ million)
Chart on Saudi Arabia - Year-over-year growth 2024-2029 (%)
Data Table on Saudi Arabia - Year-over-year growth 2024-2029 (%)

12.6.2 UAE - Market size and forecast 2024-2029

Chart on UAE - Market size and forecast 2024-2029 ($ million)
Data Table on UAE - Market size and forecast 2024-2029 ($ million)
Chart on UAE - Year-over-year growth 2024-2029 (%)
Data Table on UAE - Year-over-year growth 2024-2029 (%)

12.7 South America - Market size and forecast 2024-2029

Chart on South America - Market size and forecast 2024-2029 ($ million)
Data Table on South America - Market size and forecast 2024-2029 ($ million)
Chart on South America - Year-over-year growth 2024-2029 (%)
Data Table on South America - Year-over-year growth 2024-2029 (%)
Chart on Regional Comparison - South America
Data Table on Regional Comparison - South America

12.7.1 Brazil - Market size and forecast 2024-2029

Chart on Brazil - Market size and forecast 2024-2029 ($ million)
Data Table on Brazil - Market size and forecast 2024-2029 ($ million)
Chart on Brazil - Year-over-year growth 2024-2029 (%)
Data Table on Brazil - Year-over-year growth 2024-2029 (%)

12.7.2 Argentina - Market size and forecast 2024-2029

Chart on Argentina - Market size and forecast 2024-2029 ($ million)
Data Table on Argentina - Market size and forecast 2024-2029 ($ million)
Chart on Argentina - Year-over-year growth 2024-2029 (%)
Data Table on Argentina - Year-over-year growth 2024-2029 (%)

12.8 Market opportunity by geography

Market opportunity by geography ($ million)
Data Tables on Market opportunity by geography ($ million)

13. Drivers, Challenges, and Opportunity

13.1 Market drivers

Increasing global demand for power
Capacity expansion for renewable power generation
Rise in number of residential and commercial building projects

13.2 Market challenges

Volatile prices of raw materials used for switchgear and switchboard apparatus
Availability of refurbished and counterfeit products
Impact of regulatory standards on switchgear and switchboard apparatus design

13.3 Impact of drivers and challenges

Impact of drivers and challenges in 2024 and 2029

13.4 Market opportunities

Increasing application of AIS
Increasing launches of switchgear by companies
Increasing demand for smart switchgear and switchboard apparatus

14. Competitive Landscape

14.1 Overview

14.2

Overview on criticality of inputs and factors of differentiation

14.3 Landscape disruption

Overview on factors of disruption

14.4 Industry risks

Impact of key risks on business

15. Competitive Analysis

15.1 Companies profiled

Companies covered

15.2 Company ranking index

15.3 Market positioning of companies

Matrix on companies position and classification

15.4 ABB Ltd.

ABB Ltd. - Overview
ABB Ltd. - Business segments
ABB Ltd. - Key news
ABB Ltd. - Key offerings
ABB Ltd. - Segment focus
SWOT

15.5 Bharat Heavy Electricals Ltd.

Bharat Heavy Electricals Ltd. - Overview
Bharat Heavy Electricals Ltd. - Business segments
Bharat Heavy Electricals Ltd. - Key news
Bharat Heavy Electricals Ltd. - Key offerings
Bharat Heavy Electricals Ltd. - Segment focus
SWOT

15.6 CG Power and Industrial Ltd.

CG Power and Industrial Ltd. - Overview
CG Power and Industrial Ltd. - Business segments
CG Power and Industrial Ltd. - Key offerings
CG Power and Industrial Ltd. - Segment focus
SWOT

15.7 Eaton Corp. Plc

Eaton Corp. Plc - Overview
Eaton Corp. Plc - Business segments
Eaton Corp. Plc - Key news
Eaton Corp. Plc - Key offerings
Eaton Corp. Plc - Segment focus
SWOT

15.8 General Electric Co.

General Electric Co. - Overview
General Electric Co. - Business segments
General Electric Co. - Key news
General Electric Co. - Key offerings
General Electric Co. - Segment focus
SWOT

15.9 Havells India Ltd.

Havells India Ltd. - Overview
Havells India Ltd. - Business segments
Havells India Ltd. - Key news
Havells India Ltd. - Key offerings
Havells India Ltd. - Segment focus
SWOT

15.10 Hitachi Ltd.

Hitachi Ltd. - Overview
Hitachi Ltd. - Business segments
Hitachi Ltd. - Key news
Hitachi Ltd. - Key offerings
Hitachi Ltd. - Segment focus
SWOT

15.11 Hubbell Inc.

Hubbell Inc. - Overview
Hubbell Inc. - Business segments
Hubbell Inc. - Key news
Hubbell Inc. - Key offerings
Hubbell Inc. - Segment focus
SWOT

15.12 Hyosung Corp.

Hyosung Corp. - Overview
Hyosung Corp. - Product / Service
Hyosung Corp. - Key offerings
SWOT

15.13 Hyundai Electric and Energy Systems Co. Ltd.

Hyundai Electric and Energy Systems Co. Ltd. - Overview
Hyundai Electric and Energy Systems Co. Ltd. - Product / Service
Hyundai Electric and Energy Systems Co. Ltd. - Key offerings
SWOT

15.14 Legrand SA

Legrand SA - Overview
Legrand SA - Business segments
Legrand SA - Key news
Legrand SA - Key offerings
Legrand SA - Segment focus
SWOT

15.15 Mitsubishi Electric Corp.

Mitsubishi Electric Corp. - Overview
Mitsubishi Electric Corp. - Business segments
Mitsubishi Electric Corp. - Key offerings
Mitsubishi Electric Corp. - Segment focus
SWOT

15.16 Powell Industries Inc.

Powell Industries Inc. - Overview
Powell Industries Inc. - Product / Service
Powell Industries Inc. - Key offerings
SWOT

15.17 Schneider Electric SE

Schneider Electric SE - Overview
Schneider Electric SE - Business segments
Schneider Electric SE - Key news
Schneider Electric SE - Key offerings
Schneider Electric SE - Segment focus
SWOT

15.18 Siemens AG

Siemens AG - Overview
Siemens AG - Business segments
Siemens AG - Key news
Siemens AG - Key offerings
Siemens AG - Segment focus
SWOT

16. Appendix

16.1 Scope of the report

Market definition
Objectives
Notes and caveats

16.2 Inclusions and exclusions checklist

Inclusions checklist
Exclusions checklist

16.3 Currency conversion rates for US$

16.4 Research methodology

16.5 Data procurement

Information sources

16.6 Data validation

16.7 Validation techniques employed for market sizing

16.8 Data synthesis

16.9 360 degree market analysis

16.10 List of abbreviations

Research Methodology

Technavio presents a detailed picture of the market by way of study, synthesis, and summation of data from multiple sources. The analysts have presented the various facets of the market with a particular focus on identifying the key industry influencers. The data thus presented is comprehensive, reliable, and the result of extensive research, both primary and secondary.

INFORMATION SOURCES

Primary sources

  • Manufacturers and suppliers
  • Channel partners
  • Industry experts
  • Strategic decision makers

Secondary sources

  • Industry journals and periodicals
  • Government data
  • Financial reports of key industry players
  • Historical data
  • Press releases

DATA ANALYSIS

Data Synthesis

  • Collation of data
  • Estimation of key figures
  • Analysis of derived insights

Data Validation

  • Triangulation with data models
  • Reference against proprietary databases
  • Corroboration with industry experts

REPORT WRITING

Qualitative

  • Market drivers
  • Market challenges
  • Market trends
  • Five forces analysis

Quantitative

  • Market size and forecast
  • Market segmentation
  • Geographical insights
  • Competitive landscape

Interested in this report?

Get your sample now to see our research methodology and insights!

Download Now

Frequently Asked Questions

Switchgear And Switchboard Apparatus market growth will increase by USD 40268.0 million during 2025-2029 .

The Switchgear And Switchboard Apparatus market is expected to grow at a CAGR of 7% during 2025-2029 .

Switchgear And Switchboard Apparatus market is segmented by Type (GIS, AIS, Others) Power rating (Medium voltage (2 to 36 kV), High voltage (above 36 kV), Low voltage (upto 1 kV)) Installation type (Indoor, Outdoor)

ABB Ltd., Bharat Heavy Electricals Ltd., CG Power and Industrial Ltd., Eaton Corp. Plc, General Electric Co., Havells India Ltd., Hitachi Ltd., Hubbell Inc., Hyosung Corp., Hyundai Electric and Energy Systems Co. Ltd., Legrand SA, Luck Switchgear, Mitsubishi Electric Corp., Powell Industries Inc., Schneider Electric SE, Secheron SA, Siemens AG, Switchgear and Control Technics Pvt. Ltd., Toshiba Corp., Tricolite Electrical Industries Ltd. are a few of the key vendors in the Switchgear And Switchboard Apparatus market.

APAC will register the highest growth rate of 52.2% among the other regions. Therefore, the Switchgear And Switchboard Apparatus market in APAC is expected to garner significant business opportunities for the vendors during the forecast period.

China, Japan, India, South Korea, Germany, UK, France, Italy, The Netherlands, US, Canada, Mexico, Saudi Arabia, UAE, Brazil, Argentina

  • Increasing global demand for power is the driving factor this market.

The Switchgear And Switchboard Apparatus market vendors should focus on grabbing business opportunities from the Type segment as it accounted for the largest market share in the base year.