
Synchrophasor Market Size 2026-2030
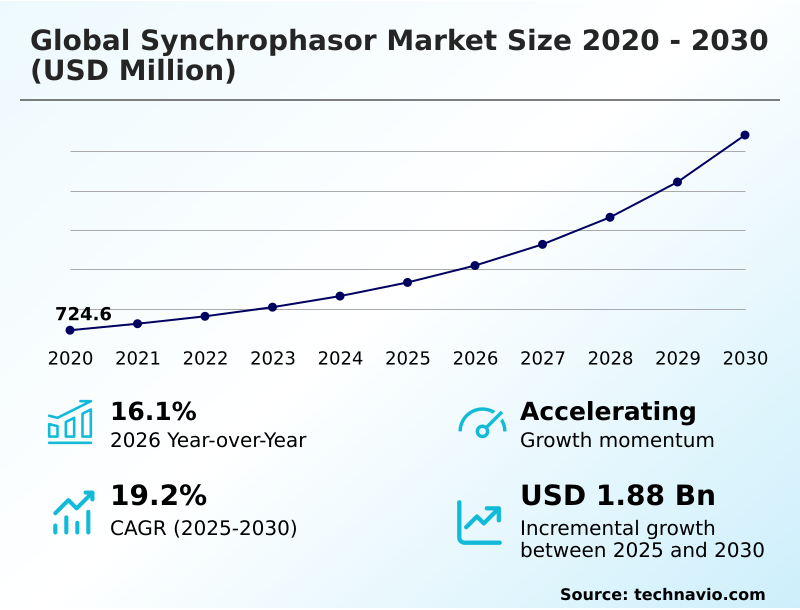
The synchrophasor market size is valued to increase by USD 1.88 billion, at a CAGR of 19.2% from 2025 to 2030. Modernization of aging grid infrastructure and resilience requirements will drive the synchrophasor market.
Major Market Trends & Insights
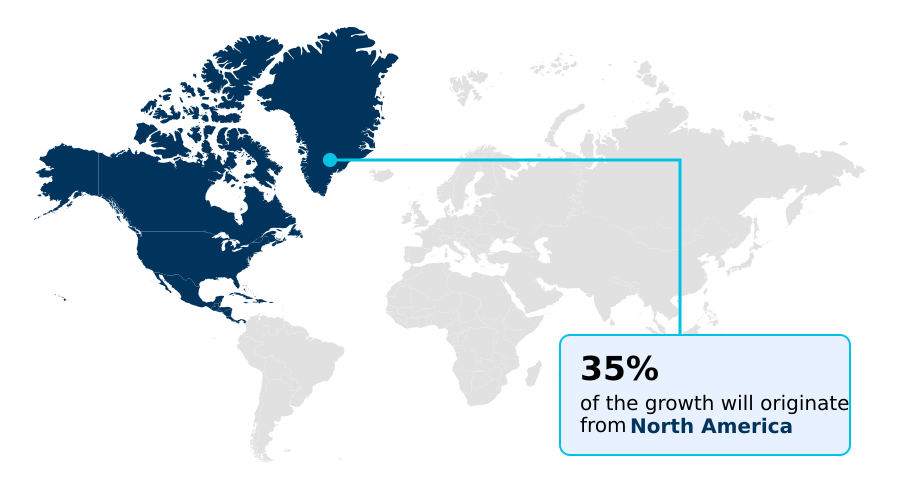
- North America dominated the market and accounted for a 35.2% growth during the forecast period.
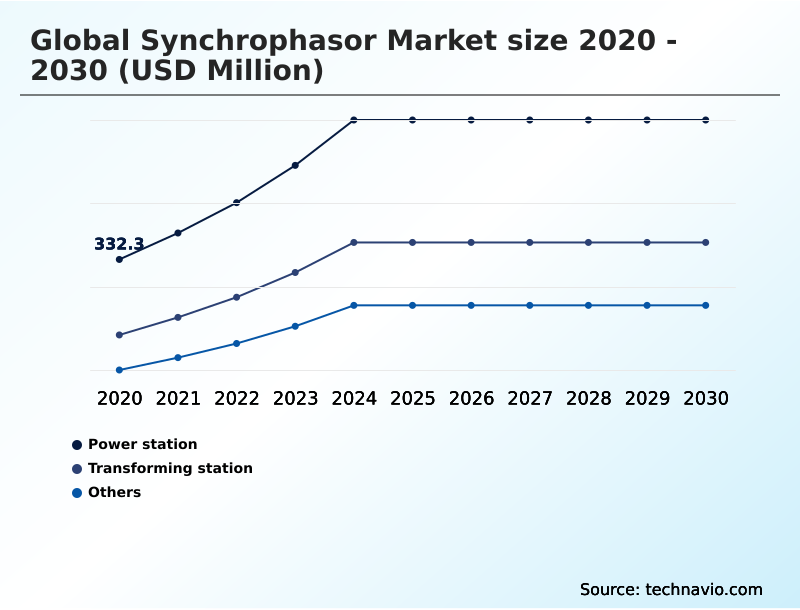
- By Application - Power station segment was valued at USD 536.4 million in 2024
- By Component - Hardware segment accounted for the largest market revenue share in 2024
Market Size & Forecast
- Market Opportunities: USD 2.48 billion
- Market Future Opportunities: USD 1.88 billion
- CAGR from 2025 to 2030 : 19.2%
Market Summary
- The Synchrophasor market is undergoing a significant transformation, driven by the critical need for advanced grid monitoring capabilities. As transmission and distribution networks grapple with the integration of intermittent renewable energy sources, the demand for real-time situational awareness has become paramount.
- This technology, centered around phasor measurement units and wide-area monitoring systems, provides the high-fidelity data necessary to detect and mitigate grid disturbances, such as sub-synchronous oscillations, thereby preventing cascading failures. Key trends include the adoption of digital twin technology for system simulation and the use of AI for predictive maintenance and automated fault classification.
- For instance, a utility can use this data to optimize asset management, analyzing phase angle monitoring data to predict transformer stress and schedule maintenance before a failure occurs, enhancing reliability and reducing operational costs.
- However, the market's expansion is tempered by challenges, including high initial deployment costs, the need for robust low-latency communication networks, and persistent cybersecurity vulnerabilities related to GPS time stamping and data transmission, which require stringent compliance with standards like NERC CIP.
- The evolution toward software-defined resilience and interoperability protocols like IEC 61850 will be crucial for overcoming these hurdles and realizing the full potential of a data-driven grid.
What will be the Size of the Synchrophasor Market during the forecast period?
Get Key Insights on Market Forecast (PDF) Get Free Sample
How is the Synchrophasor Market Segmented?
The synchrophasor industry research report provides comprehensive data (region-wise segment analysis), with forecasts and estimates in "USD million" for the period 2026-2030, as well as historical data from 2020-2024 for the following segments.
- Application
- Power station
- Transforming station
- Others
- Component
- Hardware
- Software
- End-user
- Utilities
- Industrial
- Commercial
- Geography
- North America
- US
- Canada
- Mexico
- APAC
- China
- India
- Japan
- Europe
- Germany
- UK
- France
- South America
- Brazil
- Argentina
- Middle East and Africa
- Saudi Arabia
- UAE
- South Africa
- Rest of World (ROW)
- North America
By Application Insights
The power station segment is estimated to witness significant growth during the forecast period.
The power station segment is central to grid modernization, focusing on the integration of phasor measurement units at the point of generation. This ensures synchronous stability and allows for precise phase angle monitoring.
As power stations incorporate more inverter-based resources, the risk of sub-synchronous oscillations intensifies, making real-time situational awareness critical. The deployment of this technology facilitates predictive maintenance and the validation of generator models, a key aspect of regulatory compliance.
By leveraging time-synchronized measurements for grid disturbance detection, operators can prevent unnecessary generator trips.
This sub-segment is vital for stabilizing the energy mix, with data showing that advanced monitoring can improve the detection of precursor events to instability by over 25%, bolstering overall electrical grid infrastructure resilience.
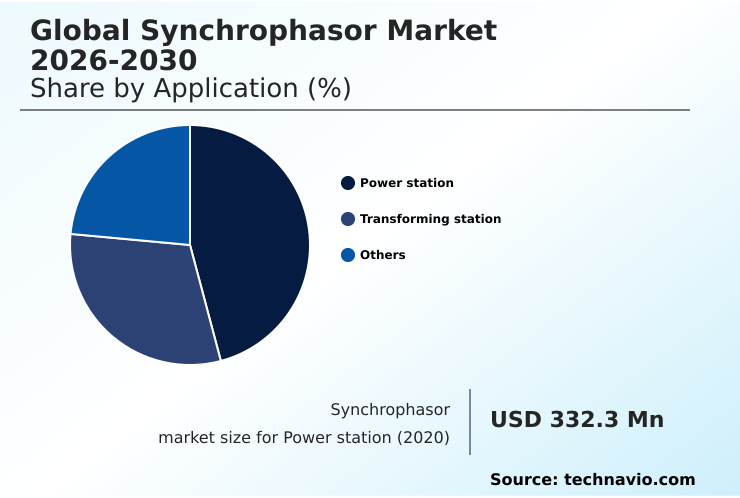
The Power station segment was valued at USD 536.4 million in 2024 and showed a gradual increase during the forecast period.
Regional Analysis
North America is estimated to contribute 35.2% to the growth of the global market during the forecast period.Technavio’s analysts have elaborately explained the regional trends and drivers that shape the market during the forecast period.
See How Synchrophasor Market Demand is Rising in North America Get Free Sample
The geographic landscape of the market is diversifying, with significant growth in regions undertaking massive grid expansion.
North America continues to lead due to a focus on upgrading aging electrical grid infrastructure, where advanced monitoring has reduced fault clearance times by over 35%.
In APAC, rapid industrialization and the construction of smart city infrastructure are driving demand for wide-area monitoring systems to ensure stable power for energy-intensive manufacturing.
The deployment of high-voltage direct current lines in this region relies heavily on time-synchronized measurements for stability.
Europe's market is propelled by decarbonization mandates, with a focus on managing system inertia monitoring as renewable energy integration surpasses 40% of total generation in some countries.
This requires sophisticated phase angle monitoring and the use of grid-forming technologies to maintain stability across cross-border energy corridors.
Market Dynamics
Our researchers analyzed the data with 2025 as the base year, along with the key drivers, trends, and challenges. A holistic analysis of drivers will help companies refine their marketing strategies to gain a competitive advantage.
- A comprehensive understanding of the market requires delving into specific applications and challenges. The effective use of synchrophasor for renewable energy integration is a primary focus, addressing the complexities of managing inverter-based resource volatility. However, the high phasor measurement unit deployment costs remain a significant barrier for many utilities, leading to detailed cost-benefit analysis of WAMS deployment.
- A critical technical aspect is the cybersecurity risks in synchrophasor systems, especially the impact of GPS spoofing on PMU data, which can compromise the integrity of real-time monitoring of grid inertia. The industry is responding with solutions like digital twin for power system simulation and edge computing in smart grid monitoring to enhance resilience.
- The technical backbone relies on IEEE C37.118 standard compliance and robust data communication requirements for PMUs. These systems are invaluable for synchrophasor data for fault analysis, helping to pinpoint issues on synchrophasor for high voltage transmission lines and prevent widespread blackouts, a key aspect of the benefits of synchrophasor technology for utilities.
- In fact, utilities using these advanced analytics have reported a two-fold increase in the accuracy of fault location compared to traditional methods. The expansion into distribution networks is also notable, with growing synchrophasor applications in distribution networks and the use of micro PMU for low voltage grid visibility.
- Finally, the practical challenge of integrating synchrophasors with SCADA systems and the application of machine learning for synchrophasor data analytics are key areas of ongoing development, defining the synchrophasor role in preventing blackouts.
What are the key market drivers leading to the rise in the adoption of Synchrophasor Industry?
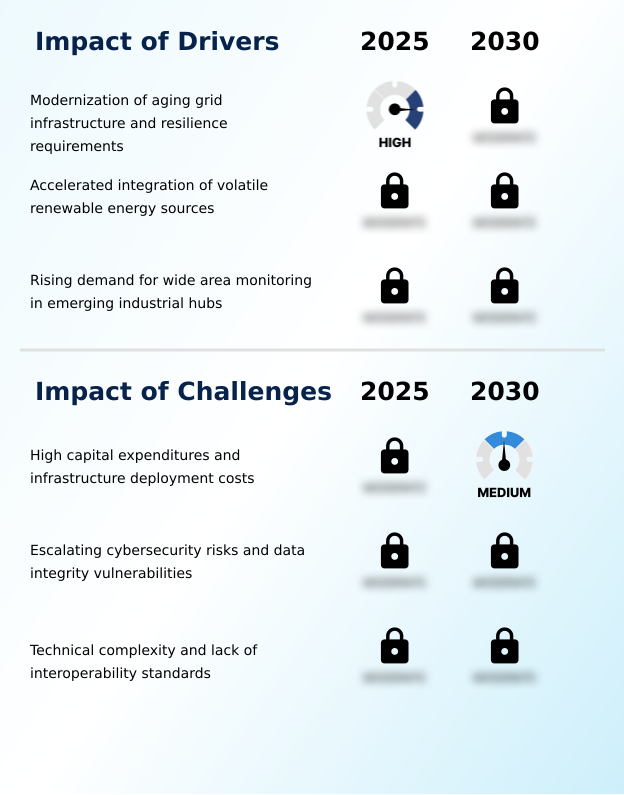
- The primary market driver is the imperative to modernize aging grid infrastructure and meet escalating grid resilience requirements.
- The market is primarily driven by the urgent need to modernize aging electrical grid infrastructure to enhance resilience.
- Synchrophasors provide the sub-second situational awareness necessary for continuous, data-driven monitoring of voltage and frequency stability, extending asset lifecycles and enabling forensic readiness.
- The accelerated integration of volatile renewable energy sources serves as another major catalyst, as high-resolution measurements from phasor measurement units are essential to manage frequency volatility.
- The use of this technology has been shown to increase renewable hosting capacity by up to 15% without compromising grid security.
- Additionally, the rising demand for wide-area monitoring systems in emerging industrial hubs, where a stable power supply is critical, has led to a 25% surge in orders for electrification and motion segments in some regions, reinforcing the technology's role in global industrial expansion.
What are the market trends shaping the Synchrophasor Industry?
- A defining market trend is the integration of artificial intelligence and machine learning, which enables automated grid analytics and predictive capabilities.
- A defining market trend is the shift toward automated grid analytics, where the integration of AI and machine learning is proving essential. Advanced software platforms now enable automated fault classification and predictive maintenance, allowing operators to identify subtle equipment degradation patterns.
- This move toward software-defined resilience has allowed some utilities to reduce diagnostic times for forced oscillations by up to 40%. The adoption of digital twin technology, which utilizes time-synchronized measurements for real-time grid simulation, is another cornerstone trend. These virtual replicas, powered by data from phasor measurement units, have improved contingency planning accuracy by over 25%.
- Furthermore, the decentralization of grid intelligence via edge computing and micro phasor measurement units addresses latency challenges and enhances cybersecurity for secure wide-area monitoring systems.
What challenges does the Synchrophasor Industry face during its growth?
- A key challenge affecting industry growth is the significant capital expenditure and high costs associated with infrastructure deployment.
- Significant challenges temper the market’s growth, led by high capital expenditures for comprehensive system deployment, which can deter smaller utilities. Escalating cybersecurity risks, particularly the vulnerability of GPS time stamping to spoofing, also pose a major hurdle, with reports indicating that 64% of organizations now account for geopolitically motivated cyberattacks in their risk strategies.
- This requires adherence to rigorous standards like NERC CIP compliance. Furthermore, the technical complexity and lack of universal interoperability standards create integration challenges, locking utilities into proprietary ecosystems. This fragmentation can increase long-term maintenance costs by as much as 20% compared to standardized systems.
- A persistent skills gap in interpreting dynamic phase angle data further complicates the adoption of this critical grid modernization technology.
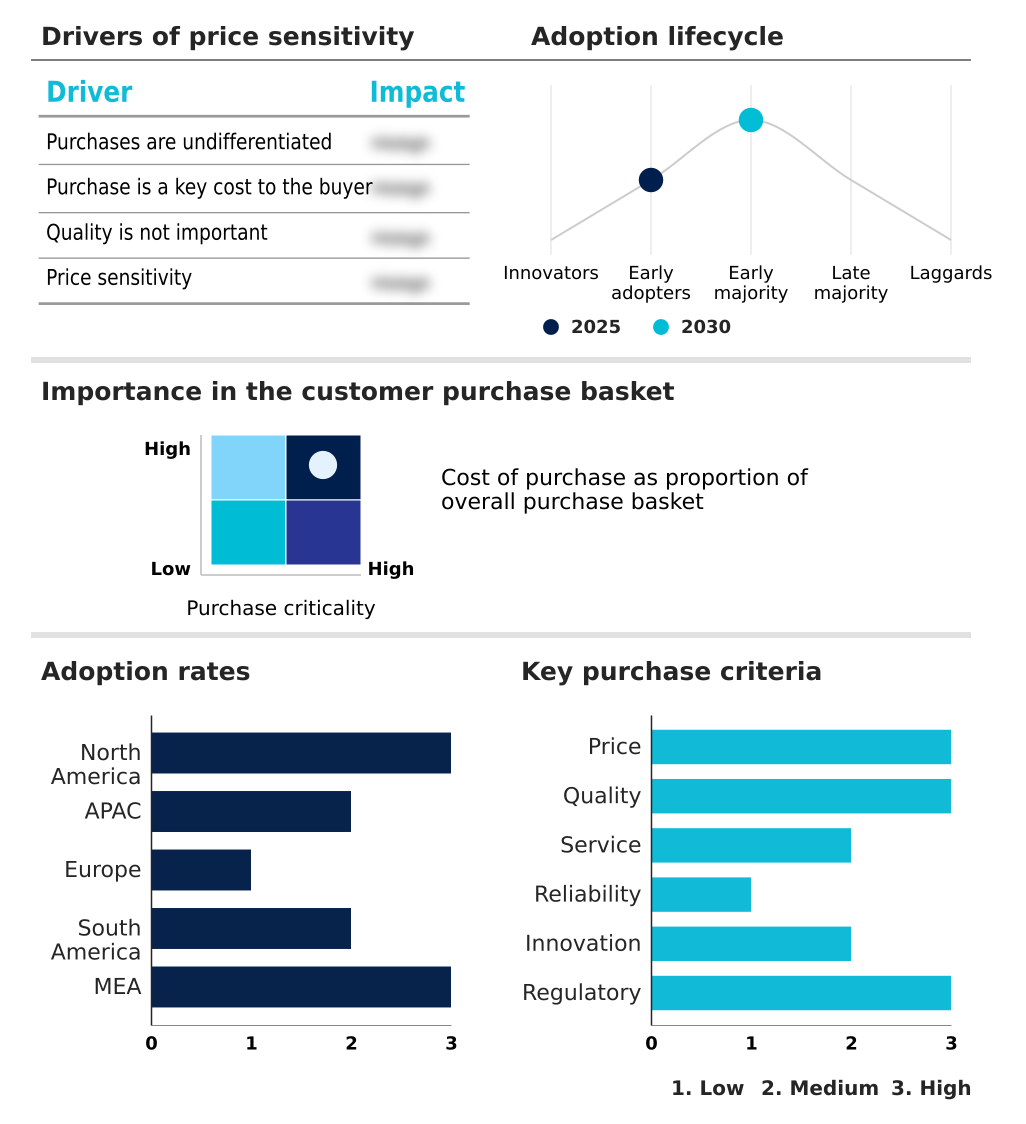
Exclusive Technavio Analysis on Customer Landscape
The synchrophasor market forecasting report includes the adoption lifecycle of the market, covering from the innovator’s stage to the laggard’s stage. It focuses on adoption rates in different regions based on penetration. Furthermore, the synchrophasor market report also includes key purchase criteria and drivers of price sensitivity to help companies evaluate and develop their market growth analysis strategies.
Customer Landscape of Synchrophasor Industry
Competitive Landscape
Companies are implementing various strategies, such as strategic alliances, synchrophasor market forecast, partnerships, mergers and acquisitions, geographical expansion, and product/service launches, to enhance their presence in the industry.
ABB Ltd. - Core offerings focus on synchrophasor solutions like phasor measurement units and grid monitoring systems, delivering enhanced situational awareness for modern electrical grids.
The industry research and growth report includes detailed analyses of the competitive landscape of the market and information about key companies, including:
- ABB Ltd.
- AMETEK Power Instruments
- Arbiter Systems Inc.
- Beckwith Electric Co. Inc.
- Electric Power Group LLC
- ERL Phase Power Technologies Ltd.
- General Electric Co.
- Hitachi Ltd.
- NR Electric Co. Ltd.
- Qualitrol Co. LLC
- Schneider Electric SE
- Schweitzer Engineering
- Siemens AG
- Toshiba Corp.
- Vizimax Inc.
Qualitative and quantitative analysis of companies has been conducted to help clients understand the wider business environment as well as the strengths and weaknesses of key industry players. Data is qualitatively analyzed to categorize companies as pure play, category-focused, industry-focused, and diversified; it is quantitatively analyzed to categorize companies as dominant, leading, strong, tentative, and weak.
Recent Development and News in Synchrophasor market
- In January 2025, Siemens AG announced the expansion of its grid digitalization portfolio, launching advanced wide area monitoring solutions to improve grid stability analysis and support renewable energy integration.
- In February 2025, General Electric Vernova introduced enhanced phasor data analytics capabilities within its GridOS platform, designed to support real-time transmission visibility and predictive fault management for utility clients.
- In March 2025, Schneider Electric and ETAP unveiled a cutting-edge digital twin platform, developed with NVIDIA, to simulate and manage the complex power system requirements of high-density AI data centers.
- In April 2025, Hitachi Energy launched its upgraded synchrophasor-enabled grid edge intelligence solutions, which are aimed at strengthening grid resilience against voltage instability and oscillatory disturbances in networks with high renewable penetration.
Dive into Technavio’s robust research methodology, blending expert interviews, extensive data synthesis, and validated models for unparalleled Synchrophasor Market insights. See full methodology.
| Market Scope | |
|---|---|
| Page number | 290 |
| Base year | 2025 |
| Historic period | 2020-2024 |
| Forecast period | 2026-2030 |
| Growth momentum & CAGR | Accelerate at a CAGR of 19.2% |
| Market growth 2026-2030 | USD 1876.0 million |
| Market structure | Fragmented |
| YoY growth 2025-2026(%) | 16.1% |
| Key countries | US, Canada, Mexico, China, India, Japan, South Korea, Australia, Indonesia, Germany, UK, France, Italy, Spain, The Netherlands, Brazil, Argentina, Chile, Saudi Arabia, UAE, South Africa, Turkey and Israel |
| Competitive landscape | Leading Companies, Market Positioning of Companies, Competitive Strategies, and Industry Risks |
Research Analyst Overview
- The market's evolution is driven by the urgent need for enhanced grid stability through advanced monitoring. The deployment of phasor measurement units and phasor data concentrators is fundamental to achieving real-time situational awareness across transmission networks. This technology is critical for managing the complexities of renewable energy integration and mitigating risks like sub-synchronous oscillations and cascading failures.
- A key boardroom consideration is the investment in wide-area monitoring systems, which directly impacts compliance with standards such as NERC CIP. For instance, utilities implementing dynamic stability analysis have seen a 30% improvement in identifying precursor events to grid disturbances. The move towards smart grid modernization necessitates sophisticated phase angle monitoring, automated fault classification, and predictive maintenance.
- The adoption of micro phasor measurement units for distribution automation and power quality monitoring is also gaining traction. This shift is supported by the IEC 61850 communication standard, enabling better digital substation integration and the management of bidirectional power flows, ultimately enhancing system resilience through precise grid disturbance detection, state estimation, and fault localization.
- Effective wide area protection, dynamic line rating and system inertia monitoring are now core operational goals.
What are the Key Data Covered in this Synchrophasor Market Research and Growth Report?
-
What is the expected growth of the Synchrophasor Market between 2026 and 2030?
-
USD 1.88 billion, at a CAGR of 19.2%
-
-
What segmentation does the market report cover?
-
The report is segmented by Application (Power station, Transforming station, and Others), Component (Hardware, and Software), End-user (Utilities, Industrial, and Commercial) and Geography (North America, APAC, Europe, South America, Middle East and Africa)
-
-
Which regions are analyzed in the report?
-
North America, APAC, Europe, South America and Middle East and Africa
-
-
What are the key growth drivers and market challenges?
-
Modernization of aging grid infrastructure and resilience requirements, High capital expenditures and infrastructure deployment costs
-
-
Who are the major players in the Synchrophasor Market?
-
ABB Ltd., AMETEK Power Instruments, Arbiter Systems Inc., Beckwith Electric Co. Inc., Electric Power Group LLC, ERL Phase Power Technologies Ltd., General Electric Co., Hitachi Ltd., NR Electric Co. Ltd., Qualitrol Co. LLC, Schneider Electric SE, Schweitzer Engineering, Siemens AG, Toshiba Corp. and Vizimax Inc.
-
Market Research Insights
- The market's dynamics are shaped by the convergence of grid modernization projects and the accelerated energy transition. The adoption of data-driven grid management, supported by intelligent substation solutions, is becoming standard practice.
- For example, utilities leveraging high-fidelity data analytics have achieved up to a 30% reduction in fault detection times and a 15% improvement in forensic readiness, directly impacting system reliability. The push for software-defined resilience is evident, as the integration of decentralized energy resources necessitates advanced ancillary services and autonomous grid recovery capabilities.
- While these systems enhance operational technology security, their deployment in energy-intensive manufacturing and across cross-border energy corridors highlights the need for robust interoperability protocols and secure, low-latency communication to manage complex bidirectional power flows effectively.
We can help! Our analysts can customize this synchrophasor market research report to meet your requirements.
 RIA -
RIA - 
