
Synthetic Data Generation Platforms Market Size and Growth Forecast 2026-2030
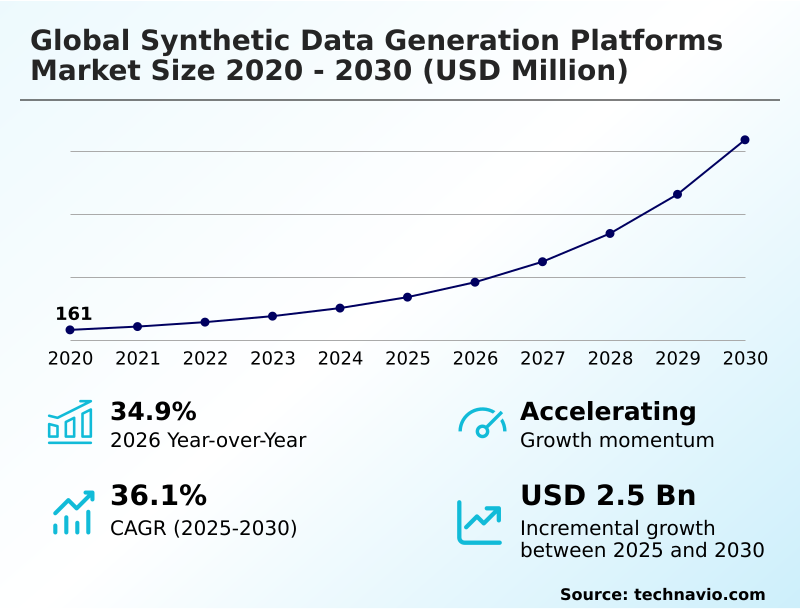
The Synthetic Data Generation Platforms Market size was valued at USD 681.7 million in 2025 growing at a CAGR of 36.1% during the forecast period 2026-2030.
North America accounts for 39% of incremental growth during the forecast period. The Tabular data segment by Type was valued at USD 207.3 million in 2024, while the Fully synthetic data segment holds the largest revenue share by Product Type.
The market is projected to grow by USD 3.02 billion from 2020 to 2030, with USD 2.50 billion of the growth expected during the forecast period of 2025 to 2030.
Get Key Insights on Market Forecast (PDF) Request Free Sample
Synthetic Data Generation Platforms Market Overview
The synthetic data generation platforms market is defined by the critical need to balance data-driven innovation with stringent privacy mandates. With North America accounting for nearly 39% of market growth, the demand is driven by sectors navigating complex legal frameworks like HIPAA. The core technology, including generative adversarial networks and variational autoencoders, enables the creation of de-identified datasets that are statistically representative of real-world information. This capability is vital for privacy-preserving analytics and addressing data scarcity. For instance, a financial services firm can use a platform for synthetic transaction data to train anti-money laundering simulation models without exposing any personally identifiable information, thereby enhancing security while complying with data protection laws. This process of automated data augmentation is fundamental for data-centric AI development, allowing for rare edge cases simulation and algorithmic bias reduction, which are essential for building robust and fair machine learning models for computer vision applications and other high-stakes use cases.
Drivers, Trends, and Challenges in the Synthetic Data Generation Platforms Market
The global synthetic data generation platforms market for AI training and regulatory compliance is expanding as organizations navigate complex legal frameworks like the EU AI Act. Enterprises are leveraging these platforms to ensure data privacy, especially for cross-border data sharing, where adherence to multiple jurisdictions' rules is mandatory.
The global synthetic data generation platforms market for healthcare research, for instance, allows for the creation of artificial patient records, enabling large-scale studies without violating HIPAA. Similarly, the global synthetic data generation platforms market for financial modeling utilizes synthetic transaction data to test fraud detection algorithms.
A key application is in autonomous systems testing, where the global synthetic data generation platforms market for autonomous systems testing provides millions of simulated scenarios, a task that is safer and more cost-effective than real-world testing.
An automotive OEM, for example, can use these platforms to train its perception systems on rare edge cases, reducing development time by over 50% compared to physical data collection. This focus on data-centric AI helps mitigate algorithmic bias and enhances model fairness.
The growth in cloud-based services further democratizes access to these powerful tools for test data automation and computer vision applications, solidifying the importance of the global synthetic data generation platforms market for software development.
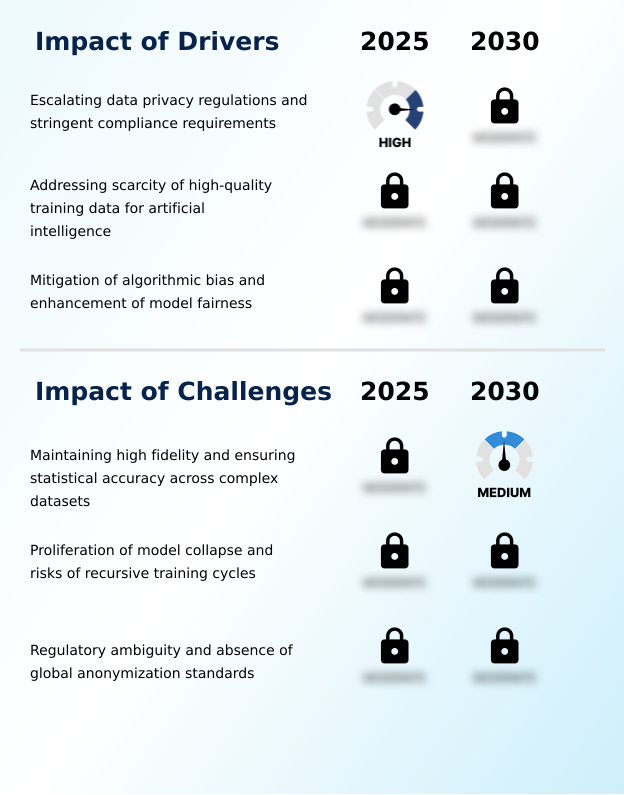
Primary Growth Driver: Escalating data privacy regulations and stringent compliance requirements are the primary drivers for market expansion.
Market growth is primarily driven by escalating data privacy regulations, such as GDPR and CCPA, which mandate stringent compliance requirements and data minimization. This has created an urgent need for privacy compliant datasets, pushing organizations toward privacy-by-design approaches.
Furthermore, the rapid proliferation of multi-modal AI systems has created an unprecedented demand for high-quality training data, which real-world sources alone cannot satisfy.
Synthetic data platforms address this by providing vast quantities of labeled training data on demand, enabling rare edge cases simulation critical for the safety and reliability of autonomous systems.
With the market growing at 34.9% year-over-year, the ability to generate customized datasets for algorithmic fairness testing and bias reduction has become a key competitive advantage.
Emerging Market Trend: The proliferation of generative AI integration is enabling automated data augmentation, allowing organizations to create high-quality, diverse training datasets on demand.
Key market trends are centered on the integration of generative AI for automated data augmentation and the convergence of synthetic data with differential privacy. The market is also seeing a rise of industry-specific verticals, particularly in high-stakes environments like finance and healthcare.
These platforms now employ advanced generative diffusion models and neural radiance fields to create high-fidelity, photorealistic image data for computer vision applications. This evolution supports a data-centric AI development approach, where the focus shifts from model tweaking to curating high-quality training data.
As a result, synthetic data repositories are becoming crucial assets, enabling data exhaustion mitigation and accelerating data-driven innovation across various sectors, with the tabular data segment alone projected to grow significantly.
Key Industry Challenge: Maintaining high fidelity and ensuring statistical accuracy across complex datasets represents a key challenge affecting industry growth.
The primary challenge is maintaining high fidelity while ensuring statistical accuracy, a trade-off that can lead to a fidelity gap where privacy is prioritized over utility. This is especially problematic in applications requiring complex data, such as synthetic control arms in clinical trials, where current techniques may not fully capture long-term interactions.
Another significant technical hurdle is the risk of model collapse, a phenomenon where recursive training cycles on synthetic data degrade model quality and diversity. This challenge is amplified by the absence of robust data provenance standards.
Furthermore, regulatory ambiguity and the lack of global anonymization standards create legal uncertainty, with concerns over membership inference attacks hindering full-scale adoption in risk-averse enterprises.
Explore Full Market Dynamics Analysis Request Free Sample
Synthetic Data Generation Platforms Market Segmentation
The synthetic data generation platforms industry research report provides comprehensive data including region-wise segment analysis, with forecasts and analysis for the period 2026-2030, as well as historical data from 2020-2024 for the following segments.
Type Segment Analysis
The tabular data segment is estimated to witness significant growth during the forecast period.
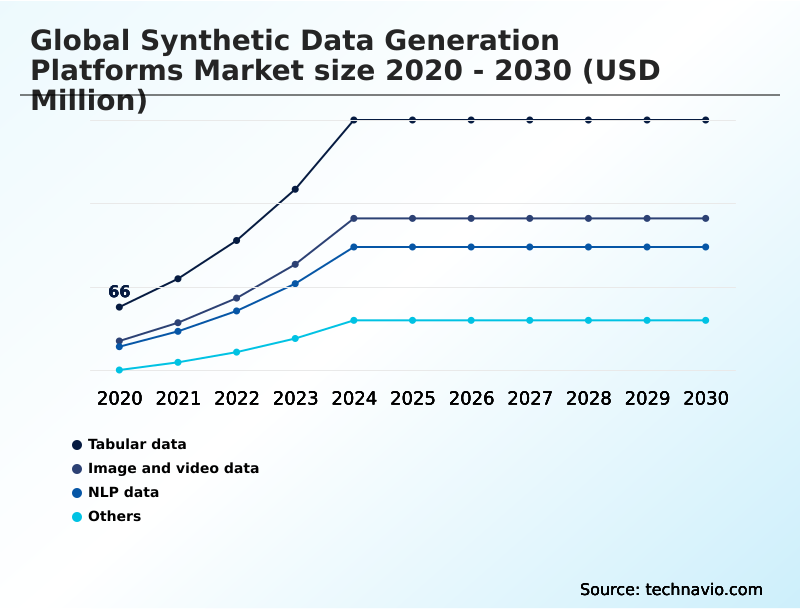
The synthetic data generation platforms market is segmented by data type, with tabular data synthesis being the largest and most foundational category.
This segment, representing over 40% of the market in 2024, is crucial for organizations that need to share sensitive information without violating regulations like the GDPR.
Techniques such as variational autoencoders are used to create statistically accurate but artificial records for financial services and healthcare. Image and video data, driven by computer vision applications and autonomous systems training, represents the next largest segment.
The use of photorealistic image data and high-fidelity simulation accelerates the development of autonomous vehicles. The NLP data segment is expanding rapidly, fueled by the need for synthetic conversational data to train large language models for customer service and other applications.
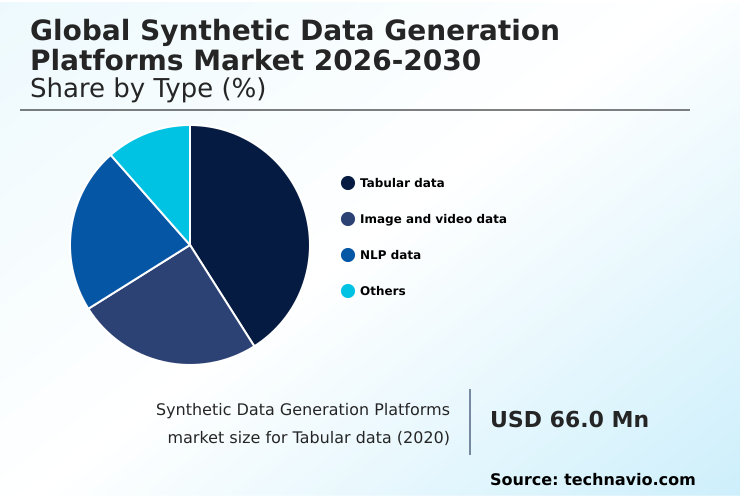
The Tabular data segment was valued at USD 207.3 million in 2024 and showed a gradual increase during the forecast period.
Synthetic Data Generation Platforms Market by Region: North America Leads with 39% Growth Share
North America is estimated to contribute 39% to the growth of the global market during the forecast period.
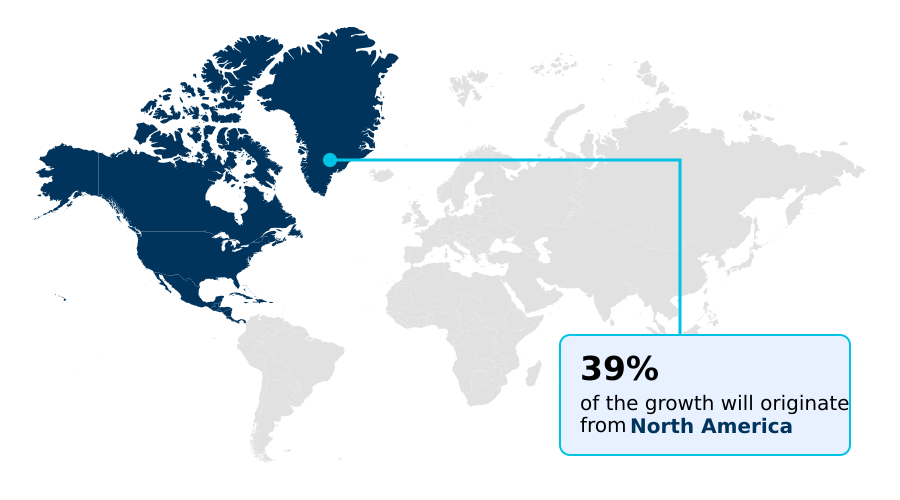
The geographic landscape is led by North America, which accounts for approximately 39% of the market's incremental growth, driven by advanced AI research and stringent data privacy laws like CCPA.
The US and Canada are epicenters for financial services data simulation and healthcare data anonymization. Europe follows, with its market shaped by the General Data Protection Regulation (GDPR), pushing organizations toward GDPR compliant data solutions.
APAC is the fastest-growing region, with a 36.9% CAGR, as countries like China and India ramp up AI investments, driving demand for autonomous vehicle simulation and retail data modeling.
These regions are increasingly adopting cross-border data sharing protocols that rely on privacy-enhancing technologies to maintain data security and utility for data-driven innovation.
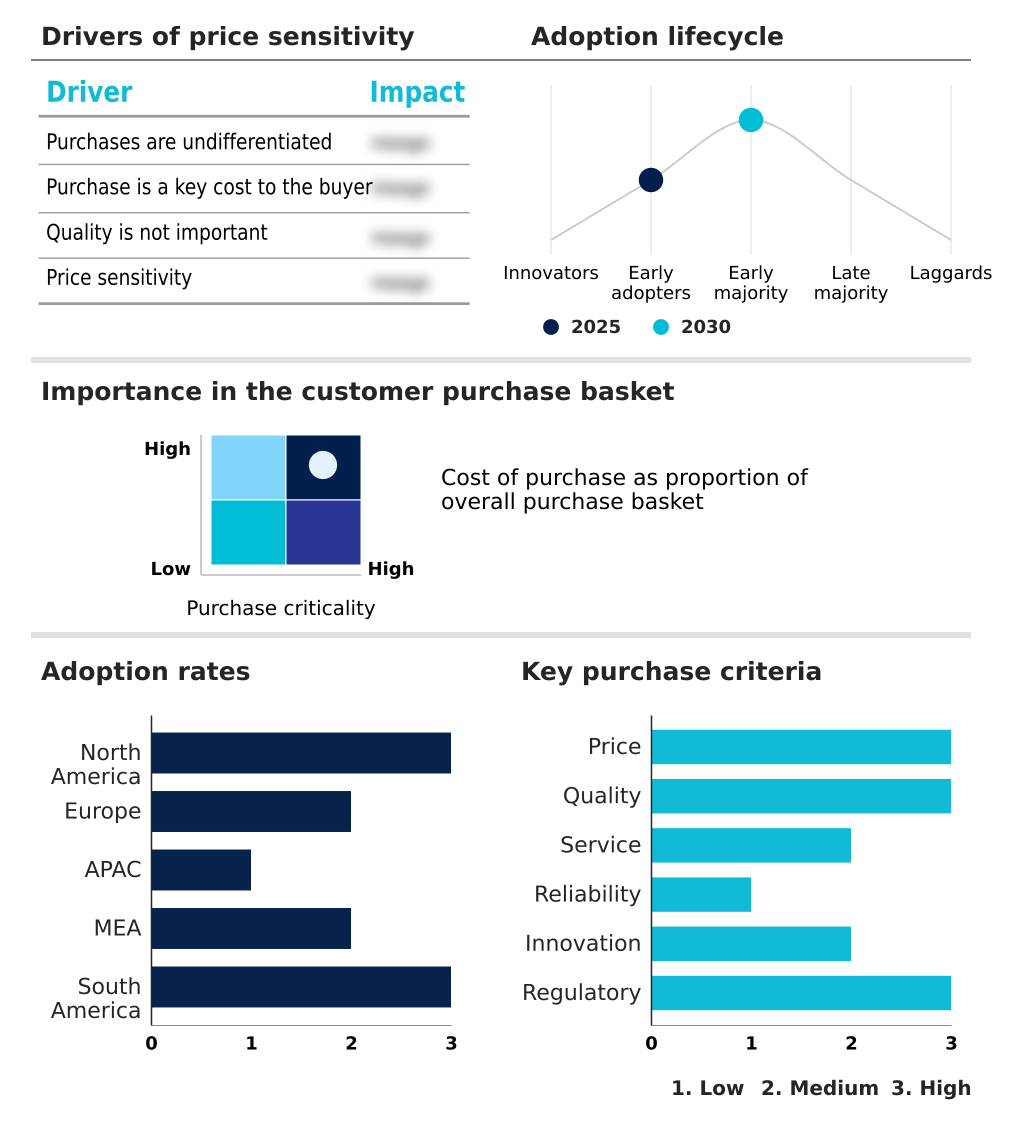
Customer Landscape Analysis for the Synthetic Data Generation Platforms Market
The synthetic data generation platforms market forecasting report includes the adoption lifecycle of the market, covering from the innovator’s stage to the laggard’s stage. It focuses on adoption rates in different regions based on penetration. Furthermore, the synthetic data generation platforms market report also includes key purchase criteria and drivers of price sensitivity to help companies evaluate and develop their market growth analysis strategies.
Competitive Landscape of the Synthetic Data Generation Platforms Market
Companies are implementing various strategies, such as strategic alliances, partnerships, mergers and acquisitions, geographical expansion, and product/service launches, to enhance their presence in the synthetic data generation platforms market industry.
Anonos. - Key offerings include advanced platforms utilizing generative models to produce statistically accurate, privacy-compliant datasets for AI training, software testing, and analytics across regulated industries.
The industry research and growth report includes detailed analyses of the competitive landscape of the market and information about key companies, including:
- Anonos.
- BetterData Pte Ltd.
- Broadcom Inc.
- Capgemini SE
- DataGen.
- Facteus Inc.
- GenRocket Inc.
- Gretel AI
- Informatica Inc.
- K2view Ltd.
- MDClone Ltd.
- MOSTLY AI
- Oracle Corp.
- Parallel Domain
- Perforce Software Inc.
- Rendered.ai
- SAP SE
- Syntho
- Tonic AI Inc.
- YData Labs Inc
Qualitative and quantitative analysis of companies has been conducted to help clients understand the wider business environment as well as the strengths and weaknesses of key industry players. Data is qualitatively analyzed to categorize companies as pure play, category-focused, industry-focused, and diversified; it is quantitatively analyzed to categorize companies as dominant, leading, strong, tentative, and weak.
Recent Developments in the Synthetic Data Generation Platforms Market
- In March 2025, NVIDIA Corp. acquired Gretel AI, a provider of developer-centric synthetic data tools, in a deal valued at several hundred million dollars to integrate data synthesis directly into the AI development stack.
- In April 2025, Amazon Web Services launched the Synthetic Data Factory within its SageMaker platform, offering automated tools for generating photorealistic image data and complex tabular records for training foundation models.
- In May 2025, Google Cloud introduced an advanced synthetic text generation tool for healthcare providers, enabling the de-identification of patient transcripts while preserving clinical nuances for medical research and ensuring patient confidentiality.
- In August 2025, Meta Platforms announced a major expansion in its use of synthetic conversational data to train its latest multi-modal AI systems, addressing the need for linguistic diversity in global applications without infringing on user privacy.
Research Analyst Overview: Synthetic Data Generation Platforms Market
The synthetic data generation platforms market's trajectory is dictated by the enterprise need to de-risk AI development while accelerating innovation. With tabular data synthesis commanding the largest market share, boardroom decisions on capital expenditure are increasingly tied to a platform's ability to ensure statistical accuracy validation and regulatory compliance frameworks under mandates like ISO/IEC 23894-2.
The core value lies in using privacy-enhancing technologies like generative adversarial networks to enable privacy-preserving analytics and data-centric AI development. This shift away from raw data is critical for autonomous systems training and mitigating the model collapse phenomenon associated with recursive training cycles.
A key operational reality is the use of high-fidelity simulation for computer vision applications, which allows for robust testing without the high costs and risks of real-world data collection. As such, these platforms are becoming a non-negotiable part of enterprise data strategies for any organization serious about deploying fair and reliable AI.
Dive into Technavio’s robust research methodology, blending expert interviews, extensive data synthesis, and validated models for unparalleled Synthetic Data Generation Platforms Market insights. See full methodology.
| Market Scope | |
|---|---|
| Page number | 296 |
| Base year | 2025 |
| Historic period | 2020-2024 |
| Forecast period | 2026-2030 |
| Growth momentum & CAGR | Accelerate at a CAGR of 36.1% |
| Market growth 2026-2030 | USD 2503.2 million |
| Market structure | Fragmented |
| YoY growth 2025-2026(%) | 34.9% |
| Key countries | US, Canada, Mexico, UK, Germany, France, Italy, The Netherlands, Spain, China, India, Japan, South Korea, Australia, Indonesia, Saudi Arabia, UAE, South Africa, Israel, Turkey, Brazil, Argentina and Colombia |
| Competitive landscape | Leading Companies, Market Positioning of Companies, Competitive Strategies, and Industry Risks |
Synthetic Data Generation Platforms Market: Key Questions Answered in This Report
-
What is the expected growth of the Synthetic Data Generation Platforms Market between 2026 and 2030?
-
The Synthetic Data Generation Platforms Market is expected to grow by USD 2.50 billion during 2026-2030, registering a CAGR of 36.1%. Year-over-year growth in 2026 is estimated at 34.9%%. This acceleration is shaped by escalating data privacy regulations and stringent compliance requirements, which is intensifying demand across multiple end-use verticals covered in the report.
-
-
What segmentation does the market report cover?
-
The report is segmented by Type (Tabular data, Image and video data, NLP data, and Others), Product Type (Fully synthetic data, and Partially synthetic data), Deployment (Cloud based, and On premises) and Geography (North America, Europe, APAC, Middle East and Africa, South America). Among these, the Tabular data segment is estimated to witness significant growth during the forecast period, driven by rising adoption across key application areas. Each segment includes detailed qualitative and quantitative analysis, along with historical data from 2020-2024 and forecasts through 2030 with year-over-year growth rates.
-
-
Which regions are analyzed in the report?
-
The report covers North America, Europe, APAC, Middle East and Africa and South America. North America is estimated to contribute 39% to market growth during the forecast period. Country-level analysis includes US, Canada, Mexico, UK, Germany, France, Italy, The Netherlands, Spain, China, India, Japan, South Korea, Australia, Indonesia, Saudi Arabia, UAE, South Africa, Israel, Turkey, Brazil, Argentina and Colombia, with dedicated market size tables and year-over-year growth for each.
-
-
What are the key growth drivers and market challenges?
-
The primary driver is escalating data privacy regulations and stringent compliance requirements, which is accelerating investment and industry demand. The main challenge is maintaining high fidelity and ensuring statistical accuracy across complex datasets, creating operational barriers for key market participants. The report quantifies the impact of each driver and challenge across 2026 and 2030 with comparative analysis.
-
-
Who are the major players in the Synthetic Data Generation Platforms Market?
-
Key vendors include Anonos., BetterData Pte Ltd., Broadcom Inc., Capgemini SE, DataGen., Facteus Inc., GenRocket Inc., Gretel AI, Informatica Inc., K2view Ltd., MDClone Ltd., MOSTLY AI, Oracle Corp., Parallel Domain, Perforce Software Inc., Rendered.ai, SAP SE, Syntho, Tonic AI Inc. and YData Labs Inc. The report provides qualitative and quantitative analysis categorizing companies as dominant, leading, strong, tentative, and weak based on their market positioning. Company profiles include business segment analysis, SWOT assessment, key offerings, and recent strategic developments.
-
Synthetic Data Generation Platforms Market Research Insights
Market dynamics are heavily shaped by the need for privacy compliant datasets, with organizations adopting a data product approach to manage test data management and software testing automation. As frameworks like the General Data Protection Regulation (GDPR) and the California Consumer Privacy Act (CCPA) become more stringent, platforms offering GDPR compliant data and CCPA data compliance are critical.
North America leads market expansion, contributing over 39% of incremental growth, while the APAC region shows the fastest year-over-year growth at 36.9%. This reflects a global shift toward data utility metrics and model fairness assessment in AI ethics and governance.
Enterprises are leveraging digital sandbox environments for machine learning model validation and cybersecurity threat analysis, using synthetic data to correct data imbalances without risking sensitive information.
We can help! Our analysts can customize this synthetic data generation platforms market research report to meet your requirements.
 RIA -
RIA - 
