System-On-Chip (SOC) Test Equipment Market Analysis, Size, and Forecast 2025-2029: North America (US, Canada, and Mexico), Europe (France and Germany), APAC (Australia, China, India, Japan, and South Korea), and Rest of World (ROW)

System-On-Chip (SOC) Test Equipment Market Analysis, Size, and Forecast 2025-2029:
North America (US, Canada, and Mexico), Europe (France and Germany), APAC (Australia, China, India, Japan, and South Korea), and Rest of World (ROW)

Published: May 2025 227 Pages SKU: IRTNTR73789

Market Overview at a Glance

$2.50 B
Market Opportunity
9.5%
CAGR
9.2
YoY growth 2024-2025(%)

System-On-Chip (SOC) Test Equipment Market Size 2025-2029

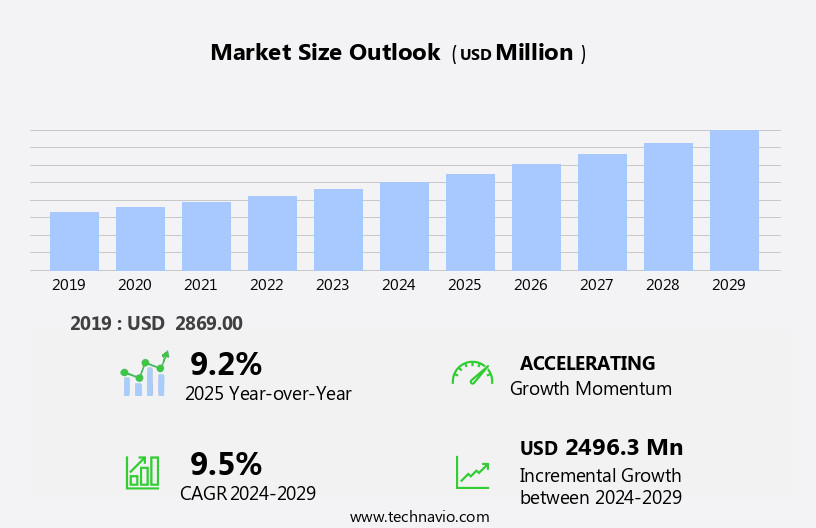
The system-on-chip (SOC) test equipment market size is forecast to increase by USD 2.5 billion at a CAGR of 9.5% between 2024 and 2029.

  • The market experiences robust growth, driven by the escalating demand for SOCs due to their benefits, including power efficiency, reduced form factor, and enhanced performance. This trend is further fueled by the adoption of Field-Programmable Gate Array (FPGA) and embedded testing technologies, enabling real-time testing and debugging of complex SOC designs. However, regulatory hurdles impact adoption, with stringent regulations governing the production and testing of SOCs in various industries. Additionally, supply chain inconsistencies temper growth potential, as the globalized supply chain for SOC components and test equipment presents challenges in terms of quality, reliability, and delivery. A significant challenge emerging in the market is the growing risk of cybersecurity threats from foreign electronic Original Equipment Manufacturers (OEMs), necessitating robust security measures to protect intellectual property and maintain data confidentiality. Key trends include the integration of advanced processor technologies to reduce energy waste, the rise of 5G technology and the Internet of Things (IoT) driving increased investments, and the reliance of SOC companies on IP core providers.
  • Companies seeking to capitalize on market opportunities and navigate challenges effectively must focus on innovation, regulatory compliance, and supply chain resilience. Power consumption and efficiency remain critical concerns, with the need for continuous innovation to meet the demands of AI and computing activities.

What will be the Size of the System-On-Chip (SOC) Test Equipment Market during the forecast period?

System-On-Chip (SOC) Test Equipment Market Size

 Request Free Sample

  • The SOC test equipment market is experiencing significant activity and trends, driven by the increasing complexity of integrated circuits and the need for efficient and accurate testing. Test cost optimization is a key focus, with test environment and design-for-testability (DFT) playing crucial roles in reducing testing costs. Functional verification, test analysis, and system integration require advanced test software and reporting tools to ensure thorough testing and quick identification of issues. Thermal verification and test process improvement are essential for ensuring reliable operation in extreme temperatures and reducing testing time. Test data generation, test automation tools, and test infrastructure are vital components of the test process, enabling efficient and effective testing of performance verification, power verification, and test optimization. Multi-chip systems, and Power management systems. SOCs are utilized in various applications such as IT, telecommunication, laptops, Macs, iPads, database management, fraud detection systems, cybersecurity, and more
  • Firmware development and security verification require specialized tools and techniques, including fault coverage analysis, test case management, test scripting, and fault simulation. Test hardware and test development are integral to design validation, with built-in self-test (BIST) and reliability verification ensuring the integrity of the silicon. Power verification and performance optimization are critical for meeting the demands of modern applications, while test metrics and test results databases enable data-driven test strategy decisions and continuous improvement. In the realm of software development, test automation tools and test scripting are essential for efficient and effective testing of embedded software.
  • Overall, the SOC test equipment market is dynamic and evolving, with a focus on improving testing efficiency, accuracy, and cost-effectiveness while addressing the challenges of increasing design complexity and the need for advanced verification capabilities.

How is this System-On-Chip (SOC) Test Equipment Industry segmented?

The system-on-chip (SOC) test equipment industry research report provides comprehensive data (region-wise segment analysis), with forecasts and estimates in "USD million" for the period 2025-2029, as well as historical data from 2019-2023 for the following segments.

  • Application
    • Consumer electronics
    • IT and telecommunication
    • Automotive
    • Others
  • End-user
    • Integrated device manufacturer
    • Foundry
    • Design house
  • Deployment
    • On-premises
    • Cloud-based
    • Hybrid
  • Geography
    • North America
      • US
      • Canada
      • Mexico
    • Europe
      • France
      • Germany
    • APAC
      • Australia
      • China
      • India
      • Japan
      • South Korea
    • Rest of World (ROW)

By Application Insights

The consumer electronics segment is estimated to witness significant growth during the forecast period. The SOC test equipment market encompasses various applications, including test results analysis, design verification, and system validation for consumer electronics, automotive electronics, industrial automation, and high-performance computing. Consumer electronics, which include smartphones, smartwatches, tablets, and smart home appliances, dominate the market due to their mass production. SOC devices, integrated into these products, reduce power consumption and increase run time on single charges, making them indispensable. Moreover, SOC technology enables miniaturization, contributing to the market's growth. Test coverage and test data management are crucial elements in post-silicon validation, ensuring the functionality and reliability of SOC devices. Furthermore, with the advent of 5G technology and the Internet of Things (IoT), the SOC market is witnessing significant growth.

Serial and memory interfaces, parallel and bus interfaces, and digital-to-analog and analog-to-digital converters are essential for memory testing and functional test. Functional safety, test standards, and defect analysis are integral parts of the design verification process. Test automation, test time reduction, and test efficiency are key drivers in the market, with test bench development and test reporting streamlining the testing process. Pre-silicon validation and power analysis are essential for optimizing design performance and reducing test costs. Protocol analysis and boundary scan help identify and resolve design issues, while test patterns and test vectors ensure comprehensive testing.

System-On-Chip (SOC) Test Equipment Market Size

Request Free Sample

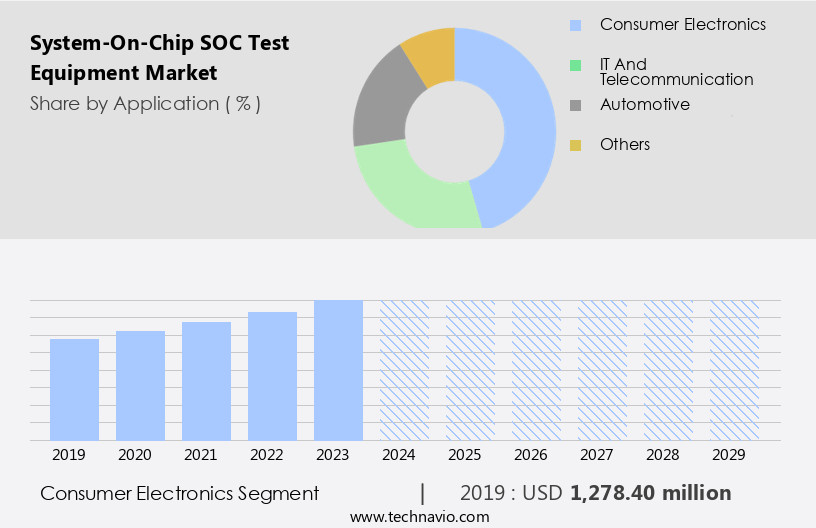
The Consumer electronics segment was valued at USD 1.28 billion in 2019 and showed a gradual increase during the forecast period. The emergence of 5G technology, edge computing, and cloud computing is driving the adoption of SOC testing in various industries, including automotive electronics, industrial automation, and data centers. Machine learning and artificial intelligence are also transforming the testing landscape, enabling predictive maintenance and real-time fault detection. In-circuit testing and test fixtures are essential for ensuring the quality and reliability of electronic manufacturing. RF testing and power analysis are crucial for evaluating the performance of wireless communication systems and power management circuits. Overall, the SOC test equipment market is witnessing significant growth due to the increasing demand for advanced and reliable electronic systems across various industries.

Regional Analysis

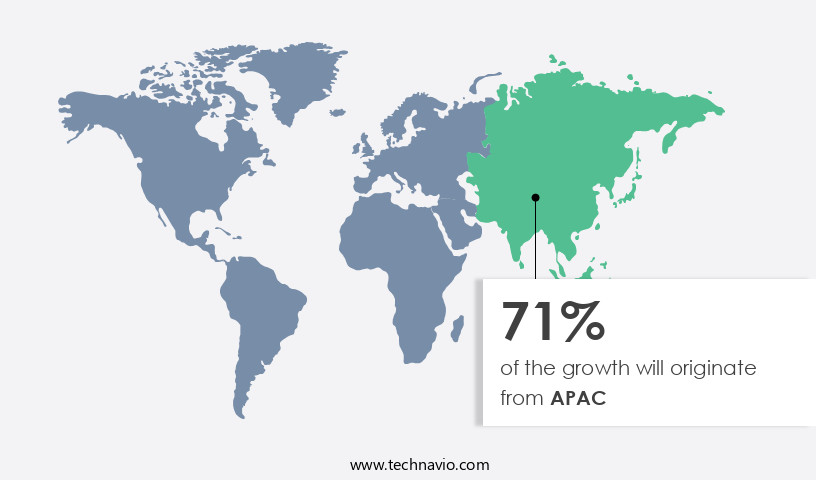
APAC is estimated to contribute 71% to the growth of the global market during the forecast period. Technavio's analysts have elaborately explained the regional trends and drivers that shape the market during the forecast period.

System-On-Chip (SOC) Test Equipment Market Share by Geography

Download Free Sample Report

The SOC test equipment market in the Asia-Pacific (APAC) region is experiencing significant growth due to increasing investments in telecommunication network infrastructure and the rising demand for advanced electronics in consumer electronics and the automotive industries. Telecommunication network equipment providers, including Huawei Technologies, Nokia, ZTE Corp., China Telecom Global Ltd., China Mobile Ltd., China Unicom (Hong Kong) Ltd., and SK Telecom Co. Ltd., are aggressively investing in the development of 4G and 5G networks in the region, driving the demand for advanced test equipment. Consumer electronics companies, such as Samsung and Xiaomi, are also contributing to the market growth by releasing new mobile devices with advanced features, requiring rigorous testing.

Functional safety and test standards are becoming increasingly important in the automotive industry, leading to an increase in demand for test equipment for automotive electronics. Design verification, test cost reduction, yield enhancement, and test time reduction are key challenges driving the development of innovative test solutions. Test data management, test coverage analysis, debug and trace, performance test, defect analysis, and test reporting are essential components of the SOC testing process. Advanced test equipment is also required for testing complex interfaces, such as serial, memory, bus, parallel, and RF interfaces, as well as digital-to-analog and analog-to-digital converters.

Test automation, machine learning, artificial intelligence, high-performance computing, and cloud computing are also playing an increasingly important role in the SOC testing process. The industrial automation sector is also a significant contributor to the market growth, with the need for reliable and efficient testing solutions for various applications, including power analysis, test efficiency, and boundary scan testing. Test fixtures and test benches are essential components of the test equipment landscape, enabling efficient and accurate testing of SOCs. In summary, the SOC test equipment market in the APAC region is experiencing robust growth due to the increasing demand for advanced electronics in consumer electronics, automotive, and industrial automation industries, as well as the deployment of 5G networks.

Companies are investing in innovative test solutions to address challenges such as test cost reduction, yield enhancement, and test time reduction, while also ensuring functional safety and test coverage.

Market Dynamics

Our researchers analyzed the data with 2024 as the base year, along with the key drivers, trends, and challenges. A holistic analysis of drivers will help companies refine their marketing strategies to gain a competitive advantage.

What are the System-On-Chip (SOC) Test Equipment market drivers leading to the rise in the adoption of Industry?

  • The escalating market demand for System-on-Chips (SOCs) is primarily driven by their numerous benefits, including enhanced performance, power efficiency, and integrated functionality.  The market has gained significant traction due to the increasing adoption of SOCs in various electronic applications. SOCs offer advantages such as power savings and miniaturization, making them a preferred choice for consumer electronics like laptops, desktops, tablets, and smartphones. The integration of various components on a single chip enables high-speed data transmission and processing. However, the tight integration also poses challenges in testing and validation. Post-silicon validation is crucial to ensure test coverage and accurate test results analysis. Test data management is another critical aspect, as the volume and complexity of test data increase with the integration of more functionalities on a single chip.
  • Serial and memory interfaces require specialized test equipment to validate their functionality. Functional safety is another concern, especially in safety-critical applications such as automotive electronics, where test standards and test vectors play a vital role. Memory testing is essential to ensure data integrity and reliability. The SOC test equipment market is driven by the increasing demand for electronic products that use SOCs and the need for comprehensive testing to ensure their functionality and reliability. Test equipment providers must focus on developing advanced testing solutions to address the challenges of testing complex SOC designs.

What are the System-On-Chip (SOC) Test Equipment market trends shaping the Industry?

  • The adoption of Field-Programmable Gate Array (FPGA) and embedded testing technologies is an emerging trend in the industry. These advanced technologies enable efficient hardware development and testing, ensuring high product quality and reduced time-to-market. The SOC test equipment market experienced substantial growth in 2024, fueled by the increasing complexity of System-on-Chips (SOCs) and the adoption of advanced testing technologies. SOCs, which integrate processors, memory, I/O interfaces, and specialized accelerators, necessitate advanced, flexible, and high-speed testing solutions. Embedded FPGAs (eFPGAs) have gained popularity due to their ability to integrate programmable logic directly into SOCs, enabling post-production hardware reconfiguration, design flexibility, and accelerated time-to-market. This is particularly beneficial in industries like automotive, industrial automation, and telecommunications, where evolving standards and AI-driven applications necessitate adaptable hardware. Meanwhile, the broader FPGA market is expanding, driven by innovations in real-time processing, edge AI, and low-latency data handling.
  • These capabilities make FPGAs ideal for embedded test systems. In the realm of design verification, test cost reduction, yield enhancement, and test time reduction are critical concerns. This situation could lead to declining consumption of electronic equipment in the US, affecting various sectors, including the demand for cable testers.  Boundary scan, test benches, protocol analysis, and pre-silicon validation are essential techniques used to address these challenges. Furthermore, the emergence of 5G technology and the increasing use of digital-to-analog converters (DACs) in RF testing and electronics manufacturing necessitate specialized testing solutions. Overall, the SOC test equipment market is poised for continued growth as technology advances and industries seek to optimize their testing processes.

How does System-On-Chip (SOC) Test Equipment market faces challenges during its growth?

  • The increasing risk posed by foreign electronic Original Equipment Manufacturers (OEMs) to cyber security is a significant challenge that could hinder industry growth. It is essential for businesses to implement robust cybersecurity measures to mitigate potential threats and safeguard sensitive information from unauthorized access. This issue assumes greater importance in today's interconnected world, where the dependence on technology is at an all-time high. Companies must remain vigilant and collaborate with industry experts to stay informed about emerging threats and best practices for cybersecurity. 
  • The SOC test equipment market experiences significant growth due to the increasing demand for advanced electronic devices and the need for thorough testing to ensure power efficiency, test coverage analysis, and performance. Power analysis is crucial in the design and manufacturing process of System-on-Chips (SOCs) to optimize energy consumption and reduce heat dissipation. Test efficiency is another critical factor driving the market, as manufacturers seek to minimize testing time and costs while maintaining high test coverage. Debug and trace tools are essential for identifying and resolving defects in SOCs, and parallel interface testing and in-circuit testing (ICT) are common methods used for this purpose.

Exclusive Customer Landscape

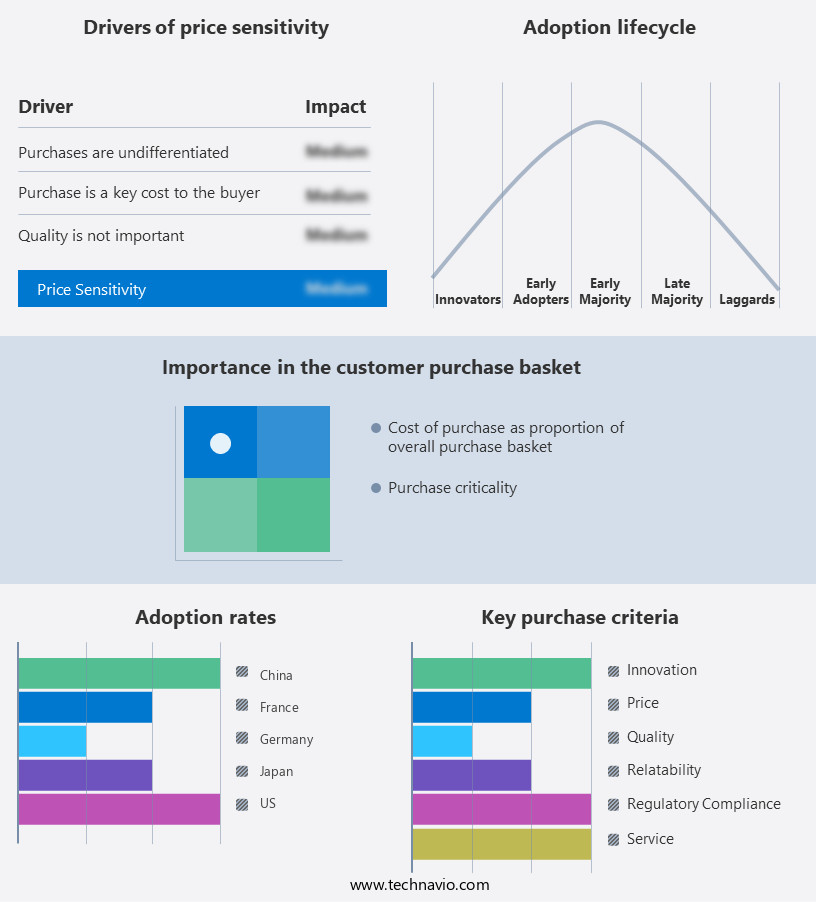
The system-on-chip (SOC) test equipment market forecasting report includes the adoption lifecycle of the market, covering from the innovator's stage to the laggard's stage. It focuses on adoption rates in different regions based on penetration. Furthermore, the system-on-chip (SOC) test equipment market report also includes key purchase criteria and drivers of price sensitivity to help companies evaluate and develop their market growth analysis strategies.

System-On-Chip (SOC) Test Equipment Market Share by Geography

 Customer Landscape

Key Companies & Market Insights

Companies are implementing various strategies, such as strategic alliances, system-on-chip (SOC) test equipment market forecast, partnerships, mergers and acquisitions, geographical expansion, and product/service launches, to enhance their presence in the industry.

Advanced Micro Devices Inc. - The company provides advanced SOC Test Systems, including the Versal Premium VP1902 adaptive SOC, which boasts a 2X capacity increase compared to previous generations.

The industry research and growth report includes detailed analyses of the competitive landscape of the market and information about key companies, including:

  • Advanced Micro Devices Inc.
  • Advantest Corp.
  • Aeris Communications Inc.
  • Arrow Electronics Inc.
  • Astronics Corp.
  • Broadcom Inc.
  • Chroma ATE Inc.
  • Cohu Inc.
  • Intel Corp.
  • Marvin Test Solutions Inc.
  • Microchip Technology Inc.
  • Qualcomm Inc.
  • Samsung Electronics Co. Ltd.
  • STMicroelectronics NV
  • Tektronix Inc.
  • Telefonaktiebolaget LM Ericsson
  • Teradyne Inc.
  • Texas Instruments Inc.

Qualitative and quantitative analysis of companies has been conducted to help clients understand the wider business environment as well as the strengths and weaknesses of key industry players. Data is qualitatively analyzed to categorize companies as pure play, category-focused, industry-focused, and diversified; it is quantitatively analyzed to categorize companies as dominant, leading, strong, tentative, and weak.

Recent Development and News in System-On-Chip (SOC) Test Equipment Market

  • In February 2024, Synopsys, a leading provider of semiconductor design software, announced the launch of its new SOClever FPGA-based prototyping platform for advanced SOC design verification (Synopsys Press Release, 2024). This innovative solution allows designers to test and validate complex SOC designs more efficiently, addressing the increasing complexity of modern chips.
  • In May 2025, Teradyne and Advantest, two major players in the test equipment market, announced a strategic partnership to develop next-generation semiconductor test solutions (Teradyne Press Release, 2025). By combining their expertise and resources, they aim to address the growing demand for advanced test solutions for emerging technologies, such as AI and 5G.
  • In August 2024, Cadence Design Systems, a leading EDA (Electronic Design Automation) company, raised USD 1.5 billion in a secondary offering to fund the expansion of its test and measurement business (Cadence Design Systems SEC Filing, 2024). This significant investment will enable the company to accelerate the development and deployment of advanced test solutions for the rapidly growing SOC market.

Research Analyst Overview

The market continues to evolve, driven by the dynamic needs of various sectors. Design verification and test cost reduction are key priorities, leading to the adoption of advanced test techniques such as boundary scan, test benches, and test time reduction. The integration of 5G technology and digital-to-analog converters (DACs) in SOCs necessitates the development of specialized test solutions. Industrial automation and electronics manufacturing sectors require robust test equipment for RF testing and yield enhancement. Test data management and test coverage analysis are crucial for ensuring functional safety and test efficiency. Pre-silicon validation and power analysis are essential components of the SOC testing process.  This increase in complexity is especially notable in Mixed Signal SOCs. As a result, old SOC test equipment becomes obsolete for cost-effective testing of these advanced SOCs. Consequently, the demand for Automated Test Equipment that can handle complex SOCs cost-effectively is rising among SOC manufacturers.

The ongoing development of high-performance computing (HPC), artificial intelligence (AI), machine learning, and edge computing necessitates the continuous evolution of test equipment to support these technologies. Test automation, test reporting, and test pattern generation are becoming increasingly important. The market for SOC test equipment is characterized by its ability to adapt to the ever-changing landscape of technology and applications. Testing for parallel interfaces, memory interfaces, bus interfaces, and serial interfaces requires specialized test solutions. Protocol analysis and performance testing are also critical components of the SOC testing process. In the automotive electronics sector, functional safety and test standards are paramount.

Testing for functional safety, test coverage, and defect analysis are essential to ensure the reliability and safety of SOCs in this sector. The SOC test equipment market is a vibrant and evolving space, with ongoing innovation and development in test solutions for various applications and sectors. The integration of advanced technologies such as AI, machine learning, and cloud computing is transforming the way SOCs are tested and validated. The market is expected to continue to grow and adapt to the changing needs of the technology landscape.

Dive into Technavio's strong research methodology, blending expert interviews, extensive data synthesis, and validated models for unparalleled System-On-Chip (SOC) Test Equipment Market insights. See full methodology.

Market Scope

Report Coverage

Details

Page number

227

Base year

2024

Historic period

2019-2023

Forecast period

2025-2029

Growth momentum & CAGR

Accelerate at a CAGR of 9.5%

Market growth 2025-2029

USD 2.5 billion

Market structure

Fragmented

YoY growth 2024-2025(%)

9.2

Key countries

China, US, Japan, Germany, France, Canada, India, South Korea, Australia, and Mexico

Competitive landscape

Leading Companies, Market Positioning of Companies, Competitive Strategies, and Industry Risks

Request Free Sample

What are the Key Data Covered in this System-On-Chip (SOC) Test Equipment Market Research and Growth Report?

  • CAGR of the System-On-Chip (SOC) Test Equipment industry during the forecast period
  • Detailed information on factors that will drive the growth and forecasting between 2025 and 2029
  • Precise estimation of the size of the market and its contribution of the industry in focus to the parent market
  • Accurate predictions about upcoming growth and trends and changes in consumer behaviour
  • Growth of the market across APAC, North America, Europe, South America, and Middle East and Africa
  • Thorough analysis of the market's competitive landscape and detailed information about companies
  • Comprehensive analysis of factors that will challenge the system-on-chip (SOC) test equipment market growth of industry companies

We can help! Our analysts can customize this system-on-chip (SOC) test equipment market research report to meet your requirements.

Get in touch

1 Executive Summary

  • 1.1 Market overview
    • Executive Summary - Chart on Market Overview
    • Executive Summary - Data Table on Market Overview
    • Executive Summary - Chart on Global Market Characteristics
    • Executive Summary - Chart on Market by Geography
    • Executive Summary - Chart on Market Segmentation by Application
    • Executive Summary - Chart on Market Segmentation by End-user
    • Executive Summary - Chart on Market Segmentation by Deployment
    • Executive Summary - Chart on Incremental Growth
    • Executive Summary - Data Table on Incremental Growth
    • Executive Summary - Chart on Company Market Positioning

2 Technavio Analysis

  • 2.1 Analysis of price sensitivity, lifecycle, customer purchase basket, adoption rates, and purchase criteria
    • Analysis of price sensitivity, lifecycle, customer purchase basket, adoption rates, and purchase criteria
  • 2.2 Criticality of inputs and Factors of differentiation
    • Overview on criticality of inputs and factors of differentiation
  • 2.3 Factors of disruption
    • Overview on factors of disruption
  • 2.4 Impact of drivers and challenges
    • Impact of drivers and challenges in 2024 and 2029

3 Market Landscape

  • 3.1 Market ecosystem
    • Parent Market
    • Data Table on - Parent Market
  • 3.2 Market characteristics
    • Market characteristics analysis
  • 3.3 Value chain analysis
    • Value chain analysis

4 Market Sizing

  • 4.1 Market definition
    • Offerings of companies included in the market definition
  • 4.2 Market segment analysis
    • Market segments
  • 4.3 Market size 2024
    • 4.4 Market outlook: Forecast for 2024-2029
      • Chart on Global - Market size and forecast 2024-2029 ($ million)
      • Data Table on Global - Market size and forecast 2024-2029 ($ million)
      • Chart on Global Market: Year-over-year growth 2024-2029 (%)
      • Data Table on Global Market: Year-over-year growth 2024-2029 (%)

    5 Historic Market Size

    • 5.1 Global System-On-Chip (SoC) Test Equipment Market 2019 - 2023
      • Historic Market Size - Data Table on Global System-On-Chip (SoC) Test Equipment Market 2019 - 2023 ($ million)
    • 5.2 Application segment analysis 2019 - 2023
      • Historic Market Size - Application Segment 2019 - 2023 ($ million)
    • 5.3 End-user segment analysis 2019 - 2023
      • Historic Market Size - End-user Segment 2019 - 2023 ($ million)
    • 5.4 Deployment segment analysis 2019 - 2023
      • Historic Market Size - Deployment Segment 2019 - 2023 ($ million)
    • 5.5 Geography segment analysis 2019 - 2023
      • Historic Market Size - Geography Segment 2019 - 2023 ($ million)
    • 5.6 Country segment analysis 2019 - 2023
      • Historic Market Size - Country Segment 2019 - 2023 ($ million)

    6 Qualitative Analysis

    • 6.1 The AI impact on Global SoC Test Equipment Market

      7 Five Forces Analysis

      • 7.1 Five forces summary
        • Five forces analysis - Comparison between 2024 and 2029
      • 7.2 Bargaining power of buyers
        • Bargaining power of buyers - Impact of key factors 2024 and 2029
      • 7.3 Bargaining power of suppliers
        • Bargaining power of suppliers - Impact of key factors in 2024 and 2029
      • 7.4 Threat of new entrants
        • Threat of new entrants - Impact of key factors in 2024 and 2029
      • 7.5 Threat of substitutes
        • Threat of substitutes - Impact of key factors in 2024 and 2029
      • 7.6 Threat of rivalry
        • Threat of rivalry - Impact of key factors in 2024 and 2029
      • 7.7 Market condition
        • Chart on Market condition - Five forces 2024 and 2029

      8 Market Segmentation by Application

      • 8.1 Market segments
        • Chart on Application - Market share 2024-2029 (%)
        • Data Table on Application - Market share 2024-2029 (%)
      • 8.2 Comparison by Application
        • Chart on Comparison by Application
        • Data Table on Comparison by Application
      • 8.3 Consumer electronics - Market size and forecast 2024-2029
        • Chart on Consumer electronics - Market size and forecast 2024-2029 ($ million)
        • Data Table on Consumer electronics - Market size and forecast 2024-2029 ($ million)
        • Chart on Consumer electronics - Year-over-year growth 2024-2029 (%)
        • Data Table on Consumer electronics - Year-over-year growth 2024-2029 (%)
      • 8.4 IT and telecommunication - Market size and forecast 2024-2029
        • Chart on IT and telecommunication - Market size and forecast 2024-2029 ($ million)
        • Data Table on IT and telecommunication - Market size and forecast 2024-2029 ($ million)
        • Chart on IT and telecommunication - Year-over-year growth 2024-2029 (%)
        • Data Table on IT and telecommunication - Year-over-year growth 2024-2029 (%)
      • 8.5 Automotive - Market size and forecast 2024-2029
        • Chart on Automotive - Market size and forecast 2024-2029 ($ million)
        • Data Table on Automotive - Market size and forecast 2024-2029 ($ million)
        • Chart on Automotive - Year-over-year growth 2024-2029 (%)
        • Data Table on Automotive - Year-over-year growth 2024-2029 (%)
      • 8.6 Others - Market size and forecast 2024-2029
        • Chart on Others - Market size and forecast 2024-2029 ($ million)
        • Data Table on Others - Market size and forecast 2024-2029 ($ million)
        • Chart on Others - Year-over-year growth 2024-2029 (%)
        • Data Table on Others - Year-over-year growth 2024-2029 (%)
      • 8.7 Market opportunity by Application
        • Market opportunity by Application ($ million)
        • Data Table on Market opportunity by Application ($ million)

      9 Market Segmentation by End-user

      • 9.1 Market segments
        • Chart on End-user - Market share 2024-2029 (%)
        • Data Table on End-user - Market share 2024-2029 (%)
      • 9.2 Comparison by End-user
        • Chart on Comparison by End-user
        • Data Table on Comparison by End-user
      • 9.3 Integrated device manufacturer - Market size and forecast 2024-2029
        • Chart on Integrated device manufacturer - Market size and forecast 2024-2029 ($ million)
        • Data Table on Integrated device manufacturer - Market size and forecast 2024-2029 ($ million)
        • Chart on Integrated device manufacturer - Year-over-year growth 2024-2029 (%)
        • Data Table on Integrated device manufacturer - Year-over-year growth 2024-2029 (%)
      • 9.4 Foundry - Market size and forecast 2024-2029
        • Chart on Foundry - Market size and forecast 2024-2029 ($ million)
        • Data Table on Foundry - Market size and forecast 2024-2029 ($ million)
        • Chart on Foundry - Year-over-year growth 2024-2029 (%)
        • Data Table on Foundry - Year-over-year growth 2024-2029 (%)
      • 9.5 Design house - Market size and forecast 2024-2029
        • Chart on Design house - Market size and forecast 2024-2029 ($ million)
        • Data Table on Design house - Market size and forecast 2024-2029 ($ million)
        • Chart on Design house - Year-over-year growth 2024-2029 (%)
        • Data Table on Design house - Year-over-year growth 2024-2029 (%)
      • 9.6 Market opportunity by End-user
        • Market opportunity by End-user ($ million)
        • Data Table on Market opportunity by End-user ($ million)

      10 Market Segmentation by Deployment

      • 10.1 Market segments
        • Chart on Deployment - Market share 2024-2029 (%)
        • Data Table on Deployment - Market share 2024-2029 (%)
      • 10.2 Comparison by Deployment
        • Chart on Comparison by Deployment
        • Data Table on Comparison by Deployment
      • 10.3 On-premises - Market size and forecast 2024-2029
        • Chart on On-premises - Market size and forecast 2024-2029 ($ million)
        • Data Table on On-premises - Market size and forecast 2024-2029 ($ million)
        • Chart on On-premises - Year-over-year growth 2024-2029 (%)
        • Data Table on On-premises - Year-over-year growth 2024-2029 (%)
      • 10.4 Cloud-based - Market size and forecast 2024-2029
        • Chart on Cloud-based - Market size and forecast 2024-2029 ($ million)
        • Data Table on Cloud-based - Market size and forecast 2024-2029 ($ million)
        • Chart on Cloud-based - Year-over-year growth 2024-2029 (%)
        • Data Table on Cloud-based - Year-over-year growth 2024-2029 (%)
      • 10.5 Hybrid - Market size and forecast 2024-2029
        • Chart on Hybrid - Market size and forecast 2024-2029 ($ million)
        • Data Table on Hybrid - Market size and forecast 2024-2029 ($ million)
        • Chart on Hybrid - Year-over-year growth 2024-2029 (%)
        • Data Table on Hybrid - Year-over-year growth 2024-2029 (%)
      • 10.6 Market opportunity by Deployment
        • Market opportunity by Deployment ($ million)
        • Data Table on Market opportunity by Deployment ($ million)

      11 Customer Landscape

      • 11.1 Customer landscape overview
        • Analysis of price sensitivity, lifecycle, customer purchase basket, adoption rates, and purchase criteria

      12 Geographic Landscape

      • 12.1 Geographic segmentation
        • Chart on Market share by geography 2024-2029 (%)
        • Data Table on Market share by geography 2024-2029 (%)
      • 12.2 Geographic comparison
        • Chart on Geographic comparison
        • Data Table on Geographic comparison
      • 12.3 APAC - Market size and forecast 2024-2029
        • Chart on APAC - Market size and forecast 2024-2029 ($ million)
        • Data Table on APAC - Market size and forecast 2024-2029 ($ million)
        • Chart on APAC - Year-over-year growth 2024-2029 (%)
        • Data Table on APAC - Year-over-year growth 2024-2029 (%)
      • 12.4 North America - Market size and forecast 2024-2029
        • Chart on North America - Market size and forecast 2024-2029 ($ million)
        • Data Table on North America - Market size and forecast 2024-2029 ($ million)
        • Chart on North America - Year-over-year growth 2024-2029 (%)
        • Data Table on North America - Year-over-year growth 2024-2029 (%)
      • 12.5 Europe - Market size and forecast 2024-2029
        • Chart on Europe - Market size and forecast 2024-2029 ($ million)
        • Data Table on Europe - Market size and forecast 2024-2029 ($ million)
        • Chart on Europe - Year-over-year growth 2024-2029 (%)
        • Data Table on Europe - Year-over-year growth 2024-2029 (%)
      • 12.6 South America - Market size and forecast 2024-2029
        • Chart on South America - Market size and forecast 2024-2029 ($ million)
        • Data Table on South America - Market size and forecast 2024-2029 ($ million)
        • Chart on South America - Year-over-year growth 2024-2029 (%)
        • Data Table on South America - Year-over-year growth 2024-2029 (%)
      • 12.7 Middle East and Africa - Market size and forecast 2024-2029
        • Chart on Middle East and Africa - Market size and forecast 2024-2029 ($ million)
        • Data Table on Middle East and Africa - Market size and forecast 2024-2029 ($ million)
        • Chart on Middle East and Africa - Year-over-year growth 2024-2029 (%)
        • Data Table on Middle East and Africa - Year-over-year growth 2024-2029 (%)
      • 12.8 China - Market size and forecast 2024-2029
        • Chart on China - Market size and forecast 2024-2029 ($ million)
        • Data Table on China - Market size and forecast 2024-2029 ($ million)
        • Chart on China - Year-over-year growth 2024-2029 (%)
        • Data Table on China - Year-over-year growth 2024-2029 (%)
      • 12.9 US - Market size and forecast 2024-2029
        • Chart on US - Market size and forecast 2024-2029 ($ million)
        • Data Table on US - Market size and forecast 2024-2029 ($ million)
        • Chart on US - Year-over-year growth 2024-2029 (%)
        • Data Table on US - Year-over-year growth 2024-2029 (%)
      • 12.10 Japan - Market size and forecast 2024-2029
        • Chart on Japan - Market size and forecast 2024-2029 ($ million)
        • Data Table on Japan - Market size and forecast 2024-2029 ($ million)
        • Chart on Japan - Year-over-year growth 2024-2029 (%)
        • Data Table on Japan - Year-over-year growth 2024-2029 (%)
      • 12.11 Germany - Market size and forecast 2024-2029
        • Chart on Germany - Market size and forecast 2024-2029 ($ million)
        • Data Table on Germany - Market size and forecast 2024-2029 ($ million)
        • Chart on Germany - Year-over-year growth 2024-2029 (%)
        • Data Table on Germany - Year-over-year growth 2024-2029 (%)
      • 12.12 France - Market size and forecast 2024-2029
        • Chart on France - Market size and forecast 2024-2029 ($ million)
        • Data Table on France - Market size and forecast 2024-2029 ($ million)
        • Chart on France - Year-over-year growth 2024-2029 (%)
        • Data Table on France - Year-over-year growth 2024-2029 (%)
      • 12.13 Canada - Market size and forecast 2024-2029
        • Chart on Canada - Market size and forecast 2024-2029 ($ million)
        • Data Table on Canada - Market size and forecast 2024-2029 ($ million)
        • Chart on Canada - Year-over-year growth 2024-2029 (%)
        • Data Table on Canada - Year-over-year growth 2024-2029 (%)
      • 12.14 India - Market size and forecast 2024-2029
        • Chart on India - Market size and forecast 2024-2029 ($ million)
        • Data Table on India - Market size and forecast 2024-2029 ($ million)
        • Chart on India - Year-over-year growth 2024-2029 (%)
        • Data Table on India - Year-over-year growth 2024-2029 (%)
      • 12.15 South Korea - Market size and forecast 2024-2029
        • Chart on South Korea - Market size and forecast 2024-2029 ($ million)
        • Data Table on South Korea - Market size and forecast 2024-2029 ($ million)
        • Chart on South Korea - Year-over-year growth 2024-2029 (%)
        • Data Table on South Korea - Year-over-year growth 2024-2029 (%)
      • 12.16 Australia - Market size and forecast 2024-2029
        • Chart on Australia - Market size and forecast 2024-2029 ($ million)
        • Data Table on Australia - Market size and forecast 2024-2029 ($ million)
        • Chart on Australia - Year-over-year growth 2024-2029 (%)
        • Data Table on Australia - Year-over-year growth 2024-2029 (%)
      • 12.17 Mexico - Market size and forecast 2024-2029
        • Chart on Mexico - Market size and forecast 2024-2029 ($ million)
        • Data Table on Mexico - Market size and forecast 2024-2029 ($ million)
        • Chart on Mexico - Year-over-year growth 2024-2029 (%)
        • Data Table on Mexico - Year-over-year growth 2024-2029 (%)
      • 12.18 Market opportunity by geography
        • Market opportunity by geography ($ million)
        • Data Tables on Market opportunity by geography ($ million)

      13 Drivers, Challenges, and Opportunity/Restraints

      • 13.1 Market drivers
        • 13.2 Market challenges
          • 13.3 Impact of drivers and challenges
            • Impact of drivers and challenges in 2024 and 2029
          • 13.4 Market opportunities/restraints

            14 Competitive Landscape

            • 14.1 Overview
              • 14.2 Competitive Landscape
                • Overview on criticality of inputs and factors of differentiation
              • 14.3 Landscape disruption
                • Overview on factors of disruption
              • 14.4 Industry risks
                • Impact of key risks on business

              15 Competitive Analysis

              • 15.1 Companies profiled
                • Companies covered
              • 15.2 Company ranking index
                • Company ranking index
              • 15.3 Market positioning of companies
                • Matrix on companies position and classification
              • 15.4 Advanced Micro Devices Inc.
                • Advanced Micro Devices Inc. - Overview
                • Advanced Micro Devices Inc. - Business segments
                • Advanced Micro Devices Inc. - Key news
                • Advanced Micro Devices Inc. - Key offerings
                • Advanced Micro Devices Inc. - Segment focus
                • SWOT
              • 15.5 Advantest Corp.
                • Advantest Corp. - Overview
                • Advantest Corp. - Business segments
                • Advantest Corp. - Key news
                • Advantest Corp. - Key offerings
                • Advantest Corp. - Segment focus
                • SWOT
              • 15.6 Arrow Electronics Inc.
                • Arrow Electronics Inc. - Overview
                • Arrow Electronics Inc. - Business segments
                • Arrow Electronics Inc. - Key news
                • Arrow Electronics Inc. - Key offerings
                • Arrow Electronics Inc. - Segment focus
                • SWOT
              • 15.7 Astronics Corp.
                • Astronics Corp. - Overview
                • Astronics Corp. - Business segments
                • Astronics Corp. - Key news
                • Astronics Corp. - Key offerings
                • Astronics Corp. - Segment focus
                • SWOT
              • 15.8 Broadcom Inc.
                • Broadcom Inc. - Overview
                • Broadcom Inc. - Business segments
                • Broadcom Inc. - Key news
                • Broadcom Inc. - Key offerings
                • Broadcom Inc. - Segment focus
                • SWOT
              • 15.9 Chroma ATE Inc.
                • Chroma ATE Inc. - Overview
                • Chroma ATE Inc. - Business segments
                • Chroma ATE Inc. - Key offerings
                • Chroma ATE Inc. - Segment focus
                • SWOT
              • 15.10 Cohu Inc.
                • Cohu Inc. - Overview
                • Cohu Inc. - Product / Service
                • Cohu Inc. - Key news
                • Cohu Inc. - Key offerings
                • SWOT
              • 15.11 Intel Corp.
                • Intel Corp. - Overview
                • Intel Corp. - Business segments
                • Intel Corp. - Key news
                • Intel Corp. - Key offerings
                • Intel Corp. - Segment focus
                • SWOT
              • 15.12 Marvin Test Solutions Inc.
                • Marvin Test Solutions Inc. - Overview
                • Marvin Test Solutions Inc. - Product / Service
                • Marvin Test Solutions Inc. - Key offerings
                • SWOT
              • 15.13 Microchip Technology Inc.
                • Microchip Technology Inc. - Overview
                • Microchip Technology Inc. - Business segments
                • Microchip Technology Inc. - Key news
                • Microchip Technology Inc. - Key offerings
                • Microchip Technology Inc. - Segment focus
                • SWOT
              • 15.14 Qualcomm Inc.
                • Qualcomm Inc. - Overview
                • Qualcomm Inc. - Business segments
                • Qualcomm Inc. - Key news
                • Qualcomm Inc. - Key offerings
                • Qualcomm Inc. - Segment focus
                • SWOT
              • 15.15 Samsung Electronics Co. Ltd.
                • Samsung Electronics Co. Ltd. - Overview
                • Samsung Electronics Co. Ltd. - Business segments
                • Samsung Electronics Co. Ltd. - Key news
                • Samsung Electronics Co. Ltd. - Key offerings
                • Samsung Electronics Co. Ltd. - Segment focus
                • SWOT
              • 15.16 STMicroelectronics NV
                • STMicroelectronics NV - Overview
                • STMicroelectronics NV - Business segments
                • STMicroelectronics NV - Key news
                • STMicroelectronics NV - Key offerings
                • STMicroelectronics NV - Segment focus
                • SWOT
              • 15.17 Teradyne Inc.
                • Teradyne Inc. - Overview
                • Teradyne Inc. - Business segments
                • Teradyne Inc. - Key news
                • Teradyne Inc. - Key offerings
                • Teradyne Inc. - Segment focus
                • SWOT
              • 15.18 Texas Instruments Inc.
                • Texas Instruments Inc. - Overview
                • Texas Instruments Inc. - Business segments
                • Texas Instruments Inc. - Key offerings
                • Texas Instruments Inc. - Segment focus
                • SWOT

              16 Appendix

              • 16.1 Scope of the report
                • 16.2 Inclusions and exclusions checklist
                  • Inclusions checklist
                  • Exclusions checklist
                • 16.3 Currency conversion rates for US$
                  • Currency conversion rates for US$
                • 16.4 Research methodology
                  • Research methodology
                • 16.5 Data procurement
                  • Information sources
                • 16.6 Data validation
                  • Data validation
                • 16.7 Validation techniques employed for market sizing
                  • Validation techniques employed for market sizing
                • 16.8 Data synthesis
                  • Data synthesis
                • 16.9 360 degree market analysis
                  • 360 degree market analysis
                • 16.10 List of abbreviations
                  • List of abbreviations

                Research Methodology

                Technavio presents a detailed picture of the market by way of study, synthesis, and summation of data from multiple sources. The analysts have presented the various facets of the market with a particular focus on identifying the key industry influencers. The data thus presented is comprehensive, reliable, and the result of extensive research, both primary and secondary.

                INFORMATION SOURCES

                Primary sources

                • Manufacturers and suppliers
                • Channel partners
                • Industry experts
                • Strategic decision makers

                Secondary sources

                • Industry journals and periodicals
                • Government data
                • Financial reports of key industry players
                • Historical data
                • Press releases

                DATA ANALYSIS

                Data Synthesis

                • Collation of data
                • Estimation of key figures
                • Analysis of derived insights

                Data Validation

                • Triangulation with data models
                • Reference against proprietary databases
                • Corroboration with industry experts

                REPORT WRITING

                Qualitative

                • Market drivers
                • Market challenges
                • Market trends
                • Five forces analysis

                Quantitative

                • Market size and forecast
                • Market segmentation
                • Geographical insights
                • Competitive landscape

                Interested in this report?

                Get your sample now to see our research methodology and insights!

                Download Now

                Frequently Asked Questions

                System-On-Chip (Soc) Test Equipment market growth will increase by $ 2496.3 mn during 2025-2029 .

                The System-On-Chip (Soc) Test Equipment market is expected to grow at a CAGR of 9.5% during 2025-2029 .

                System-On-Chip (Soc) Test Equipment market is segmented by Application( Consumer electronics, IT and telecommunication, Automotive, Others) End-user( Integrated device manufacturer, Foundry, Design house, South America, Middle East and Africa) Deployment( On-premises, Cloud-based, Hybrid, South America, Middle East and Africa)

                Advanced Micro Devices Inc., Advantest Corp., Aeris Communications Inc., Arrow Electronics Inc., Astronics Corp., Broadcom Inc., Chroma ATE Inc., Cohu Inc., Intel Corp., Marvin Test Solutions Inc., Microchip Technology Inc., Qualcomm Inc., Samsung Electronics Co. Ltd., STMicroelectronics NV, Tektronix Inc., Telefonaktiebolaget LM Ericsson, Teradyne Inc., Texas Instruments Inc. are a few of the key vendors in the System-On-Chip (Soc) Test Equipment market.

                APAC will register the highest growth rate of 71% among the other regions. Therefore, the System-On-Chip (Soc) Test Equipment market in APAC is expected to garner significant business opportunities for the vendors during the forecast period.

                China, US, Japan, Germany, France, Canada, India, South Korea, Australia, Mexico

                • Increasing demand for SoCs due to their benefitsSoCs offer many benefits over traditional multi-chip systems. A few of these benefits include much less power consumption and miniaturization of an electronic system. Thus is the driving factor this market.
                • several electronic products is the driving factor this market.
                • including laptops and desktops is the driving factor this market.
                • have been using SoCs for more than two decades. However is the driving factor this market.
                • ever since the demand for mobile computing has emerged is the driving factor this market.
                • sales of tablet PCs and smartphones have grown exponentially. The use of SoCs in tablet PCs and smartphones also enables high-speed data transmission and data processing is the driving factor this market.
                • as every electronic component is on a single substrate.The very tight integration of components on a single chip also makes it impossible to replace a faulty component. This necessitates comprehensive testing of an electronic device before it is dispatched. The increasing demand for SoCs has been driving the growth of the global SoC test equipment market. Most electronic devices such as smartphones is the driving factor this market.
                • cellphones is the driving factor this market.
                • tablets is the driving factor this market.
                • STBs is the driving factor this market.
                • high-definition televisions (HDTVs) is the driving factor this market.
                • game controllers is the driving factor this market.
                • automotive controllers is the driving factor this market.
                • and computer graphics use SoCs. Thus is the driving factor this market.
                • increasing demand for SoC is driving investments in SoC manufacturing. This contributes to the growth of the global SoC test equipment market during the forecast period. is the driving factor this market.

                The System-On-Chip (Soc) Test Equipment market vendors should focus on grabbing business opportunities from the Consumer electronics segment as it accounted for the largest market share in the base year.