Automated Test Equipment (ATE) Market Analysis APAC, North America, Europe, South America, Middle East and Africa - US, China, Japan, Germany, South Korea, UK, France, Canada, Italy, Australia - Size and Forecast 2025-2029

Automated Test Equipment (ATE) Market Analysis APAC, North America, Europe, South America, Middle East and Africa - US, China, Japan, Germany, South Korea, UK, France, Canada, Italy, Australia - Size and Forecast 2025-2029

Published: Mar 2025 207 Pages SKU: IRTNTR43865

Market Overview at a Glance

$2.59 B
Market Opportunity
5.7%
CAGR
4.9
YoY growth 2024-2025(%)

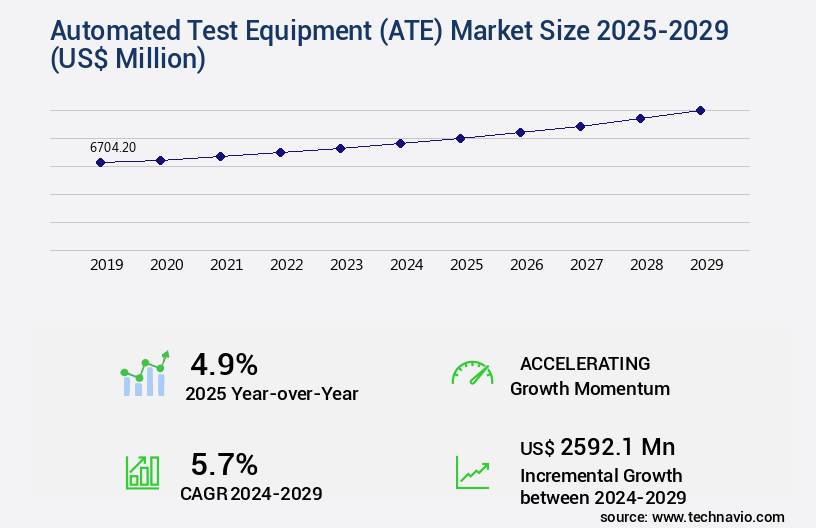
Automated Test Equipment (ATE) Market Size 2025-2029

The automated test equipment (ate) market size is valued to increase USD 2.59 billion, at a CAGR of 5.7% from 2024 to 2029. Augmented production of electronic goods will drive the automated test equipment (ate) market.

Major Market Trends & Insights

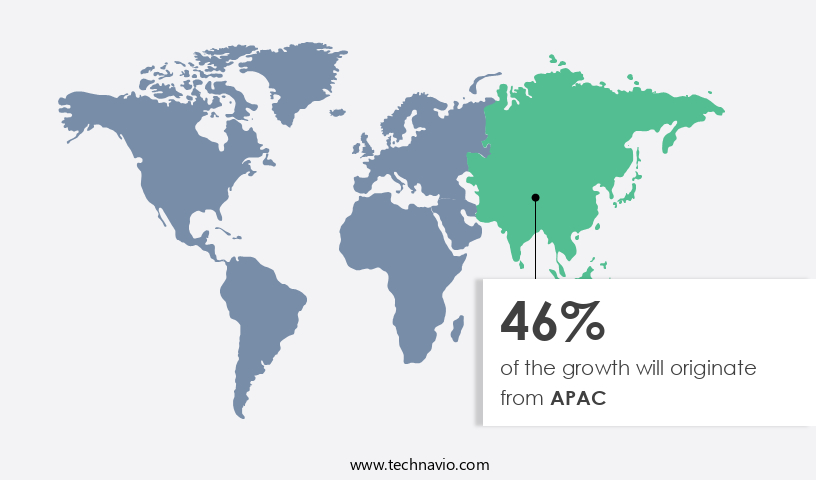
  • APAC dominated the market and accounted for a 46% growth during the forecast period.
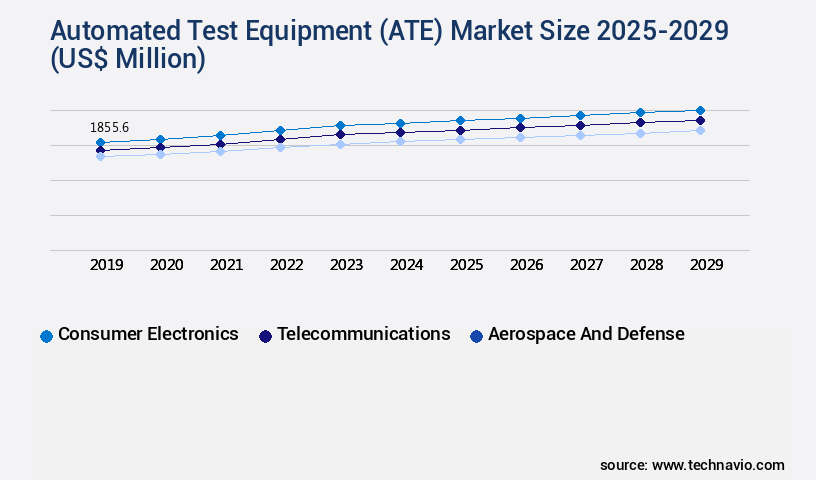
  • By End-user - Consumer electronics segment was valued at USD 1.86 billion in 2023
  • By Product - Non-memory ATE segment accounted for the largest market revenue share in 2023

Market Size & Forecast

  • Market Opportunities: USD 59.42 million
  • Market Future Opportunities: USD 2592.10 million
  • CAGR from 2024 to 2029 : 5.7%

Market Summary

  • The market plays a pivotal role in the production process of electronics, particularly in industries such as telecommunications and automotive, where wireless technologies are increasingly prevalent. According to recent market research, the global ATE market is projected to reach a value of USD23.5 billion by 2026, driven by the growing demand for advanced testing solutions to ensure the quality and reliability of complex electronic systems. ATE systems are essential for manufacturing high-volume, high-mix electronic products, as they enable rapid and accurate testing, reducing the risk of defects and improving overall production efficiency. However, the high cost of these systems remains a significant challenge for many businesses, necessitating the development of cost-effective solutions and the integration of advanced technologies such as artificial intelligence and machine learning to optimize testing processes.
  • Moreover, the trend towards miniaturization and the increasing complexity of electronic components require ATE systems to be adaptable and versatile, capable of testing a wide range of products and configurations. As such, the market is witnessing significant innovation, with companies focusing on developing modular and configurable solutions that can be easily integrated into production lines. In conclusion, the ATE market is experiencing steady growth, driven by the increasing demand for advanced testing solutions in a rapidly evolving electronic landscape. Despite the challenges posed by high costs and the need for flexibility, the market is expected to continue its expansion, offering significant opportunities for businesses seeking to improve their production processes and ensure the quality of their electronic products.

What will be the Size of the Automated Test Equipment (ATE) Market during the forecast period?

Automated Test Equipment (ATE) Market Size

Get Key Insights on Market Forecast (PDF) Request Free Sample

How is the Automated Test Equipment (ATE) Market Segmented ?

The automated test equipment (ate) industry research report provides comprehensive data (region-wise segment analysis), with forecasts and estimates in "USD million" for the period 2025-2029, as well as historical data from 2019-2023 for the following segments.

  • End-user
    • Consumer electronics
    • Telecommunications
    • Aerospace and defense
    • Others
  • Product
    • Non-memory ATE
    • Memory
    • Discrete
  • Geography
    • North America
      • US
      • Canada
    • Europe
      • France
      • Germany
      • Italy
      • UK
    • APAC
      • Australia
      • China
      • Japan
      • South Korea
    • Rest of World (ROW)

    By End-user Insights

    The consumer electronics segment is estimated to witness significant growth during the forecast period.

    The market is experiencing significant growth, particularly in the consumer electronics sector, driven by the increasing global population of high-net-worth individuals (HNWI). According to the Capgemini Research Institutes World Wealth Report 2024, the HNWI population grew by 5.1% in 2023, reaching 22.8 million, with a combined wealth of USD86.8 trillion. This economic trend signifies the growing capability of individuals to purchase various consumer electronics, such as mobile devices like smartphones and tablets. These devices predominantly use mixed-signal integrated circuits (ICs) due to their cost-effectiveness, low power consumption, and superior performance. Consequently, the consumer electronics segment of the global ATE market is witnessing a rising year-over-year growth rate.

    This trend is primarily due to the high demand for mobile devices, which offer mobility and multi-functionality advantages, necessitating rigorous testing using advanced techniques such as system level testing, boundary scan testing, dc parametric testing, software-defined testing, and high-speed digital testing. Additionally, other testing methods like thermal testing, environmental testing, power integrity testing, and reliability testing are crucial to ensure the functionality and longevity of these devices. Overall, the ATE market is continuously evolving to meet the demands of various industries, including automotive, telecommunications, military, and aerospace, through the development of innovative testing solutions for functional testing, defect classification, test time reduction, test data management, test equipment calibration, and test handler interface, among others.

    Automated Test Equipment (ATE) Market Size

    Request Free Sample

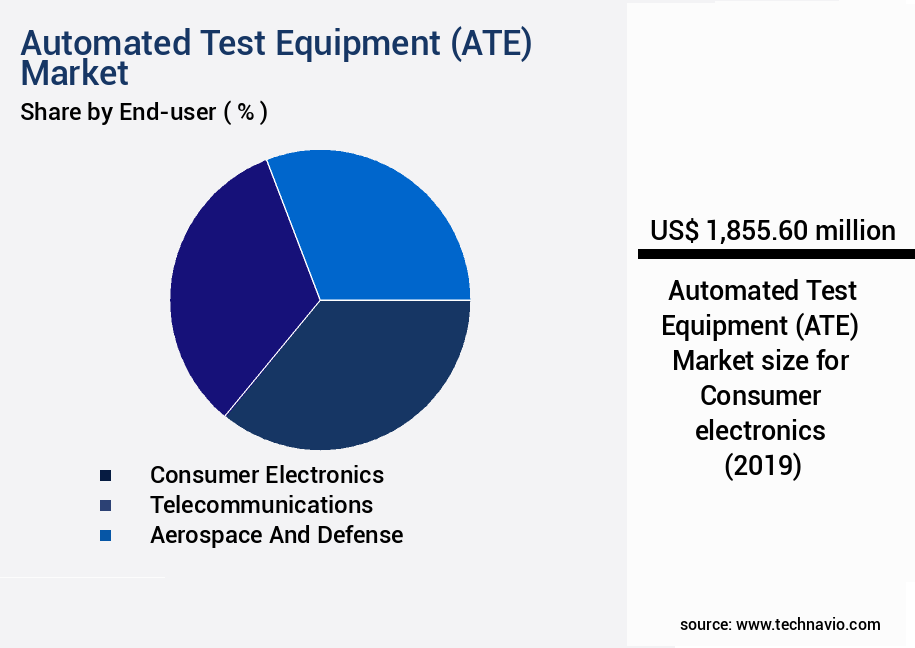
    The Consumer electronics segment was valued at USD 1.86 billion in 2019 and showed a gradual increase during the forecast period.

    Automated Test Equipment (ATE) Market Size

    Request Free Sample

    Regional Analysis

    APAC is estimated to contribute 46% to the growth of the global market during the forecast period.Technavio’s analysts have elaborately explained the regional trends and drivers that shape the market during the forecast period.

    Automated Test Equipment (ATE) Market Share by Geography

    See How Automated Test Equipment (ATE) Market Demand is Rising in APAC Request Free Sample

    In the dynamic landscape of the market, Asia Pacific (APAC) holds a significant position due to its status as the manufacturing hub for numerous durable consumer products, electronics, and IT devices. Major players in this region, including China, Japan, and South Korea, offer competitive pricing, making them key contributors to the market's growth. The region's electronics sector is home to some of the world's largest companies and foundries, driving demand for ATE. Asia's consumer electronics market is experiencing a surge due to technological advancements, price deflations, and increasing per capita incomes.

    For example, India's GDP per capita was reported to be USD2,480 in 2024. This economic growth, coupled with the region's robust manufacturing sector, ensures a continuous demand for ATE in APAC.

    Market Dynamics

    Our researchers analyzed the data with 2024 as the base year, along with the key drivers, trends, and challenges. A holistic analysis of drivers will help companies refine their marketing strategies to gain a competitive advantage.

    The market encompasses a range of advanced solutions designed to streamline and optimize the testing process for electronic devices and systems. High-speed digital test system integration plays a crucial role in accommodating the increasing complexity of modern semiconductors, enabling efficient test program development methodology. Mixed-signal test challenges are addressed through innovative solutions, ensuring accurate RF microwave test equipment calibration procedures and effective failure analysis techniques for semiconductor devices. Improving ATE throughput is a significant focus, achieved through efficient test program design and the implementation of advanced signal integrity testing methods. Test data management for large-scale production testing is essential for maintaining quality and reducing test time. Effective strategies for reducing test time in ATE include implementing robust statistical process control and designing efficient and reliable test fixtures. Utilizing advanced probe card technology for high-density testing and implementing boundary-scan testing for improved fault detection are critical components of modern ATE systems. Advanced techniques for defect classification in semiconductor manufacturing ensure accurate identification and resolution of issues. Hardware-in-the-loop testing of complex electronic systems and software-defined testing capabilities provide increased flexibility and precision. Comprehensive reliability testing of electronic systems is essential to ensure product quality and customer satisfaction. Component-level testing for enhanced yield and system-level testing for complex integrated systems are integral parts of the ATE market. By staying at the forefront of technology and innovation, ATE market participants continue to meet the evolving demands of the electronics industry.

    Automated Test Equipment (ATE) Market Size

    What are the key market drivers leading to the rise in the adoption of Automated Test Equipment (ATE) Industry?

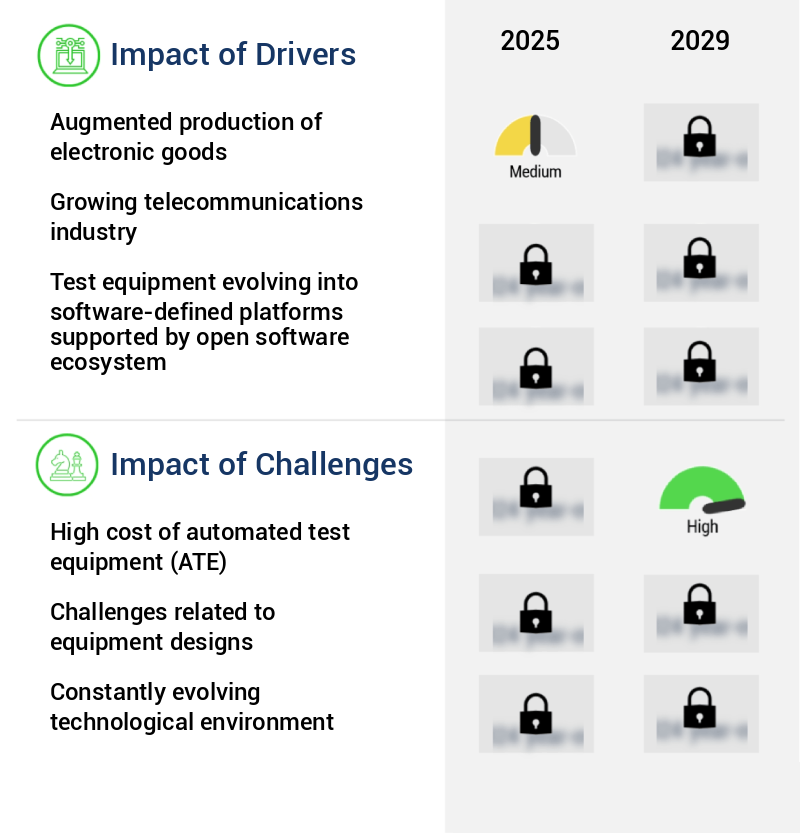
    • The augmented production of electronic goods serves as the primary catalyst for market growth. 

    • The electronics industry is experiencing significant expansion during the forecast period, with notable increases in electronic goods exports from China, Japan, and Singapore. The majority of these exports consist of moderately priced and low-cost equipment, primarily driven by the robust growth in the semiconductor and electronics industry within the Asia Pacific (APAC) region. Despite a plateau in smartphone sales, the shipment volume continues to rise, fueling the demand for test and measurement equipment.
    • This trend is primarily observed in APAC, where market fragmentation and lower average selling prices in North America, Western Europe, and China are influencing growth dynamics. The electronics industry's continuous evolution and its applications across various sectors underscore its importance and potential for future innovation.

    What are the market trends shaping the Automated Test Equipment (ATE) Industry?

    • Automotive wireless technologies are becoming the market trend. This emerging technology sector is poised for significant growth.

    • The automotive sector is experiencing a significant shift from manufacturing conventional vehicles to cars integrated with advanced electronic devices, catering to both performance enhancement and entertainment needs. Future vehicles are anticipated to incorporate numerous devices, facilitated by wireless technologies like Wi-Fi and Bluetooth. Europe has been at the forefront of this transformation, with several manufacturers integrating cellular technologies that automatically alert emergency centers following serious accidents. This integration of technology in the automotive industry is a continuous process, with new innovations and applications emerging regularly.
    • For instance, electric and autonomous vehicles are gaining popularity, while connected cars are becoming increasingly common. The sector's evolution is driven by consumer preferences for enhanced safety, comfort, and convenience features. The European automotive market is expected to remain at the forefront of these advancements, as manufacturers strive to meet the evolving needs and expectations of their customers.

    What challenges does the Automated Test Equipment (ATE) Industry face during its growth?

    • The escalating cost of Automated Test Equipment (ATE) poses a significant challenge to the industry's growth trajectory. This issue, which is of great concern to professionals in the field, necessitates continuous exploration for cost-effective solutions to mitigate its impact. 

    • In the dynamic and evolving ATE market, competition is intense as manufacturers continually invest in research and development, driven by technological innovations. However, rising raw material costs and increasing import duties have significantly impacted production expenses, escalating the overall cost of test equipment. This cost pressure is particularly felt by price-sensitive end-users. For instance, digital ultrasonic flaw detectors from local Chinese companies are offered at a USD1,000 lower price point than those from leading suppliers. Despite these challenges, the market remains robust, with numerous applications across various sectors, including automotive, electronics, and semiconductor industries.
    • The ATE landscape is characterized by ongoing advancements, with a focus on miniaturization, automation, and integration of advanced technologies like AI and IoT. This data-driven narrative underscores the continuous evolution of the ATE market and its diverse applications.

    Exclusive Technavio Analysis on Customer Landscape

    The automated test equipment (ate) market forecasting report includes the adoption lifecycle of the market, covering from the innovator’s stage to the laggard’s stage. It focuses on adoption rates in different regions based on penetration. Furthermore, the automated test equipment (ate) market report also includes key purchase criteria and drivers of price sensitivity to help companies evaluate and develop their market growth analysis strategies.

    Automated Test Equipment (ATE) Market Share by Geography

     Customer Landscape of Automated Test Equipment (ATE) Industry

    Competitive Landscape

    Companies are implementing various strategies, such as strategic alliances, automated test equipment (ate) market forecast, partnerships, mergers and acquisitions, geographical expansion, and product/service launches, to enhance their presence in the industry.

    Advantest Corp. - The company specializes in providing automated test equipment solutions, including the V93000, T2000, and T6391 models, enhancing efficiency and accuracy in various industries. These advanced tools streamline testing processes and ensure consistent product quality.

    The industry research and growth report includes detailed analyses of the competitive landscape of the market and information about key companies, including:

    • Advantest Corp.
    • ADVINT LLC
    • Aemulus Holdings Bhd
    • Aimil Ltd.
    • Anritsu Corp.
    • Astronics Corp.
    • Averna Technologies Inc.
    • BAE Systems Plc
    • Chroma ATE Inc.
    • Cobham Ltd.
    • Cohu Inc.
    • INNOTECH Corp.
    • Keysight Technologies Inc.
    • National Instruments Corp.
    • Rohde and Schwarz GmbH and Co. KG
    • ROOS INSTRUMENTS Inc.
    • SPEA Spa
    • Teradyne Inc.
    • TESEC Inc.
    • The Marvin Group

    Qualitative and quantitative analysis of companies has been conducted to help clients understand the wider business environment as well as the strengths and weaknesses of key industry players. Data is qualitatively analyzed to categorize companies as pure play, category-focused, industry-focused, and diversified; it is quantitatively analyzed to categorize companies as dominant, leading, strong, tentative, and weak.

    Recent Development and News in Automated Test Equipment (ATE) Market

    • In January 2024, Teradyne Inc., a leading provider of Automated Test Equipment (ATE), announced the launch of their new J750 Automated Test System, which supports advanced packaging technologies and high-speed serial interfaces (Teradyne Press Release). This expansion into advanced packaging and high-speed interfaces underscores Teradyne's commitment to addressing the evolving needs of the semiconductor industry.
    • In March 2024, Advantest Corporation and National Instruments entered into a strategic partnership to integrate Advantest's ATE solutions with National Instruments' software platforms, enabling seamless data exchange and analysis between the two systems (National Instruments Press Release). This collaboration aims to streamline the testing process for customers in the automotive, industrial, and communications markets.
    • In May 2024, TE Connectivity, a global industrial technology leader, acquired ATE specialist, Asset Intertech, to expand its test and measurement solutions portfolio. The acquisition strengthened TE Connectivity's position in the ATE market and provided it with Asset Intertech's advanced test solutions for high-reliability applications (TE Connectivity Press Release).
    • In April 2025, the European Union introduced the European Chip Act, a €43 billion investment initiative to boost Europe's semiconductor manufacturing capabilities and reduce reliance on imports. The Act includes funding for research, development, and production of advanced semiconductors, as well as initiatives to boost the European ATE market (European Commission Press Release). This policy change is expected to drive significant growth in the European ATE market over the coming years.

    Dive into Technavio’s robust research methodology, blending expert interviews, extensive data synthesis, and validated models for unparalleled Automated Test Equipment (ATE) Market insights. See full methodology.

    Market Scope

    Report Coverage

    Details

    Page number

    207

    Base year

    2024

    Historic period

    2019-2023

    Forecast period

    2025-2029

    Growth momentum & CAGR

    Accelerate at a CAGR of 5.7%

    Market growth 2025-2029

    USD 2592.1 million

    Market structure

    Fragmented

    YoY growth 2024-2025(%)

    4.9

    Key countries

    US, China, Japan, Germany, South Korea, UK, France, Canada, Italy, and Australia

    Competitive landscape

    Leading Companies, Market Positioning of Companies, Competitive Strategies, and Industry Risks

    Request Free Sample

    Research Analyst Overview

    • The market continues to evolve, driven by the ever-increasing complexity of electronic devices and systems. This dynamic market encompasses various testing techniques, including system level testing, thermal testing, boundary scan testing, DC parametric testing, mixed-signal test, defect classification, AC parametric testing, software-defined testing, high-speed digital testing, functional testing, environmental testing, software test automation, RF microwave testing, power integrity testing, production test systems, test coverage analysis, test fixture design, in-circuit testing, test program development, throughput optimization, pin electronics, test socket design, yield enhancement, analog circuit testing, test time reduction, error rate measurement, ATE hardware, signal integrity testing, failure analysis techniques, reliability testing, automated test program development, test data management, test equipment calibration, test handler interface, hardware-in-the-loop testing, component level testing, and more.
    • For instance, in the semiconductor industry, high-speed digital testing plays a crucial role in ensuring the functionality and reliability of advanced chips. According to industry reports, the global high-speed digital testing market is projected to grow at a compound annual growth rate (CAGR) of approximately 10% over the next five years. In a recent case, a leading semiconductor manufacturer achieved a 20% reduction in test time by implementing an advanced software-defined testing solution for their high-speed digital ICs. This innovation not only improved their production efficiency but also enhanced their test coverage and yield.

    What are the Key Data Covered in this Automated Test Equipment (ATE) Market Research and Growth Report?

    • What is the expected growth of the Automated Test Equipment (ATE) Market between 2025 and 2029?

      • USD 2.59 billion, at a CAGR of 5.7%

    • What segmentation does the market report cover?

      • The report is segmented by End-user (Consumer electronics, Telecommunications, Aerospace and defense, and Others), Product (Non-memory ATE, Memory, and Discrete), and Geography (APAC, North America, Europe, South America, and Middle East and Africa)

    • Which regions are analyzed in the report?

      • APAC, North America, Europe, South America, and Middle East and Africa

    • What are the key growth drivers and market challenges?

      • Augmented production of electronic goods, High cost of automated test equipment (ATE)

    • Who are the major players in the Automated Test Equipment (ATE) Market?

      • Advantest Corp., ADVINT LLC, Aemulus Holdings Bhd, Aimil Ltd., Anritsu Corp., Astronics Corp., Averna Technologies Inc., BAE Systems Plc, Chroma ATE Inc., Cobham Ltd., Cohu Inc., INNOTECH Corp., Keysight Technologies Inc., National Instruments Corp., Rohde and Schwarz GmbH and Co. KG, ROOS INSTRUMENTS Inc., SPEA Spa, Teradyne Inc., TESEC Inc., and The Marvin Group

    Market Research Insights

    • The market for Automated Test Equipment (ATE) is a dynamic and ever-evolving industry, continually adapting to the demands of technology advancements. Two significant data points illustrate this trend. First, the number of test patterns generated annually has seen a steady increase, reaching over 10 billion in the latest estimates. Second, industry analysts project a growth rate of approximately 5% year-over-year in the coming years. In the realm of ATE, various techniques are employed to ensure product quality and performance. These include noise floor measurement, signal path analysis, quality control metrics, test pattern generation, compliance testing, data acquisition systems, diagnostic testing, fault simulation, test cell design, test program debugging, thermal management techniques, accelerated life testing, contact resistance measurement, fixture verification, test sequence generation, timing analysis, test cell automation, probe card technology, jitter analysis, manufacturing test flow, test result reporting, stress testing, test resource management, burn-in testing, statistical process control, and power consumption measurement.
    • An example of the impact of ATE on market dynamics can be observed in the semiconductor industry. By implementing advanced test solutions, companies have achieved a sales increase of up to 20% in their production lines. This enhancement in testing efficiency has led to shorter time-to-market for new products and improved overall competitiveness.

    We can help! Our analysts can customize this automated test equipment (ate) market research report to meet your requirements.

    Get in touch

    1 Executive Summary

    • 1.1 Market overview
      • Executive Summary - Chart on Market Overview
      • Executive Summary - Data Table on Market Overview
      • Executive Summary - Chart on Global Market Characteristics
      • Executive Summary - Chart on Market by Geography
      • Executive Summary - Chart on Market Segmentation by End-user
      • Executive Summary - Chart on Market Segmentation by Product
      • Executive Summary - Chart on Incremental Growth
      • Executive Summary - Data Table on Incremental Growth
      • Executive Summary - Chart on Company Market Positioning

    2 Technavio Analysis

    • 2.1 Analysis of price sensitivity, lifecycle, customer purchase basket, adoption rates, and purchase criteria
      • Analysis of price sensitivity, lifecycle, customer purchase basket, adoption rates, and purchase criteria
    • 2.2 Criticality of inputs and Factors of differentiation
      • Overview on criticality of inputs and factors of differentiation
    • 2.3 Factors of disruption
      • Overview on factors of disruption
    • 2.4 Impact of drivers and challenges
      • Impact of drivers and challenges in 2024 and 2029

    3 Market Landscape

    • 3.1 Market ecosystem
      • Parent Market
      • Data Table on - Parent Market
    • 3.2 Market characteristics
      • Market characteristics analysis
    • 3.3 Value chain analysis
      • Value chain analysis

    4 Market Sizing

    • 4.1 Market definition
      • Offerings of companies included in the market definition
    • 4.2 Market segment analysis
      • Market segments
    • 4.3 Market size 2024
      • 4.4 Market outlook: Forecast for 2024-2029
        • Chart on Global - Market size and forecast 2024-2029 ($ million)
        • Data Table on Global - Market size and forecast 2024-2029 ($ million)
        • Chart on Global Market: Year-over-year growth 2024-2029 (%)
        • Data Table on Global Market: Year-over-year growth 2024-2029 (%)

      5 Historic Market Size

      • 5.1 Global Automated Test Equipment (ATE) Market 2019 - 2023
        • Historic Market Size - Data Table on Global Automated Test Equipment (ATE) Market 2019 - 2023 ($ million)
      • 5.2 End-user segment analysis 2019 - 2023
        • Historic Market Size - End-user Segment 2019 - 2023 ($ million)
      • 5.3 Product segment analysis 2019 - 2023
        • Historic Market Size - Product Segment 2019 - 2023 ($ million)
      • 5.4 Geography segment analysis 2019 - 2023
        • Historic Market Size - Geography Segment 2019 - 2023 ($ million)
      • 5.5 Country segment analysis 2019 - 2023
        • Historic Market Size - Country Segment 2019 - 2023 ($ million)

      6 Qualitative Analysis

      • 6.1 Impact of AI on Global Automated Test Equipment (ATE) Market

        7 Five Forces Analysis

        • 7.1 Five forces summary
          • Five forces analysis - Comparison between 2024 and 2029
        • 7.2 Bargaining power of buyers
          • Bargaining power of buyers - Impact of key factors 2024 and 2029
        • 7.3 Bargaining power of suppliers
          • Bargaining power of suppliers - Impact of key factors in 2024 and 2029
        • 7.4 Threat of new entrants
          • Threat of new entrants - Impact of key factors in 2024 and 2029
        • 7.5 Threat of substitutes
          • Threat of substitutes - Impact of key factors in 2024 and 2029
        • 7.6 Threat of rivalry
          • Threat of rivalry - Impact of key factors in 2024 and 2029
        • 7.7 Market condition
          • Chart on Market condition - Five forces 2024 and 2029

        8 Market Segmentation by End-user

        • 8.1 Market segments
          • Chart on End-user - Market share 2024-2029 (%)
          • Data Table on End-user - Market share 2024-2029 (%)
        • 8.2 Comparison by End-user
          • Chart on Comparison by End-user
          • Data Table on Comparison by End-user
        • 8.3 Consumer electronics - Market size and forecast 2024-2029
          • Chart on Consumer electronics - Market size and forecast 2024-2029 ($ million)
          • Data Table on Consumer electronics - Market size and forecast 2024-2029 ($ million)
          • Chart on Consumer electronics - Year-over-year growth 2024-2029 (%)
          • Data Table on Consumer electronics - Year-over-year growth 2024-2029 (%)
        • 8.4 Telecommunications - Market size and forecast 2024-2029
          • Chart on Telecommunications - Market size and forecast 2024-2029 ($ million)
          • Data Table on Telecommunications - Market size and forecast 2024-2029 ($ million)
          • Chart on Telecommunications - Year-over-year growth 2024-2029 (%)
          • Data Table on Telecommunications - Year-over-year growth 2024-2029 (%)
        • 8.5 Aerospace and defense - Market size and forecast 2024-2029
          • Chart on Aerospace and defense - Market size and forecast 2024-2029 ($ million)
          • Data Table on Aerospace and defense - Market size and forecast 2024-2029 ($ million)
          • Chart on Aerospace and defense - Year-over-year growth 2024-2029 (%)
          • Data Table on Aerospace and defense - Year-over-year growth 2024-2029 (%)
        • 8.6 Others - Market size and forecast 2024-2029
          • Chart on Others - Market size and forecast 2024-2029 ($ million)
          • Data Table on Others - Market size and forecast 2024-2029 ($ million)
          • Chart on Others - Year-over-year growth 2024-2029 (%)
          • Data Table on Others - Year-over-year growth 2024-2029 (%)
        • 8.7 Market opportunity by End-user
          • Market opportunity by End-user ($ million)
          • Data Table on Market opportunity by End-user ($ million)

        9 Market Segmentation by Product

        • 9.1 Market segments
          • Chart on Product - Market share 2024-2029 (%)
          • Data Table on Product - Market share 2024-2029 (%)
        • 9.2 Comparison by Product
          • Chart on Comparison by Product
          • Data Table on Comparison by Product
        • 9.3 Non-memory ATE - Market size and forecast 2024-2029
          • Chart on Non-memory ATE - Market size and forecast 2024-2029 ($ million)
          • Data Table on Non-memory ATE - Market size and forecast 2024-2029 ($ million)
          • Chart on Non-memory ATE - Year-over-year growth 2024-2029 (%)
          • Data Table on Non-memory ATE - Year-over-year growth 2024-2029 (%)
        • 9.4 Memory - Market size and forecast 2024-2029
          • Chart on Memory - Market size and forecast 2024-2029 ($ million)
          • Data Table on Memory - Market size and forecast 2024-2029 ($ million)
          • Chart on Memory - Year-over-year growth 2024-2029 (%)
          • Data Table on Memory - Year-over-year growth 2024-2029 (%)
        • 9.5 Discrete - Market size and forecast 2024-2029
          • Chart on Discrete - Market size and forecast 2024-2029 ($ million)
          • Data Table on Discrete - Market size and forecast 2024-2029 ($ million)
          • Chart on Discrete - Year-over-year growth 2024-2029 (%)
          • Data Table on Discrete - Year-over-year growth 2024-2029 (%)
        • 9.6 Market opportunity by Product
          • Market opportunity by Product ($ million)
          • Data Table on Market opportunity by Product ($ million)

        10 Customer Landscape

        • 10.1 Customer landscape overview
          • Analysis of price sensitivity, lifecycle, customer purchase basket, adoption rates, and purchase criteria

        11 Geographic Landscape

        • 11.1 Geographic segmentation
          • Chart on Market share by geography 2024-2029 (%)
          • Data Table on Market share by geography 2024-2029 (%)
        • 11.2 Geographic comparison
          • Chart on Geographic comparison
          • Data Table on Geographic comparison
        • 11.3 APAC - Market size and forecast 2024-2029
          • Chart on APAC - Market size and forecast 2024-2029 ($ million)
          • Data Table on APAC - Market size and forecast 2024-2029 ($ million)
          • Chart on APAC - Year-over-year growth 2024-2029 (%)
          • Data Table on APAC - Year-over-year growth 2024-2029 (%)
        • 11.4 North America - Market size and forecast 2024-2029
          • Chart on North America - Market size and forecast 2024-2029 ($ million)
          • Data Table on North America - Market size and forecast 2024-2029 ($ million)
          • Chart on North America - Year-over-year growth 2024-2029 (%)
          • Data Table on North America - Year-over-year growth 2024-2029 (%)
        • 11.5 Europe - Market size and forecast 2024-2029
          • Chart on Europe - Market size and forecast 2024-2029 ($ million)
          • Data Table on Europe - Market size and forecast 2024-2029 ($ million)
          • Chart on Europe - Year-over-year growth 2024-2029 (%)
          • Data Table on Europe - Year-over-year growth 2024-2029 (%)
        • 11.6 South America - Market size and forecast 2024-2029
          • Chart on South America - Market size and forecast 2024-2029 ($ million)
          • Data Table on South America - Market size and forecast 2024-2029 ($ million)
          • Chart on South America - Year-over-year growth 2024-2029 (%)
          • Data Table on South America - Year-over-year growth 2024-2029 (%)
        • 11.7 Middle East and Africa - Market size and forecast 2024-2029
          • Chart on Middle East and Africa - Market size and forecast 2024-2029 ($ million)
          • Data Table on Middle East and Africa - Market size and forecast 2024-2029 ($ million)
          • Chart on Middle East and Africa - Year-over-year growth 2024-2029 (%)
          • Data Table on Middle East and Africa - Year-over-year growth 2024-2029 (%)
        • 11.8 US - Market size and forecast 2024-2029
          • Chart on US - Market size and forecast 2024-2029 ($ million)
          • Data Table on US - Market size and forecast 2024-2029 ($ million)
          • Chart on US - Year-over-year growth 2024-2029 (%)
          • Data Table on US - Year-over-year growth 2024-2029 (%)
        • 11.9 China - Market size and forecast 2024-2029
          • Chart on China - Market size and forecast 2024-2029 ($ million)
          • Data Table on China - Market size and forecast 2024-2029 ($ million)
          • Chart on China - Year-over-year growth 2024-2029 (%)
          • Data Table on China - Year-over-year growth 2024-2029 (%)
        • 11.10 Japan - Market size and forecast 2024-2029
          • Chart on Japan - Market size and forecast 2024-2029 ($ million)
          • Data Table on Japan - Market size and forecast 2024-2029 ($ million)
          • Chart on Japan - Year-over-year growth 2024-2029 (%)
          • Data Table on Japan - Year-over-year growth 2024-2029 (%)
        • 11.11 Germany - Market size and forecast 2024-2029
          • Chart on Germany - Market size and forecast 2024-2029 ($ million)
          • Data Table on Germany - Market size and forecast 2024-2029 ($ million)
          • Chart on Germany - Year-over-year growth 2024-2029 (%)
          • Data Table on Germany - Year-over-year growth 2024-2029 (%)
        • 11.12 South Korea - Market size and forecast 2024-2029
          • Chart on South Korea - Market size and forecast 2024-2029 ($ million)
          • Data Table on South Korea - Market size and forecast 2024-2029 ($ million)
          • Chart on South Korea - Year-over-year growth 2024-2029 (%)
          • Data Table on South Korea - Year-over-year growth 2024-2029 (%)
        • 11.13 UK - Market size and forecast 2024-2029
          • Chart on UK - Market size and forecast 2024-2029 ($ million)
          • Data Table on UK - Market size and forecast 2024-2029 ($ million)
          • Chart on UK - Year-over-year growth 2024-2029 (%)
          • Data Table on UK - Year-over-year growth 2024-2029 (%)
        • 11.14 France - Market size and forecast 2024-2029
          • Chart on France - Market size and forecast 2024-2029 ($ million)
          • Data Table on France - Market size and forecast 2024-2029 ($ million)
          • Chart on France - Year-over-year growth 2024-2029 (%)
          • Data Table on France - Year-over-year growth 2024-2029 (%)
        • 11.15 Canada - Market size and forecast 2024-2029
          • Chart on Canada - Market size and forecast 2024-2029 ($ million)
          • Data Table on Canada - Market size and forecast 2024-2029 ($ million)
          • Chart on Canada - Year-over-year growth 2024-2029 (%)
          • Data Table on Canada - Year-over-year growth 2024-2029 (%)
        • 11.16 Australia - Market size and forecast 2024-2029
          • Chart on Australia - Market size and forecast 2024-2029 ($ million)
          • Data Table on Australia - Market size and forecast 2024-2029 ($ million)
          • Chart on Australia - Year-over-year growth 2024-2029 (%)
          • Data Table on Australia - Year-over-year growth 2024-2029 (%)
        • 11.17 Italy - Market size and forecast 2024-2029
          • Chart on Italy - Market size and forecast 2024-2029 ($ million)
          • Data Table on Italy - Market size and forecast 2024-2029 ($ million)
          • Chart on Italy - Year-over-year growth 2024-2029 (%)
          • Data Table on Italy - Year-over-year growth 2024-2029 (%)
        • 11.18 Market opportunity by geography
          • Market opportunity by geography ($ million)
          • Data Tables on Market opportunity by geography ($ million)

        12 Drivers, Challenges, and Opportunity/Restraints

        • 12.1 Market drivers
          • 12.2 Market challenges
            • 12.3 Impact of drivers and challenges
              • Impact of drivers and challenges in 2024 and 2029
            • 12.4 Market opportunities/restraints

              13 Competitive Landscape

              • 13.1 Overview
                • 13.2 Competitive Landscape
                  • Overview on criticality of inputs and factors of differentiation
                • 13.3 Landscape disruption
                  • Overview on factors of disruption
                • 13.4 Industry risks
                  • Impact of key risks on business

                14 Competitive Analysis

                • 14.1 Companies profiled
                  • Companies covered
                • 14.2 Company ranking index
                  • Company ranking index
                • 14.3 Market positioning of companies
                  • Matrix on companies position and classification
                • 14.4 Advantest Corp.
                  • Advantest Corp. - Overview
                  • Advantest Corp. - Business segments
                  • Advantest Corp. - Key news
                  • Advantest Corp. - Key offerings
                  • Advantest Corp. - Segment focus
                  • SWOT
                • 14.5 Aemulus Holdings Bhd
                  • Aemulus Holdings Bhd - Overview
                  • Aemulus Holdings Bhd - Product / Service
                  • Aemulus Holdings Bhd - Key offerings
                  • SWOT
                • 14.6 Aimil Ltd.
                  • Aimil Ltd. - Overview
                  • Aimil Ltd. - Product / Service
                  • Aimil Ltd. - Key offerings
                  • SWOT
                • 14.7 Anritsu Corp.
                  • Anritsu Corp. - Overview
                  • Anritsu Corp. - Business segments
                  • Anritsu Corp. - Key offerings
                  • Anritsu Corp. - Segment focus
                  • SWOT
                • 14.8 Astronics Corp.
                  • Astronics Corp. - Overview
                  • Astronics Corp. - Business segments
                  • Astronics Corp. - Key news
                  • Astronics Corp. - Key offerings
                  • Astronics Corp. - Segment focus
                  • SWOT
                • 14.9 BAE Systems Plc
                  • BAE Systems Plc - Overview
                  • BAE Systems Plc - Business segments
                  • BAE Systems Plc - Key news
                  • BAE Systems Plc - Key offerings
                  • BAE Systems Plc - Segment focus
                  • SWOT
                • 14.10 Chroma ATE Inc.
                  • Chroma ATE Inc. - Overview
                  • Chroma ATE Inc. - Business segments
                  • Chroma ATE Inc. - Key offerings
                  • Chroma ATE Inc. - Segment focus
                  • SWOT
                • 14.11 Cobham Ltd.
                  • Cobham Ltd. - Overview
                  • Cobham Ltd. - Product / Service
                  • Cobham Ltd. - Key offerings
                  • SWOT
                • 14.12 Cohu Inc.
                  • Cohu Inc. - Overview
                  • Cohu Inc. - Product / Service
                  • Cohu Inc. - Key news
                  • Cohu Inc. - Key offerings
                  • SWOT
                • 14.13 INNOTECH Corp.
                  • INNOTECH Corp. - Overview
                  • INNOTECH Corp. - Business segments
                  • INNOTECH Corp. - Key offerings
                  • INNOTECH Corp. - Segment focus
                  • SWOT
                • 14.14 Keysight Technologies Inc.
                  • Keysight Technologies Inc. - Overview
                  • Keysight Technologies Inc. - Business segments
                  • Keysight Technologies Inc. - Key news
                  • Keysight Technologies Inc. - Key offerings
                  • Keysight Technologies Inc. - Segment focus
                  • SWOT
                • 14.15 National Instruments Corp.
                  • National Instruments Corp. - Overview
                  • National Instruments Corp. - Product / Service
                  • National Instruments Corp. - Key offerings
                  • SWOT
                • 14.16 Rohde and Schwarz GmbH and Co. KG
                  • Rohde and Schwarz GmbH and Co. KG - Overview
                  • Rohde and Schwarz GmbH and Co. KG - Product / Service
                  • Rohde and Schwarz GmbH and Co. KG - Key offerings
                  • SWOT
                • 14.17 Teradyne Inc.
                  • Teradyne Inc. - Overview
                  • Teradyne Inc. - Business segments
                  • Teradyne Inc. - Key news
                  • Teradyne Inc. - Key offerings
                  • Teradyne Inc. - Segment focus
                  • SWOT
                • 14.18 TESEC Inc.
                  • TESEC Inc. - Overview
                  • TESEC Inc. - Product / Service
                  • TESEC Inc. - Key offerings
                  • SWOT

                15 Appendix

                • 15.1 Scope of the report
                  • 15.2 Inclusions and exclusions checklist
                    • Inclusions checklist
                    • Exclusions checklist
                  • 15.3 Currency conversion rates for US$
                    • Currency conversion rates for US$
                  • 15.4 Research methodology
                    • Research methodology
                  • 15.5 Data procurement
                    • Information sources
                  • 15.6 Data validation
                    • Data validation
                  • 15.7 Validation techniques employed for market sizing
                    • Validation techniques employed for market sizing
                  • 15.8 Data synthesis
                    • Data synthesis
                  • 15.9 360 degree market analysis
                    • 360 degree market analysis
                  • 15.10 List of abbreviations
                    • List of abbreviations

                  Research Methodology

                  Technavio presents a detailed picture of the market by way of study, synthesis, and summation of data from multiple sources. The analysts have presented the various facets of the market with a particular focus on identifying the key industry influencers. The data thus presented is comprehensive, reliable, and the result of extensive research, both primary and secondary.

                  INFORMATION SOURCES

                  Primary sources

                  • Manufacturers and suppliers
                  • Channel partners
                  • Industry experts
                  • Strategic decision makers

                  Secondary sources

                  • Industry journals and periodicals
                  • Government data
                  • Financial reports of key industry players
                  • Historical data
                  • Press releases

                  DATA ANALYSIS

                  Data Synthesis

                  • Collation of data
                  • Estimation of key figures
                  • Analysis of derived insights

                  Data Validation

                  • Triangulation with data models
                  • Reference against proprietary databases
                  • Corroboration with industry experts

                  REPORT WRITING

                  Qualitative

                  • Market drivers
                  • Market challenges
                  • Market trends
                  • Five forces analysis

                  Quantitative

                  • Market size and forecast
                  • Market segmentation
                  • Geographical insights
                  • Competitive landscape

                  Interested in this report?

                  Get your sample now to see our research methodology and insights!

                  Download Now

                  Frequently Asked Questions

                  Automated Test Equipment (Ate) market growth will increase by $ 2592.1 mn during 2025-2029 .

                  The Automated Test Equipment (Ate) market is expected to grow at a CAGR of 5.7% during 2025-2029 .

                  Automated Test Equipment (Ate) market is segmented by End-user( Consumer electronics, Telecommunications, Aerospace and defense, Others) Product( Non-memory ATE, Memory, Discrete, South America, MEA)

                  Advantest Corp., ADVINT LLC, Aemulus Holdings Bhd, Aimil Ltd., Anritsu Corp., Astronics Corp., Averna Technologies Inc., BAE Systems Plc, Chroma ATE Inc., Cobham Ltd., Cohu Inc., INNOTECH Corp., Keysight Technologies Inc., National Instruments Corp., Rohde and Schwarz GmbH and Co. KG, ROOS INSTRUMENTS Inc., SPEA Spa, Teradyne Inc., TESEC Inc., The Marvin Group are a few of the key vendors in the Automated Test Equipment (Ate) market.

                  APAC will register the highest growth rate of 46% among the other regions. Therefore, the Automated Test Equipment (Ate) market in APAC is expected to garner significant business opportunities for the vendors during the forecast period.

                  US, China, Japan, Germany, South Korea, UK, France, Canada, Italy, Australia

                  • Augmented production of electronic goodsThe electronics industry is expected to grow rapidly during the forecast period. An increase in the exports of electronic goods has been recorded in China is the driving factor this market.
                  • Japan is the driving factor this market.
                  • and Singapore. Mostly moderately priced and low-priced equipment is exported by APAC. Also is the driving factor this market.
                  • strong growth in the semiconductor and electronics industry in APAC will drive the growth of the ATE market in the region. Though smartphone sales have been stagnant is the driving factor this market.
                  • the shipments of smartphones are growing is the driving factor this market.
                  • and it will promote the growth of test and measurement equipment. This decline is primarily due to market fragmentation in North America is the driving factor this market.
                  • Western Europe is the driving factor this market.
                  • and China is the driving factor this market.
                  • as well as the drop in the average selling price of smartphones in developed countries. However is the driving factor this market.
                  • there are still many regions where smartphones are not popular is the driving factor this market.
                  • and the market penetration of smartphones in these areas will increase the demand for ATE. The increasing sales of smartphones are the highest motivation factor in this segment. China is the driving factor this market.
                  • Hong Kong is the driving factor this market.
                  • Vietnam is the driving factor this market.
                  • Singapore is the driving factor this market.
                  • and Taiwan are the major producers of smartphones is the driving factor this market.
                  • and the growing smartphone market will foster the sales of ATE in this region. A substantial number of people use the internet with the help of smartphones. For instance is the driving factor this market.
                  • social media platforms such as Facebook is the driving factor this market.
                  • WhatsApp is the driving factor this market.
                  • Twitter is the driving factor this market.
                  • LinkedIn is the driving factor this market.
                  • banking facilities is the driving factor this market.
                  • and money wallets are more popular on mobile platforms than on desktops and laptops. The increased use of the internet through smartphones has induced manufacturers to introduce new technologies like LTE is the driving factor this market.
                  • 4G is the driving factor this market.
                  • and 5G to these platforms. However is the driving factor this market.
                  • these evolving networks and mobile technologies require test and measurement equipment to ensure quality and reliability. Therefore is the driving factor this market.
                  • due to the growing availability of inexpensive smartphones is the driving factor this market.
                  • the number of people with access to the internet is increasing. This will propel the demand for ATE. The US is one of the major consumers of electronic products globally is the driving factor this market.
                  • with significant technological innovations being brought to the electronics industry in the US. People in the country are highly adaptable to new and upgraded technologies. Therefore is the driving factor this market.
                  • the sales of electronic goods are expected to be significant in the US. As evident is the driving factor this market.
                  • the sales of electronic goods are growing across the world is the driving factor this market.
                  • primarily fueled by the introduction of new technologies is the driving factor this market.
                  • an increase in market penetration by various OEMs is the driving factor this market.
                  • and the availability of products with the latest features at reduced prices. Hence is the driving factor this market.
                  • there will be an increase in the demand for ATE in the electronics and semiconductor sectors is the driving factor this market.
                  • which will drive the growth of the global ATE market during the forecast period. is the driving factor this market.

                  The Automated Test Equipment (Ate) market vendors should focus on grabbing business opportunities from the Consumer electronics segment as it accounted for the largest market share in the base year.