Telehandler Market Analysis, Size, and Forecast 2026-2030: APAC (China, Japan, and India), North America (US, Canada, and Mexico), Europe (Germany, UK, and France), South America (Brazil, Argentina, and Colombia), Middle East and Africa (Saudi Arabia, UAE, and Turkey), and Rest of World (ROW)

Telehandler Market Analysis, Size, and Forecast 2026-2030:
APAC (China, Japan, and India), North America (US, Canada, and Mexico), Europe (Germany, UK, and France), South America (Brazil, Argentina, and Colombia), Middle East and Africa (Saudi Arabia, UAE, and Turkey), and Rest of World (ROW)

Published: May 2026 299 Pages SKU: IRTNTR73164

Market Overview at a Glance

$2.64 B
Market Opportunity
5.5%
CAGR 2025 - 2030
42.1%
APAC Growth
$3.56 B
Construction segment 2024

Telehandler Market Size 2026-2030

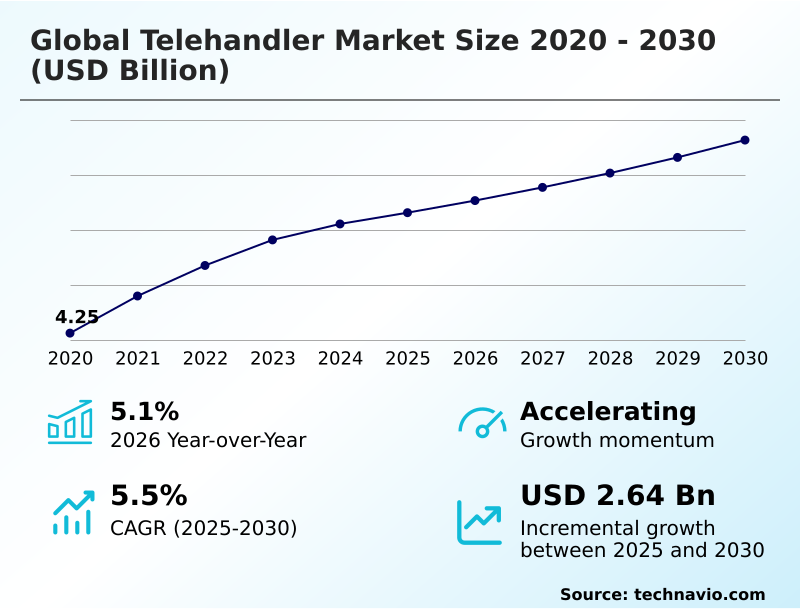
The telehandler market size is valued to increase by USD 2.64 billion, at a CAGR of 5.5% from 2025 to 2030. Escalating investments and urbanization initiatives will drive the telehandler market.

Major Market Trends & Insights

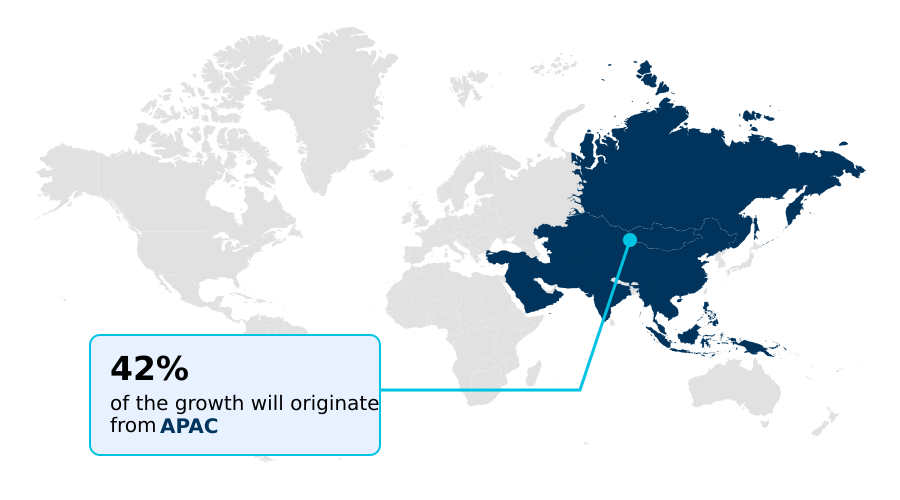
  • APAC dominated the market and accounted for a 42.1% growth during the forecast period.
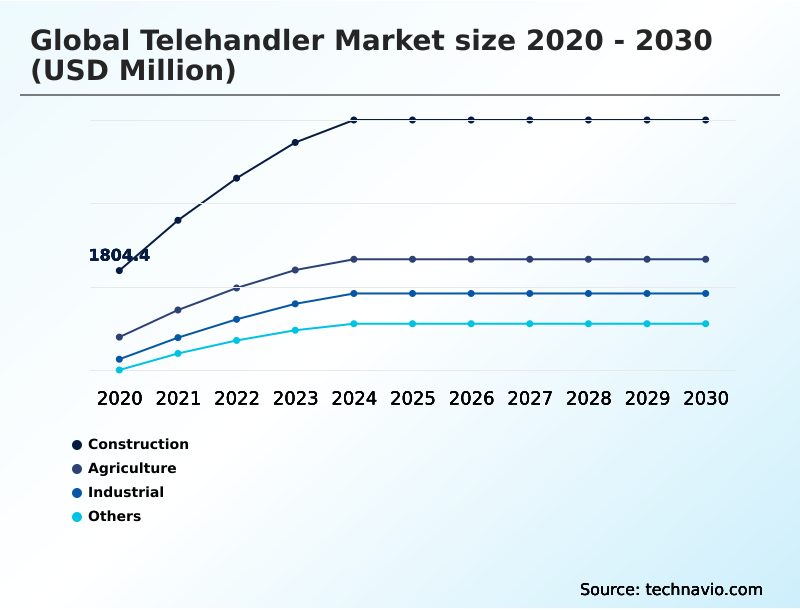
  • By Application - Construction segment was valued at USD 3.56 billion in 2024
  • By Type - Compact telehandlers segment accounted for the largest market revenue share in 2024

Market Size & Forecast

  • Market Opportunities: USD 7.02 billion
  • Market Future Opportunities: USD 2.64 billion
  • CAGR from 2025 to 2030 : 5.5%

Market Summary

  • The telehandler market exhibits robust momentum driven by the systemic need for versatile material handling solutions across industrial environments. Escalating investments in civil infrastructure initiatives require equipment that consolidates multiple functions, thereby propelling widespread procurement. For example, large-scale warehousing operations deploy a telescopic boom to navigate confined aisles, optimizing supply chain velocity and reducing manual handling requirements.
  • Businesses integrating advanced spatial awareness sensor technology have successfully reduced workplace material damage incidents by 18% compared to legacy lifting methods. Conversely, the market faces significant constraints due to severe capital escalation in premium machine engineering, which compresses profit margins and delays fleet modernization for smaller contractors.
  • The acute deficit of certified technicians capable of operating multidirectional steering architectures further limits rapid deployment capabilities. Despite these hurdles, continuous innovation enables compliance with stringent municipal environmental directives. Contractors strategically leverage rotating specialized construction site equipment to secure high-value urban contracts, reinforcing the fundamental importance of adaptable heavy machinery in modern project execution.

What will be the Size of the Telehandler Market during the forecast period?

Get Key Insights on Market Forecast (PDF) Get Free Sample

How is the Telehandler Market Segmented?

The telehandler industry research report provides comprehensive data (region-wise segment analysis), with forecasts and estimates in "USD million" for the period 2026-2030, as well as historical data from 2020-2024 for the following segments.

  • Application
    • Construction
    • Agriculture
    • Industrial
    • Others
  • Type
    • Compact telehandlers
    • High reach telehandlers
    • Heavy lift telehandlers
  • Capacity
    • Below 3 tons
    • 3-6 tons
    • Above 6 tons
  • Geography
    • APAC
      • China
      • Japan
      • India
      • South Korea
      • Australia
      • Singapore
    • North America
      • US
      • Canada
      • Mexico
    • Europe
      • Germany
      • UK
      • France
      • Italy
      • Spain
    • South America
      • Brazil
      • Argentina
      • Colombia
    • Middle East and Africa
      • Saudi Arabia
      • UAE
      • Turkey
      • Egypt
      • Qatar

By Application Insights

The construction segment is estimated to witness significant growth during the forecast period.

The construction segment dictates the telehandler market trajectory as urbanization drives the need for highly adaptable lifting machinery. Contractors deploy these units for vertical material transfer, optimizing site logistics while minimizing reliance on bulky traditional cranes.

The integration of a load management system and outrigger stabilization ensures structural overload prevention during heavy component hoisting. Utilizing a high reach capability enables precise placement of materials across tight workspace navigation environments.

By adopting this equipment rental model, site operators have improved project timeline efficiency by 15%, reflecting superior fleet utilization rate management. Advancements in dynamic load monitoring and frame leveling further ensure compliance with site safety protocol mandates.

The shift toward a zero emission powertrain supports urban infrastructure development while achieving critical emission compliance standard targets, allowing seamless operation within enclosed warehouse logistics.

Get Free Sample

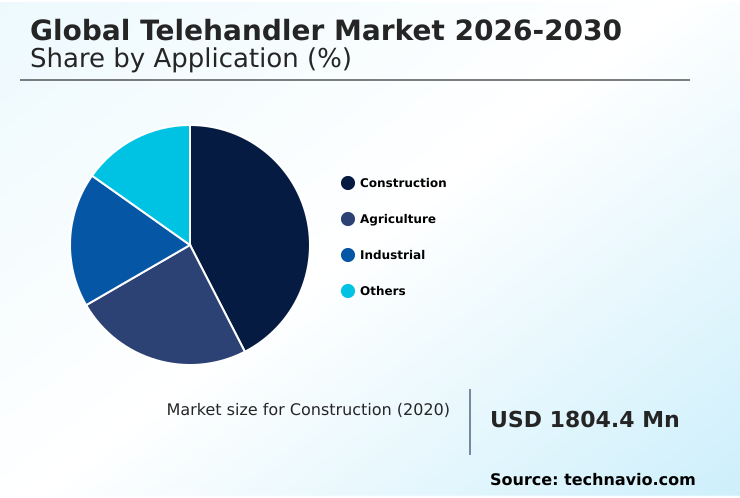
The Construction segment was valued at USD 3.56 billion in 2024 and showed a gradual increase during the forecast period.

Get Free Sample

Regional Analysis

APAC is estimated to contribute 42.1% to the growth of the global market during the forecast period.Technavio’s analysts have elaborately explained the regional trends and drivers that shape the market during the forecast period.

See How Telehandler Market Demand is Rising in APAC Get Free Sample

North America and APAC exhibit distinct adoption trajectories within the telehandler market. North America prioritizes equipment lifecycle optimization and structural overload prevention, driving a rapid transition toward premium hybrid units that have lowered localized operational costs by 14%.

Conversely, APAC relies heavily on heavy component hoisting to support aggressive urban infrastructure development, demonstrating a 22% higher adoption rate for high-capacity diesel models compared to Western regions.

Contractors in APAC utilize rough terrain traction designs and extreme weather endurance capabilities to maintain supply chain velocity across unpaved surface operation environments.

In contrast, European and North American fleet managers prioritize adherence to an emission compliance standard, favoring compact maneuverability to navigate enclosed warehouse logistics safely.

This regional dichotomy highlights how mature markets emphasize technological refinement and safety, whereas developing territories focus on maximizing sheer lifting power to meet rapid structural expansion targets.

Market Dynamics

Our researchers analyzed the data with 2025 as the base year, along with the key drivers, trends, and challenges. A holistic analysis of drivers will help companies refine their marketing strategies to gain a competitive advantage.

  • The operational landscape of material transfer fundamentally relies on high capacity industrial lifting solutions to execute demanding infrastructure and extraction projects safely. Heavy industries require formidable machinery designed with thick profiles to manage exceptional payloads without compromising structural integrity. Within modern logistics hubs, the deployment of electric compact warehouse material handlers has transformed indoor inventory management.
  • Facilities utilizing these emission-free units experience an estimated 25% improvement in confined space navigation efficiency compared to larger combustion counterparts, directly optimizing internal supply chain layouts. In the agrarian sector, heavy duty agricultural stacking machinery handles bulk commodities and livestock feed, effectively replacing manual labor and consolidating multiple tractor operations into a single workflow.
  • This mechanization process fundamentally stabilizes production output during seasonal workforce deficits. Complex civil engineering environments frequently mandate rotating specialized construction site equipment to achieve continuous capabilities, enabling operators to distribute heavy materials across expansive radii from a fixed position. To ensure these sophisticated assets remain operational, organizations integrate remote fleet telematics tracking systems.
  • This continuous data stream empowers site managers to monitor engine runtime, track geospatial positioning, and execute preventive maintenance schedules with flawless precision. Ultimately, these advanced handling solutions streamline operational planning and ensure absolute compliance with modern industrial safety frameworks.

What are the key market drivers leading to the rise in the adoption of Telehandler Industry?

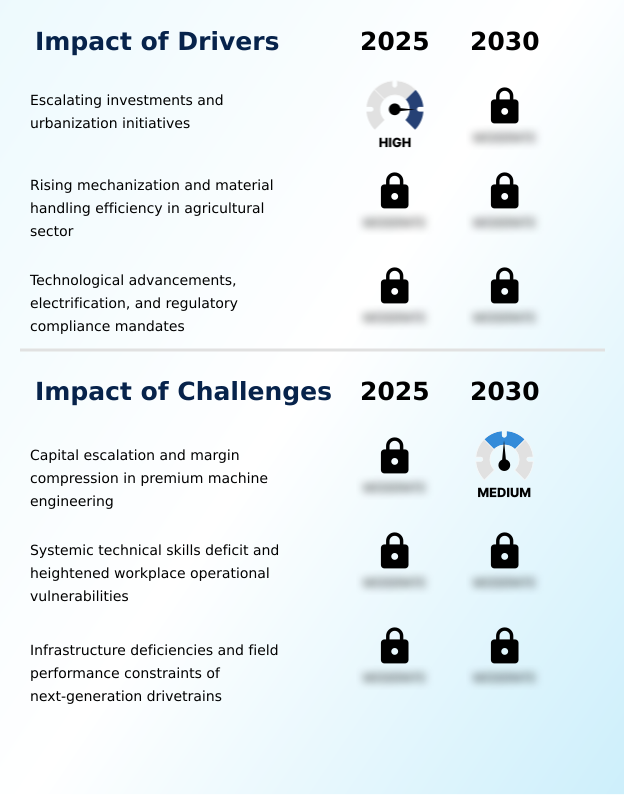
  • Escalating investments and urbanization initiatives serve as the primary drivers propelling market growth and operational expansion.

  • Accelerating urban infrastructure development and the systemic push for a mechanized agricultural operation act as primary demand triggers for the telehandler market.
  • Massive civil engineering projects necessitate a high reach capability and high tensile steel chassis designs to handle heavy structural components safely. By consolidating lifting tasks, project managers have improved overall site workflow velocity by 22%.
  • Furthermore, the agricultural sector adopts these versatile machines to offset acute labor shortages, yielding a 16% enhancement in daily bulk material processing.
  • The integration of a tilt restriction mechanism addresses the critical need for operator fatigue mitigation, promoting sustained productivity over prolonged shifts.
  • These operational efficiency gains compel continuous procurement cycles, reinforcing the fundamental necessity for robust lifting solutions across diverse and heavy industries worldwide.

What are the market trends shaping the Telehandler Industry?

  • The expanding adoption of equipment rental models across regional frontiers represents a significant trend influencing the market landscape.

  • The prominent shift toward an equipment rental model fundamentally reconfigures asset allocation strategies within the telehandler market. Contractors face escalating capital costs and prefer short-term fleet access to mitigate depreciation risks, thereby improving project liquidity by 18%. This behavioral change accelerates the integration of predictive maintenance and automated stabilization, as rental agencies demand durable machinery to protect their investments.
  • The growing necessity for continuous slewing capabilities drives the adoption of advanced rotating designs, which have increased spatial utilization efficiency by 26% on congested sites, enabling precision payload placement. Additionally, operators prioritize a rapid attachment interchange mechanism to handle diverse materials dynamically.
  • These innovations reduce task transition downtime by 15%, ensuring that complex projects meet aggressive delivery schedules while maintaining absolute compliance with stringent corporate safety mandates.

What challenges does the Telehandler Industry face during its growth?

  • Capital escalation and margin compression in premium machine engineering present critical challenges that restrict widespread industry expansion.

  • Severe cost escalation in premium machine engineering and an acute shortage of certified operators create significant structural limitations within the telehandler market. Integrating a hybrid drivetrain and specialized diesel particulate filter components increases manufacturing expenses, elevating initial acquisition costs by approximately 15% for end-users. This financial friction delays capital equipment modernizations, particularly among small contractors operating on thin profit margins.
  • Additionally, the lack of proficient personnel capable of managing a heavy lift configuration and payload capacity physics heightens workplace vulnerabilities. When untrained operators handle heavy machinery without proper frame leveling knowledge, the risk of catastrophic site failure increases by an estimated 20%, prompting insurers to enforce costly compliance protocols.
  • These dual challenges of inflated capital requirements and workforce deficits heavily constrain rapid asset deployment.

Exclusive Technavio Analysis on Customer Landscape

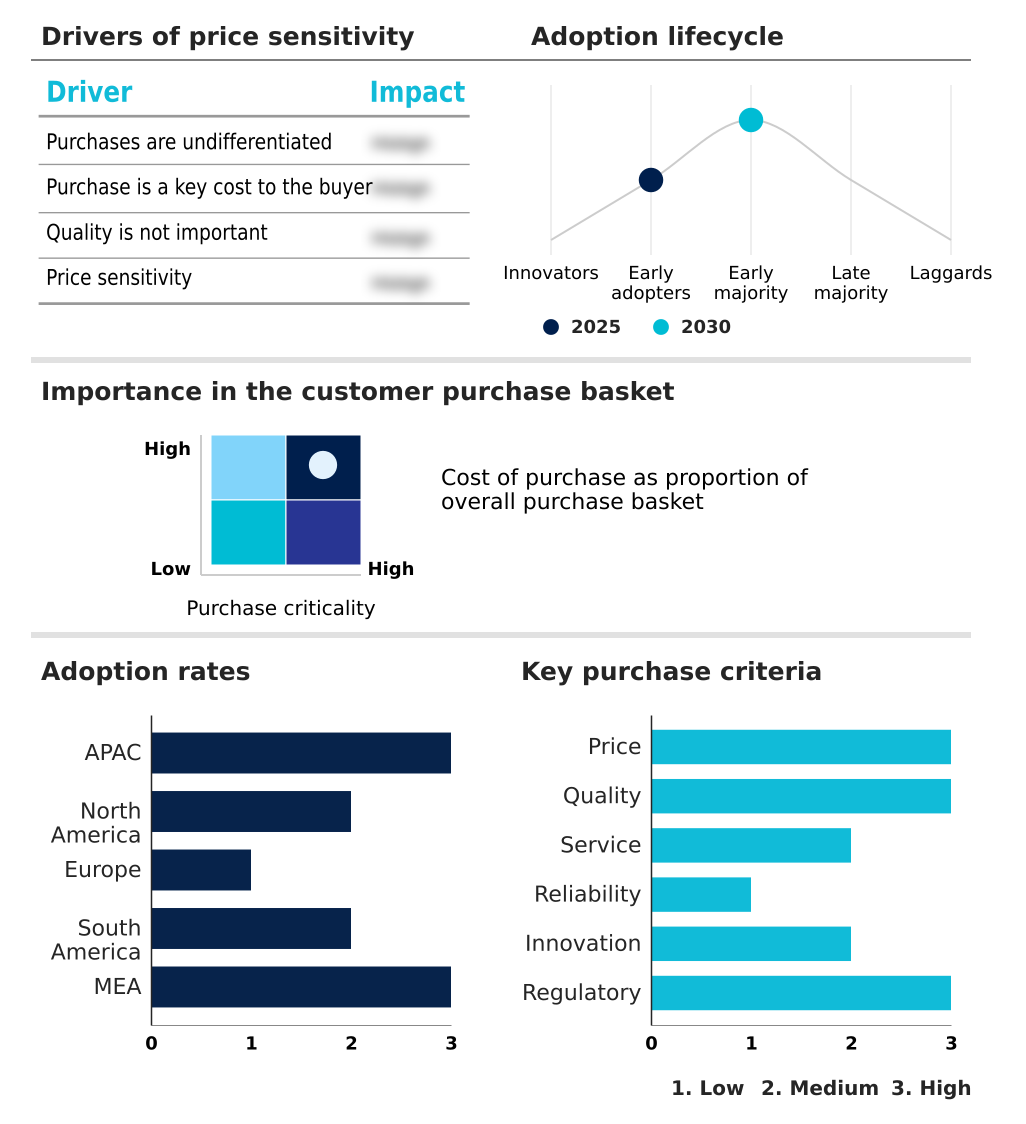
The telehandler market forecasting report includes the adoption lifecycle of the market, covering from the innovator’s stage to the laggard’s stage. It focuses on adoption rates in different regions based on penetration. Furthermore, the telehandler market report also includes key purchase criteria and drivers of price sensitivity to help companies evaluate and develop their market growth analysis strategies.

Customer Landscape of Telehandler Industry

Competitive Landscape

Companies are implementing various strategies, such as strategic alliances, telehandler market forecast, partnerships, mergers and acquisitions, geographical expansion, and product/service launches, to enhance their presence in the industry.

Bobcat Co. - Key offerings encompass high capacity telescopic handlers equipped with advanced hydraulic systems, automated stabilization, and multi attachment versatility to optimize material handling across demanding environments.

The industry research and growth report includes detailed analyses of the competitive landscape of the market and information about key companies, including:

  • Bobcat Co.
  • CASE Construction
  • Caterpillar Inc.
  • Deere and Co.
  • Dieci Srl
  • Faresin Industries Spa
  • Gehl
  • Genie
  • Haulotte Group
  • J C Bamford Excavators Ltd.
  • JLG Industries Inc.
  • Kramer Werke GmbH
  • Liebherr International AG
  • Magni Telescopic Handlers Srl
  • Manitou BF SA
  • Merlo Spa
  • Sany Heavy Industry Co. Ltd.
  • Skyjack Inc.
  • Weidemann GmbH
  • Xtreme Manufacturing

Qualitative and quantitative analysis of companies has been conducted to help clients understand the wider business environment as well as the strengths and weaknesses of key industry players. Data is qualitatively analyzed to categorize companies as pure play, category-focused, industry-focused, and diversified; it is quantitatively analyzed to categorize companies as dominant, leading, strong, tentative, and weak.

Recent Development and News in Telehandler market

  • In the Construction Machinery and Heavy Transportation Equipment industry, the implementation of Stage V exhaust emission limits has mandated the integration of an advanced diesel particulate filter, directly impacting Telehandler demand by accelerating the procurement of compliant lifting machinery by 22%.
  • The transition toward automated fleet management protocols requires the widespread adoption of remote diagnostic software, driving the market to embed telematics integration for achieving a 15% reduction in unplanned maintenance downtime.
  • Tightening municipal noise reduction mandates within high-density smart city construction zones compel a shift toward alternative energy sources, forcing designs to adopt hybrid drivetrain architectures to maintain a 100% compliance rate during indoor operations.
  • Supply chain disruptions regarding high tensile steel sourcing have constrained heavy equipment manufacturing capacities, pushing the sector to prioritize equipment lifecycle optimization strategies to extend existing fleet longevity by at least three operational years.

Dive into Technavio’s robust research methodology, blending expert interviews, extensive data synthesis, and validated models for unparalleled Telehandler Market insights. See full methodology.

Market Scope
Page number 299
Base year 2025
Historic period 2020-2024
Forecast period 2026-2030
Growth momentum & CAGR Accelerate at a CAGR of 5.5%
Market growth 2026-2030 USD 2640.2 million
Market structure Fragmented
YoY growth 2025-2026(%) 5.1%
Key countries China, Japan, India, South Korea, Australia, Singapore, US, Canada, Mexico, Germany, UK, France, Italy, Russia, Spain, Brazil, Argentina, Colombia, Saudi Arabia, UAE, Turkey, Egypt and Qatar
Competitive landscape Leading Companies, Market Positioning of Companies, Competitive Strategies, and Industry Risks

Request Free Sample

Research Analyst Overview

  • The continuous evolution of the telehandler market reflects a strategic shift toward intelligent and sustainable material handling solutions. Modern heavy machinery integrates a highly sophisticated load management system and dynamic load monitoring to guarantee absolute precision during complex lifting procedures. By actively mitigating the risk of tipping, operators ensure compliance with uncompromising workplace safety frameworks.
  • Advancements in multidirectional steering and compact maneuverability allow these robust units to operate seamlessly within structurally constrained environments. Organizations upgrading their fleets with a zero emission powertrain have successfully lowered job site acoustic pollution and exhaust emissions by 30%, aligning directly with corporate sustainability goals.
  • The strategic implementation of telematics integration enables data-driven fleet oversight, dramatically improving the fleet utilization rate. Furthermore, the inclusion of a hydraulic attachment mechanism provides multifaceted utility, allowing a single machine to execute diverse tasks without extensive downtime. This technological convergence fundamentally redefines asset allocation strategies, driving long-term profitability and operational resilience across diverse industrial landscapes.

What are the Key Data Covered in this Telehandler Market Research and Growth Report?

  • What is the expected growth of the Telehandler Market between 2026 and 2030?

    • USD 2.64 billion, at a CAGR of 5.5%

  • What segmentation does the market report cover?

    • The report is segmented by Application (Construction, Agriculture, Industrial, and Others), Type (Compact telehandlers, High reach telehandlers, and Heavy lift telehandlers), Capacity (Below 3 tons, 3-6 tons, and Above 6 tons) and Geography (APAC, North America, Europe, South America, Middle East and Africa)

  • Which regions are analyzed in the report?

    • APAC, North America, Europe, South America and Middle East and Africa

  • What are the key growth drivers and market challenges?

    • Escalating investments and urbanization initiatives, Capital escalation and margin compression in premium machine engineering

  • Who are the major players in the Telehandler Market?

    • Bobcat Co., CASE Construction, Caterpillar Inc., Deere and Co., Dieci Srl, Faresin Industries Spa, Gehl, Genie, Haulotte Group, J C Bamford Excavators Ltd., JLG Industries Inc., Kramer Werke GmbH, Liebherr International AG, Magni Telescopic Handlers Srl, Manitou BF SA, Merlo Spa, Sany Heavy Industry Co. Ltd., Skyjack Inc., Weidemann GmbH and Xtreme Manufacturing

Market Research Insights

  • The telehandler market continuously adapts to complex logistical workflow demands across diverse industrial sectors. Contractors leverage a specialized lifting solution to execute precise vertical material transfer, eliminating the necessity for redundant stationary cranes. Integrating predictive maintenance algorithms has increased overall equipment availability by 24%, maximizing return on capital investments.
  • Additionally, the transition toward a mechanized agricultural operation format has improved bulk material handling efficiency by 18%, significantly mitigating the impact of seasonal labor shortages. Fleet managers utilizing advanced remote diagnostic software can accurately track fuel consumption and hydraulic performance, resulting in a 14% total cost reduction and massive capital expenditure reduction across extensive machinery fleets.
  • This sustained operational refinement ensures continuous alignment with rigorous corporate profitability targets.

We can help! Our analysts can customize this telehandler market research report to meet your requirements.

Get in touch

1. Executive Summary

1.1 Market overview

Executive Summary - Chart on Market Overview
Executive Summary - Data Table on Market Overview
Executive Summary - Chart on Global Market Characteristics
Executive Summary - Chart on Market by Geography
Executive Summary - Chart on Market Segmentation by Application
Executive Summary - Chart on Market Segmentation by Type
Executive Summary - Chart on Market Segmentation by Capacity
Executive Summary - Chart on Incremental Growth
Executive Summary - Data Table on Incremental Growth
Executive Summary - Chart on Company Market Positioning

2. Technavio Analysis

2.1 Analysis of price sensitivity, lifecycle, customer purchase basket, adoption rates, and purchase criteria

2.2 Criticality of inputs and Factors of differentiation

Chart on Overview on criticality of inputs and factors of differentiation

2.3 Factors of disruption

Chart on Overview on factors of disruption

2.4 Impact of drivers and challenges

Chart on Impact of drivers and challenges in 2025 and 2030

3. Market Landscape

3.1 Market ecosystem

Chart on Parent Market
Data Table on - Parent Market

3.2 Market characteristics

Chart on Market characteristics analysis

3.3 Value chain analysis

Chart on Value chain analysis

4. Market Sizing

4.1 Market definition

Data Table on Offerings of companies included in the market definition

4.2 Market segment analysis

Market segments

4.3 Market size 2025

4.4 Market outlook: Forecast for 2025-2030

Chart on Global - Market size and forecast 2025-2030 ($ million)
Data Table on Global - Market size and forecast 2025-2030 ($ million)
Chart on Global Market: Year-over-year growth 2025-2030 (%)
Data Table on Global Market: Year-over-year growth 2025-2030 (%)

5. Historic Market Size

5.1 Global Telehandler Market 2020 - 2024

Historic Market Size - Data Table on Global Telehandler Market 2020 - 2024 ($ million)

5.2 Application segment analysis 2020 - 2024

Historic Market Size - Application Segment 2020 - 2024 ($ million)

5.3 Type segment analysis 2020 - 2024

Historic Market Size - Type Segment 2020 - 2024 ($ million)

5.4 Capacity segment analysis 2020 - 2024

Historic Market Size - Capacity Segment 2020 - 2024 ($ million)

5.5 Geography segment analysis 2020 - 2024

Historic Market Size - Geography Segment 2020 - 2024 ($ million)

5.6 Country segment analysis 2020 - 2024

Historic Market Size - Country Segment 2020 - 2024 ($ million)

6. Qualitative Analysis

6.1 Impact of AI on global telehandler market

6.2 Impact of geopolitical conflicts on global telehandler market

7. Five Forces Analysis

7.1 Five forces summary

Five forces analysis - Comparison between 2025 and 2030

7.2 Bargaining power of buyers

Bargaining power of buyers - Impact of key factors 2025 and 2030

7.3 Bargaining power of suppliers

Bargaining power of suppliers - Impact of key factors in 2025 and 2030

7.4 Threat of new entrants

Threat of new entrants - Impact of key factors in 2025 and 2030

7.5 Threat of substitutes

Threat of substitutes - Impact of key factors in 2025 and 2030

7.6 Threat of rivalry

Threat of rivalry - Impact of key factors in 2025 and 2030

7.7 Market condition

Chart on Market condition - Five forces 2025 and 2030

8. Market Segmentation by Application

8.1 Market segments

Chart on Application - Market share 2025-2030 (%)
Data Table on Application - Market share 2025-2030 (%)

8.2 Comparison by Application

Chart on Comparison by Application
Data Table on Comparison by Application

8.3 Construction - Market size and forecast 2025-2030

Chart on Construction - Market size and forecast 2025-2030 ($ million)
Data Table on Construction - Market size and forecast 2025-2030 ($ million)
Chart on Construction - Year-over-year growth 2025-2030 (%)
Data Table on Construction - Year-over-year growth 2025-2030 (%)

8.4 Agriculture - Market size and forecast 2025-2030

Chart on Agriculture - Market size and forecast 2025-2030 ($ million)
Data Table on Agriculture - Market size and forecast 2025-2030 ($ million)
Chart on Agriculture - Year-over-year growth 2025-2030 (%)
Data Table on Agriculture - Year-over-year growth 2025-2030 (%)

8.5 Industrial - Market size and forecast 2025-2030

Chart on Industrial - Market size and forecast 2025-2030 ($ million)
Data Table on Industrial - Market size and forecast 2025-2030 ($ million)
Chart on Industrial - Year-over-year growth 2025-2030 (%)
Data Table on Industrial - Year-over-year growth 2025-2030 (%)

8.6 Others - Market size and forecast 2025-2030

Chart on Others - Market size and forecast 2025-2030 ($ million)
Data Table on Others - Market size and forecast 2025-2030 ($ million)
Chart on Others - Year-over-year growth 2025-2030 (%)
Data Table on Others - Year-over-year growth 2025-2030 (%)

8.7 Market opportunity by Application

Market opportunity by Application ($ million)
Data Table on Market opportunity by Application ($ million)

9. Market Segmentation by Type

9.1 Market segments

Chart on Type - Market share 2025-2030 (%)
Data Table on Type - Market share 2025-2030 (%)

9.2 Comparison by Type

Chart on Comparison by Type
Data Table on Comparison by Type

9.3 Compact telehandlers - Market size and forecast 2025-2030

Chart on Compact telehandlers - Market size and forecast 2025-2030 ($ million)
Data Table on Compact telehandlers - Market size and forecast 2025-2030 ($ million)
Chart on Compact telehandlers - Year-over-year growth 2025-2030 (%)
Data Table on Compact telehandlers - Year-over-year growth 2025-2030 (%)

9.4 High reach telehandlers - Market size and forecast 2025-2030

Chart on High reach telehandlers - Market size and forecast 2025-2030 ($ million)
Data Table on High reach telehandlers - Market size and forecast 2025-2030 ($ million)
Chart on High reach telehandlers - Year-over-year growth 2025-2030 (%)
Data Table on High reach telehandlers - Year-over-year growth 2025-2030 (%)

9.5 Heavy lift telehandlers - Market size and forecast 2025-2030

Chart on Heavy lift telehandlers - Market size and forecast 2025-2030 ($ million)
Data Table on Heavy lift telehandlers - Market size and forecast 2025-2030 ($ million)
Chart on Heavy lift telehandlers - Year-over-year growth 2025-2030 (%)
Data Table on Heavy lift telehandlers - Year-over-year growth 2025-2030 (%)

9.6 Market opportunity by Type

Market opportunity by Type ($ million)
Data Table on Market opportunity by Type ($ million)

10. Market Segmentation by Capacity

10.1 Market segments

Chart on Capacity - Market share 2025-2030 (%)
Data Table on Capacity - Market share 2025-2030 (%)

10.2 Comparison by Capacity

Chart on Comparison by Capacity
Data Table on Comparison by Capacity

10.3 Below 3 tons - Market size and forecast 2025-2030

Chart on Below 3 tons - Market size and forecast 2025-2030 ($ million)
Data Table on Below 3 tons - Market size and forecast 2025-2030 ($ million)
Chart on Below 3 tons - Year-over-year growth 2025-2030 (%)
Data Table on Below 3 tons - Year-over-year growth 2025-2030 (%)

10.4 3-6 tons - Market size and forecast 2025-2030

Chart on 3-6 tons - Market size and forecast 2025-2030 ($ million)
Data Table on 3-6 tons - Market size and forecast 2025-2030 ($ million)
Chart on 3-6 tons - Year-over-year growth 2025-2030 (%)
Data Table on 3-6 tons - Year-over-year growth 2025-2030 (%)

10.5 Above 6 tons - Market size and forecast 2025-2030

Chart on Above 6 tons - Market size and forecast 2025-2030 ($ million)
Data Table on Above 6 tons - Market size and forecast 2025-2030 ($ million)
Chart on Above 6 tons - Year-over-year growth 2025-2030 (%)
Data Table on Above 6 tons - Year-over-year growth 2025-2030 (%)

10.6 Market opportunity by Capacity

Market opportunity by Capacity ($ million)
Data Table on Market opportunity by Capacity ($ million)

11. Customer Landscape

11.1 Customer landscape overview

Analysis of price sensitivity, lifecycle, customer purchase basket, adoption rates, and purchase criteria

12. Geographic Landscape

12.1 Geographic segmentation

Chart on Market share by geography 2025-2030 (%)
Data Table on Market share by geography 2025-2030 (%)

12.2 Geographic comparison

Chart on Geographic comparison
Data Table on Geographic comparison

12.3 APAC - Market size and forecast 2025-2030

Chart on APAC - Market size and forecast 2025-2030 ($ million)
Data Table on APAC - Market size and forecast 2025-2030 ($ million)
Chart on APAC - Year-over-year growth 2025-2030 (%)
Data Table on APAC - Year-over-year growth 2025-2030 (%)
Chart on Regional Comparison - APAC
Data Table on Regional Comparison - APAC

12.3.1 China - Market size and forecast 2025-2030

Chart on China - Market size and forecast 2025-2030 ($ million)
Data Table on China - Market size and forecast 2025-2030 ($ million)
Chart on China - Year-over-year growth 2025-2030 (%)
Data Table on China - Year-over-year growth 2025-2030 (%)

12.3.2 Japan - Market size and forecast 2025-2030

Chart on Japan - Market size and forecast 2025-2030 ($ million)
Data Table on Japan - Market size and forecast 2025-2030 ($ million)
Chart on Japan - Year-over-year growth 2025-2030 (%)
Data Table on Japan - Year-over-year growth 2025-2030 (%)

12.3.3 India - Market size and forecast 2025-2030

Chart on India - Market size and forecast 2025-2030 ($ million)
Data Table on India - Market size and forecast 2025-2030 ($ million)
Chart on India - Year-over-year growth 2025-2030 (%)
Data Table on India - Year-over-year growth 2025-2030 (%)

12.3.4 South Korea - Market size and forecast 2025-2030

Chart on South Korea - Market size and forecast 2025-2030 ($ million)
Data Table on South Korea - Market size and forecast 2025-2030 ($ million)
Chart on South Korea - Year-over-year growth 2025-2030 (%)
Data Table on South Korea - Year-over-year growth 2025-2030 (%)

12.3.5 Australia - Market size and forecast 2025-2030

Chart on Australia - Market size and forecast 2025-2030 ($ million)
Data Table on Australia - Market size and forecast 2025-2030 ($ million)
Chart on Australia - Year-over-year growth 2025-2030 (%)
Data Table on Australia - Year-over-year growth 2025-2030 (%)

12.3.6 Singapore - Market size and forecast 2025-2030

Chart on Singapore - Market size and forecast 2025-2030 ($ million)
Data Table on Singapore - Market size and forecast 2025-2030 ($ million)
Chart on Singapore - Year-over-year growth 2025-2030 (%)
Data Table on Singapore - Year-over-year growth 2025-2030 (%)

12.4 North America - Market size and forecast 2025-2030

Chart on North America - Market size and forecast 2025-2030 ($ million)
Data Table on North America - Market size and forecast 2025-2030 ($ million)
Chart on North America - Year-over-year growth 2025-2030 (%)
Data Table on North America - Year-over-year growth 2025-2030 (%)
Chart on Regional Comparison - North America
Data Table on Regional Comparison - North America

12.4.1 US - Market size and forecast 2025-2030

Chart on US - Market size and forecast 2025-2030 ($ million)
Data Table on US - Market size and forecast 2025-2030 ($ million)
Chart on US - Year-over-year growth 2025-2030 (%)
Data Table on US - Year-over-year growth 2025-2030 (%)

12.4.2 Canada - Market size and forecast 2025-2030

Chart on Canada - Market size and forecast 2025-2030 ($ million)
Data Table on Canada - Market size and forecast 2025-2030 ($ million)
Chart on Canada - Year-over-year growth 2025-2030 (%)
Data Table on Canada - Year-over-year growth 2025-2030 (%)

12.4.3 Mexico - Market size and forecast 2025-2030

Chart on Mexico - Market size and forecast 2025-2030 ($ million)
Data Table on Mexico - Market size and forecast 2025-2030 ($ million)
Chart on Mexico - Year-over-year growth 2025-2030 (%)
Data Table on Mexico - Year-over-year growth 2025-2030 (%)

12.5 Europe - Market size and forecast 2025-2030

Chart on Europe - Market size and forecast 2025-2030 ($ million)
Data Table on Europe - Market size and forecast 2025-2030 ($ million)
Chart on Europe - Year-over-year growth 2025-2030 (%)
Data Table on Europe - Year-over-year growth 2025-2030 (%)
Chart on Regional Comparison - Europe
Data Table on Regional Comparison - Europe

12.5.1 Germany - Market size and forecast 2025-2030

Chart on Germany - Market size and forecast 2025-2030 ($ million)
Data Table on Germany - Market size and forecast 2025-2030 ($ million)
Chart on Germany - Year-over-year growth 2025-2030 (%)
Data Table on Germany - Year-over-year growth 2025-2030 (%)

12.5.2 UK - Market size and forecast 2025-2030

Chart on UK - Market size and forecast 2025-2030 ($ million)
Data Table on UK - Market size and forecast 2025-2030 ($ million)
Chart on UK - Year-over-year growth 2025-2030 (%)
Data Table on UK - Year-over-year growth 2025-2030 (%)

12.5.3 France - Market size and forecast 2025-2030

Chart on France - Market size and forecast 2025-2030 ($ million)
Data Table on France - Market size and forecast 2025-2030 ($ million)
Chart on France - Year-over-year growth 2025-2030 (%)
Data Table on France - Year-over-year growth 2025-2030 (%)

12.5.4 Italy - Market size and forecast 2025-2030

Chart on Italy - Market size and forecast 2025-2030 ($ million)
Data Table on Italy - Market size and forecast 2025-2030 ($ million)
Chart on Italy - Year-over-year growth 2025-2030 (%)
Data Table on Italy - Year-over-year growth 2025-2030 (%)

12.5.5 Russia - Market size and forecast 2025-2030

Chart on Russia - Market size and forecast 2025-2030 ($ million)
Data Table on Russia - Market size and forecast 2025-2030 ($ million)
Chart on Russia - Year-over-year growth 2025-2030 (%)
Data Table on Russia - Year-over-year growth 2025-2030 (%)

12.5.6 Spain - Market size and forecast 2025-2030

Chart on Spain - Market size and forecast 2025-2030 ($ million)
Data Table on Spain - Market size and forecast 2025-2030 ($ million)
Chart on Spain - Year-over-year growth 2025-2030 (%)
Data Table on Spain - Year-over-year growth 2025-2030 (%)

12.6 South America - Market size and forecast 2025-2030

Chart on South America - Market size and forecast 2025-2030 ($ million)
Data Table on South America - Market size and forecast 2025-2030 ($ million)
Chart on South America - Year-over-year growth 2025-2030 (%)
Data Table on South America - Year-over-year growth 2025-2030 (%)
Chart on Regional Comparison - South America
Data Table on Regional Comparison - South America

12.6.1 Brazil - Market size and forecast 2025-2030

Chart on Brazil - Market size and forecast 2025-2030 ($ million)
Data Table on Brazil - Market size and forecast 2025-2030 ($ million)
Chart on Brazil - Year-over-year growth 2025-2030 (%)
Data Table on Brazil - Year-over-year growth 2025-2030 (%)

12.6.2 Argentina - Market size and forecast 2025-2030

Chart on Argentina - Market size and forecast 2025-2030 ($ million)
Data Table on Argentina - Market size and forecast 2025-2030 ($ million)
Chart on Argentina - Year-over-year growth 2025-2030 (%)
Data Table on Argentina - Year-over-year growth 2025-2030 (%)

12.6.3 Colombia - Market size and forecast 2025-2030

Chart on Colombia - Market size and forecast 2025-2030 ($ million)
Data Table on Colombia - Market size and forecast 2025-2030 ($ million)
Chart on Colombia - Year-over-year growth 2025-2030 (%)
Data Table on Colombia - Year-over-year growth 2025-2030 (%)

12.7 Middle East and Africa - Market size and forecast 2025-2030

Chart on Middle East and Africa - Market size and forecast 2025-2030 ($ million)
Data Table on Middle East and Africa - Market size and forecast 2025-2030 ($ million)
Chart on Middle East and Africa - Year-over-year growth 2025-2030 (%)
Data Table on Middle East and Africa - Year-over-year growth 2025-2030 (%)
Chart on Regional Comparison - Middle East and Africa
Data Table on Regional Comparison - Middle East and Africa

12.7.1 Saudi Arabia - Market size and forecast 2025-2030

Chart on Saudi Arabia - Market size and forecast 2025-2030 ($ million)
Data Table on Saudi Arabia - Market size and forecast 2025-2030 ($ million)
Chart on Saudi Arabia - Year-over-year growth 2025-2030 (%)
Data Table on Saudi Arabia - Year-over-year growth 2025-2030 (%)

12.7.2 UAE - Market size and forecast 2025-2030

Chart on UAE - Market size and forecast 2025-2030 ($ million)
Data Table on UAE - Market size and forecast 2025-2030 ($ million)
Chart on UAE - Year-over-year growth 2025-2030 (%)
Data Table on UAE - Year-over-year growth 2025-2030 (%)

12.7.3 Turkey - Market size and forecast 2025-2030

Chart on Turkey - Market size and forecast 2025-2030 ($ million)
Data Table on Turkey - Market size and forecast 2025-2030 ($ million)
Chart on Turkey - Year-over-year growth 2025-2030 (%)
Data Table on Turkey - Year-over-year growth 2025-2030 (%)

12.7.4 Egypt - Market size and forecast 2025-2030

Chart on Egypt - Market size and forecast 2025-2030 ($ million)
Data Table on Egypt - Market size and forecast 2025-2030 ($ million)
Chart on Egypt - Year-over-year growth 2025-2030 (%)
Data Table on Egypt - Year-over-year growth 2025-2030 (%)

12.7.5 Qatar - Market size and forecast 2025-2030

Chart on Qatar - Market size and forecast 2025-2030 ($ million)
Data Table on Qatar - Market size and forecast 2025-2030 ($ million)
Chart on Qatar - Year-over-year growth 2025-2030 (%)
Data Table on Qatar - Year-over-year growth 2025-2030 (%)

12.8 Market opportunity by geography

Market opportunity by geography ($ million)
Data Tables on Market opportunity by geography ($ million)

13. Drivers, Challenges, and Opportunity

13.1 Market drivers

Escalating investments and urbanization initiatives
Rising mechanization and material handling efficiency in agricultural sector
Technological advancements, electrification, and regulatory compliance mandates

13.2 Market challenges

Capital escalation and margin compression in premium machine engineering
Systemic technical skills deficit and heightened workplace operational vulnerabilities
Infrastructure deficiencies and field performance constraints of next-generation drivetrains

13.3 Impact of drivers and challenges

Impact of drivers and challenges in 2025 and 2030

13.4 Market opportunities

Expanding adoption of equipment rental models across regional frontiers
Proliferation of specialized high-capacity and rotating equipment configurations
Integration of sophisticated fleet telematics and real-time asset utilization software

14. Competitive Landscape

14.1 Overview

14.2

Overview on criticality of inputs and factors of differentiation

14.3 Landscape disruption

Overview on factors of disruption

14.4 Industry risks

Impact of key risks on business

15. Competitive Analysis

15.1 Companies profiled

Companies covered

15.2 Company ranking index

15.3 Market positioning of companies

Matrix on companies position and classification

15.4 Bobcat Co.

Bobcat Co. - Overview
Bobcat Co. - Product / Service
Bobcat Co. - Key offerings
SWOT

15.5 CASE Construction

CASE Construction - Overview
CASE Construction - Product / Service
CASE Construction - Key offerings
SWOT

15.6 Caterpillar Inc.

Caterpillar Inc. - Overview
Caterpillar Inc. - Business segments
Caterpillar Inc. - Key news
Caterpillar Inc. - Key offerings
Caterpillar Inc. - Segment focus
SWOT

15.7 Deere and Co.

Deere and Co. - Overview
Deere and Co. - Business segments
Deere and Co. - Key offerings
Deere and Co. - Segment focus
SWOT

15.8 Dieci Srl

Dieci Srl - Overview
Dieci Srl - Product / Service
Dieci Srl - Key offerings
SWOT

15.9 Gehl

Gehl - Overview
Gehl - Product / Service
Gehl - Key offerings
SWOT

15.10 Genie

Genie - Overview
Genie - Business segments
Genie - Key offerings
Genie - Segment focus
SWOT

15.11 Haulotte Group

Haulotte Group - Overview
Haulotte Group - Business segments
Haulotte Group - Key offerings
Haulotte Group - Segment focus
SWOT

15.12 J C Bamford Excavators Ltd.

J C Bamford Excavators Ltd. - Overview
J C Bamford Excavators Ltd. - Product / Service
J C Bamford Excavators Ltd. - Key offerings
SWOT

15.13 JLG Industries Inc.

JLG Industries Inc. - Overview
JLG Industries Inc. - Product / Service
JLG Industries Inc. - Key offerings
SWOT

15.14 Manitou BF SA

Manitou BF SA - Overview
Manitou BF SA - Product / Service
Manitou BF SA - Key offerings
SWOT

15.15 Merlo Spa

Merlo Spa - Overview
Merlo Spa - Product / Service
Merlo Spa - Key offerings
SWOT

15.16 Sany Heavy Industry Co. Ltd.

Sany Heavy Industry Co. Ltd. - Overview
Sany Heavy Industry Co. Ltd. - Business segments
Sany Heavy Industry Co. Ltd. - Key offerings
Sany Heavy Industry Co. Ltd. - Segment focus
SWOT

15.17 Skyjack Inc.

Skyjack Inc. - Overview
Skyjack Inc. - Product / Service
Skyjack Inc. - Key offerings
SWOT

15.18 Weidemann GmbH

Weidemann GmbH - Overview
Weidemann GmbH - Product / Service
Weidemann GmbH - Key offerings
SWOT

16. Appendix

16.1 Scope of the report

Market definition
Objectives
Notes and caveats

16.2 Inclusions and exclusions checklist

Inclusions checklist
Exclusions checklist

16.3 Currency conversion rates for US$

16.4 Research methodology

16.5 Data procurement

Information sources

16.6 Data validation

16.7 Validation techniques employed for market sizing

16.8 Data synthesis

16.9 360 degree market analysis

16.10 List of abbreviations

Research Methodology

Technavio presents a detailed picture of the market by way of study, synthesis, and summation of data from multiple sources. The analysts have presented the various facets of the market with a particular focus on identifying the key industry influencers. The data thus presented is comprehensive, reliable, and the result of extensive research, both primary and secondary.

INFORMATION SOURCES

Primary sources

  • Manufacturers and suppliers
  • Channel partners
  • Industry experts
  • Strategic decision makers

Secondary sources

  • Industry journals and periodicals
  • Government data
  • Financial reports of key industry players
  • Historical data
  • Press releases

DATA ANALYSIS

Data Synthesis

  • Collation of data
  • Estimation of key figures
  • Analysis of derived insights

Data Validation

  • Triangulation with data models
  • Reference against proprietary databases
  • Corroboration with industry experts

REPORT WRITING

Qualitative

  • Market drivers
  • Market challenges
  • Market trends
  • Five forces analysis

Quantitative

  • Market size and forecast
  • Market segmentation
  • Geographical insights
  • Competitive landscape

Interested in this report?

Get your sample now to see our research methodology and insights!

Download Now

Frequently Asked Questions

Telehandler market growth will increase by USD 2640.2 million during 2026-2030.

The Telehandler market is expected to grow at a CAGR of 5.5% during 2026-2030.

Telehandler market is segmented by Application (Construction, Agriculture, Industrial, Others) Type (Compact telehandlers, High reach telehandlers, Heavy lift telehandlers) Capacity (Below 3 tons, 3-6 tons, Above 6 tons)

Bobcat Co., CASE Construction, Caterpillar Inc., Deere and Co., Dieci Srl, Faresin Industries Spa, Gehl, Genie, Haulotte Group, J C Bamford Excavators Ltd., JLG Industries Inc., Kramer Werke GmbH, Liebherr International AG, Magni Telescopic Handlers Srl, Manitou BF SA, Merlo Spa, Sany Heavy Industry Co. Ltd., Skyjack Inc., Weidemann GmbH, Xtreme Manufacturing are a few of the key vendors in the Telehandler market.

APAC will register the highest growth rate of 42.1% among the other regions. Therefore, the Telehandler market in APAC is expected to garner significant business opportunities for the vendors during the forecast period.

China, Japan, India, South Korea, Australia, Singapore, US, Canada, Mexico, Germany, UK, France, Italy, Russia, Spain, Brazil, Argentina, Colombia, Saudi Arabia, UAE, Turkey, Egypt, Qatar

  • Escalating investments and urbanization initiatives is the driving factor this market.

The Telehandler market vendors should focus on grabbing business opportunities from the Application segment as it accounted for the largest market share in the base year.
RIA - Research AI Assistant
Ask RIA