Temperature Control Rental Market Analysis, Size, and Forecast 2026-2030: APAC (China, India, and Japan), North America (US, Canada, and Mexico), Europe (Germany, UK, and France), Middle East and Africa (Saudi Arabia, UAE, and South Africa), South America (Brazil, Argentina, and Colombia), and Rest of World (ROW)

Temperature Control Rental Market Analysis, Size, and Forecast 2026-2030:
APAC (China, India, and Japan), North America (US, Canada, and Mexico), Europe (Germany, UK, and France), Middle East and Africa (Saudi Arabia, UAE, and South Africa), South America (Brazil, Argentina, and Colombia), and Rest of World (ROW)

Published: Mar 2026 315 Pages SKU: IRTNTR81351

Market Overview at a Glance

$2.30 B
Market Opportunity
7.3%
CAGR 2025 - 2030
42.1%
APAC Growth
$1.77 B
Chillers segment 2024

Temperature Control Rental Market Size 2026-2030

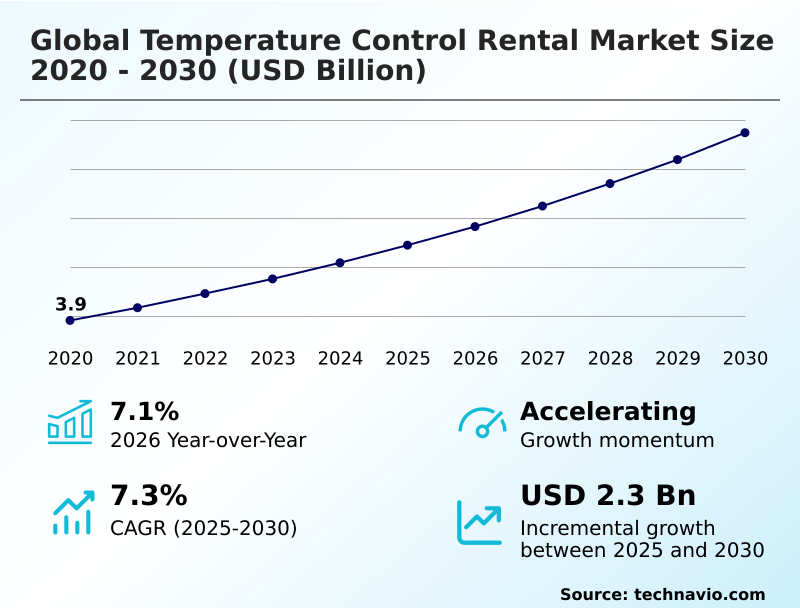
The temperature control rental market size is valued to increase by USD 2.30 billion, at a CAGR of 7.3% from 2025 to 2030. Increasing focus on environmental sustainability will drive the temperature control rental market.

Major Market Trends & Insights

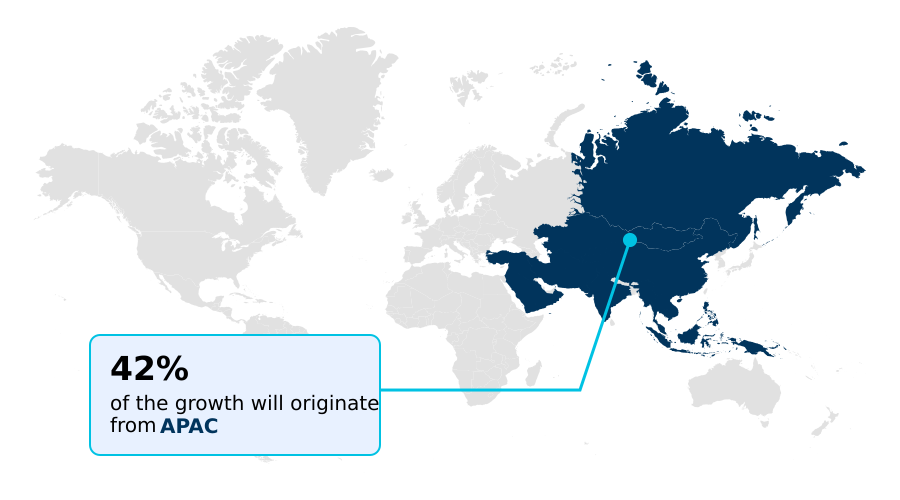
  • APAC dominated the market and accounted for a 42.1% growth during the forecast period.
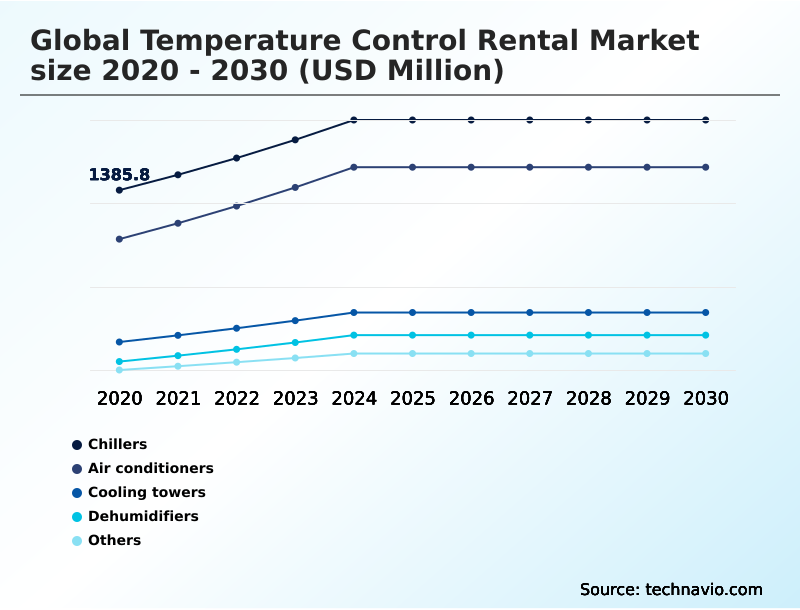
  • By Type - Chillers segment was valued at USD 1.77 billion in 2024
  • By End-user - Industrial segment accounted for the largest market revenue share in 2024

Market Size & Forecast

  • Market Opportunities: USD 3.83 billion
  • Market Future Opportunities: USD 2.30 billion
  • CAGR from 2025 to 2030 : 7.3%

Market Summary

  • The temperature control rental market is expanding as industries prioritize operational agility and financial efficiency. This growth is propelled by a strategic shift from equipment ownership to rental models, which converts capital expenditures into manageable operating expenses. This flexibility is crucial in sectors with seasonal demand peaks or for projects requiring specialized thermal management solutions.
  • For instance, a pharmaceutical manufacturer can rapidly scale its cold-chain storage capabilities for a new drug launch by leasing certified cleanroom temperature control units, avoiding procurement delays and ensuring regulatory compliance for refrigerants. The market also provides essential disaster recovery support, offering emergency climate stabilization during equipment failures or extreme weather.
  • Technological advancements are central to this evolution, with remote monitoring telematics and predictive maintenance models becoming standard. These innovations optimize energy consumption monitoring and reduce downtime, aligning with corporate net-zero carbon objectives and enhancing overall operational resilience for stakeholders.

What will be the Size of the Temperature Control Rental Market during the forecast period?

Get Key Insights on Market Forecast (PDF) Request Free Sample

How is the Temperature Control Rental Market Segmented?

The temperature control rental industry research report provides comprehensive data (region-wise segment analysis), with forecasts and estimates in "USD million" for the period 2026-2030, as well as historical data from 2020-2024 for the following segments.

  • Type
    • Chillers
    • Air conditioners
    • Cooling towers
    • Dehumidifiers
    • Others
  • End-user
    • Industrial
    • Commercial
    • Residential
  • Application
    • Oil and gas
    • Manufacturing
    • Construction
    • Petrochemical and refining
    • Others
  • Geography
    • APAC
      • China
      • India
      • Japan
    • North America
      • US
      • Canada
      • Mexico
    • Europe
      • Germany
      • UK
      • France
    • Middle East and Africa
      • Saudi Arabia
      • UAE
      • South Africa
    • South America
      • Brazil
      • Argentina
      • Colombia
    • Rest of World (ROW)

By Type Insights

The chillers segment is estimated to witness significant growth during the forecast period.

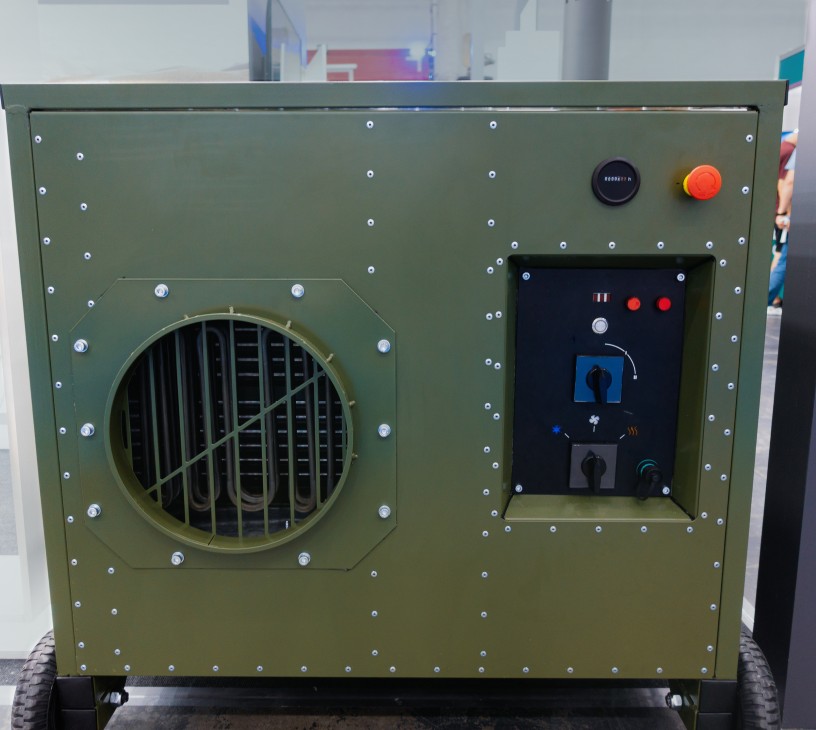
The industrial chillers segment is foundational to the temperature control rental market, providing critical cooling for applications ranging from process cooling to the specific pharmaceutical manufacturing climate.

Available as both air-cooled chillers and water-cooled chillers, these systems support industrial refrigeration and are essential for contingency planning during planned maintenance shutdowns. Rental models facilitate capital expenditure avoidance and offer turnkey modular packages for rapid deployment.

The use of advanced variable speed drives in modern rental units enhances thermal management solutions, improving energy efficiency by up to 25% under partial load conditions.

This is vital for managing peak load management in data center commissioning and other high-demand environments.

Request Free Sample

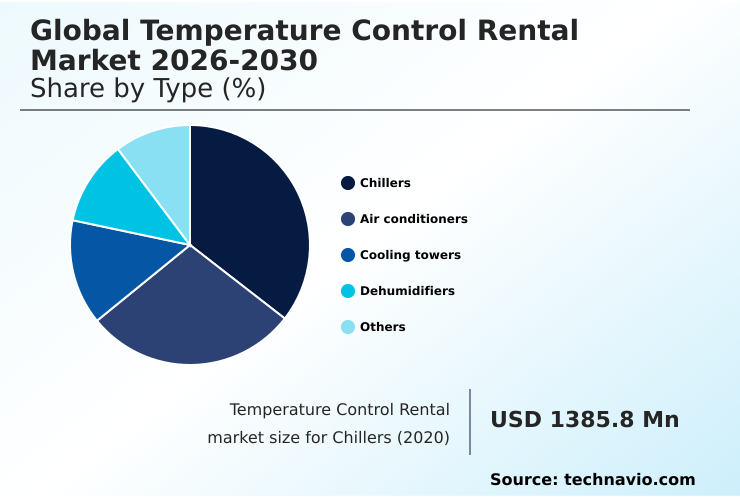
The Chillers segment was valued at USD 1.77 billion in 2024 and showed a gradual increase during the forecast period.

Request Free Sample

Regional Analysis

APAC is estimated to contribute 42.1% to the growth of the global market during the forecast period.Technavio’s analysts have elaborately explained the regional trends and drivers that shape the market during the forecast period.

See How Temperature Control Rental Market Demand is Rising in APAC Request Free Sample

The temperature control rental market's geographic landscape is led by APAC, which accounts for 42.1% of the incremental growth, driven by rapid industrialization. North America follows, with significant demand from its mature industrial base.

In APAC, the need for high-density computing cooling and hyperscale data center cooling is surging. In contrast, regions with extensive mining rely on solutions for geothermal heat management and deep underground mine ventilation.

The European market emphasizes sustainability, requiring rental fleets to support power generation facility cooling with low-emission equipment.

Across all regions, from sub-zero environments to deserts, the need for precise process cooling, cleanroom temperature control, and emergency climate stabilization underpins market demand, with solutions ranging from evaporative cooling and heat rejection systems to specialized cooling towers.

Market Dynamics

Our researchers analyzed the data with 2025 as the base year, along with the key drivers, trends, and challenges. A holistic analysis of drivers will help companies refine their marketing strategies to gain a competitive advantage.

  • Strategic deployment of rental temperature control solutions is critical across specialized industrial verticals. For mission-critical facilities, industrial chiller rental for data centers ensures uptime, while spot cooler rental for server rooms offers targeted, supplemental cooling.
  • The manufacturing sector leverages process cooling rental for manufacturing plants to maintain quality control, with heat exchanger rental for chemical processing providing necessary thermal regulation for volatile reactions. The construction industry depends on heater rental for winter construction projects and dehumidifier rental for construction drying to meet project timelines, with some projects seeing a 30% reduction in drying times.
  • In the energy sector, cooling tower rental for refinery turnarounds is essential for minimizing downtime during planned maintenance, while rental heating for oil and gas sites ensures operational safety. Healthcare and technology sectors rely on temporary cooling for pharmaceutical manufacturing and cleanroom hvac rental for biotechnology to adhere to strict environmental standards.
  • Furthermore, hvac rental solutions for commercial buildings and air handler rental for temporary structures are standard for managing climate in non-permanent spaces. For emergencies, temporary climate control for disaster relief and emergency boiler rental for facility backup provide essential resilience.

What are the key market drivers leading to the rise in the adoption of Temperature Control Rental Industry?

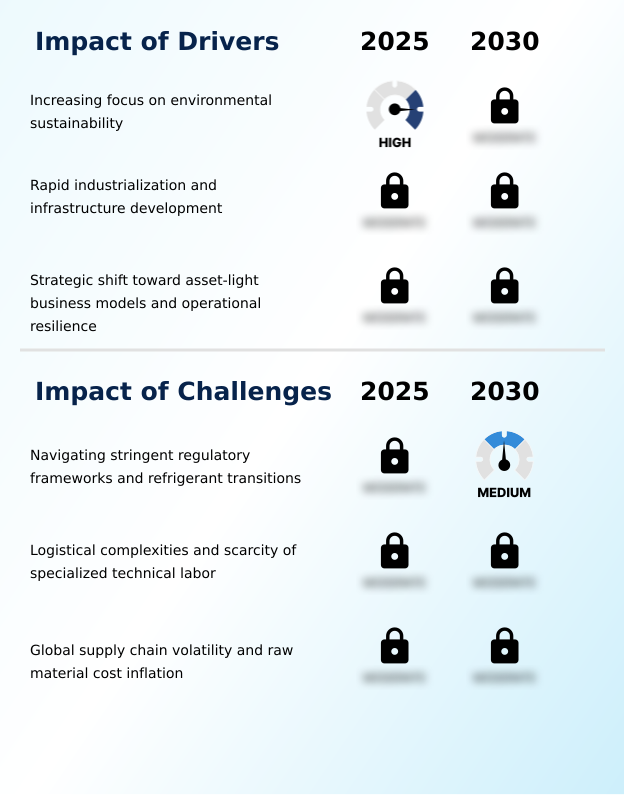
  • An increasing focus on environmental sustainability, driven by tightening regulatory frameworks and corporate carbon reduction goals, is a primary driver of market growth.

  • Market growth is significantly propelled by the corporate adoption of asset-light business models, which prioritize financial agility. By choosing temporary HVAC solutions over direct purchase, companies can convert large capital costs into predictable operating expenses, preserving liquidity for core investments.
  • This strategy, coupled with a focus on industrial decarbonization, drives demand for modern rental fleets featuring electric-driven chillers, hybrid cooling systems, and low-GWP refrigerants like hydrofluoroolefins. Such equipment helps clients meet regulatory compliance for refrigerants while advancing circular energy models.
  • The flexibility of rental supports diverse needs, from event climate control to remote site operations requiring temporary power integration.
  • Access to specialized equipment like high-capacity boilers and modular heat exchangers on demand enhances operational efficiency, with some projects achieving deployment schedules 40% faster than with permanent installations.

What are the market trends shaping the Temperature Control Rental Industry?

  • The integration of advanced telematics and real-time remote monitoring systems represents a key technological evolution in the market, enhancing operational efficiency and enabling predictive maintenance.

  • The market is advancing through the deep integration of technology to enhance operational resilience. The use of remote monitoring telematics is becoming standard, enabling predictive maintenance models that reduce unplanned downtime by over 25%. This capability for energy consumption monitoring allows firms to better manage seasonal demand fluctuations and align with net-zero carbon objectives.
  • For disaster recovery support, rental companies now offer supplemental cooling and heating solutions, including spot coolers, packaged terminal air conditioners, and hydronic heating systems that can be deployed rapidly. The availability of high-precision air handling equipment for applications like construction drying ensures that environmental parameters are strictly controlled, improving project outcomes by as much as 15%.
  • This shift toward data-driven, responsive climate control underscores the market's evolution.

What challenges does the Temperature Control Rental Industry face during its growth?

  • Navigating stringent regulatory frameworks, particularly those governing refrigerant transitions and emissions, presents a key challenge to operational and financial planning within the industry.

  • Navigating operational hurdles remains a primary focus for the market, with supply chain volatility mitigation being a key concern. Delays in acquiring specialized components can increase project lead times by up to 20%. The scarcity of specialized technical labor further complicates logistics, particularly for turnaround cooling support and offshore drilling climate control.
  • These roles require expertise in handling explosion-proof equipment and managing high-ambient temperature operation. Ensuring effective moisture control and corrosion control in harsh environments demands robust solutions like desiccant dehumidifiers and specialized liquid-to-air heat exchangers.
  • Moreover, maintaining a modern fleet of air handling units, portable air conditioners, and equipment for cold-chain storage in the face of fluctuating material costs presents a continuous challenge for maintaining competitive pricing and service quality.

Exclusive Technavio Analysis on Customer Landscape

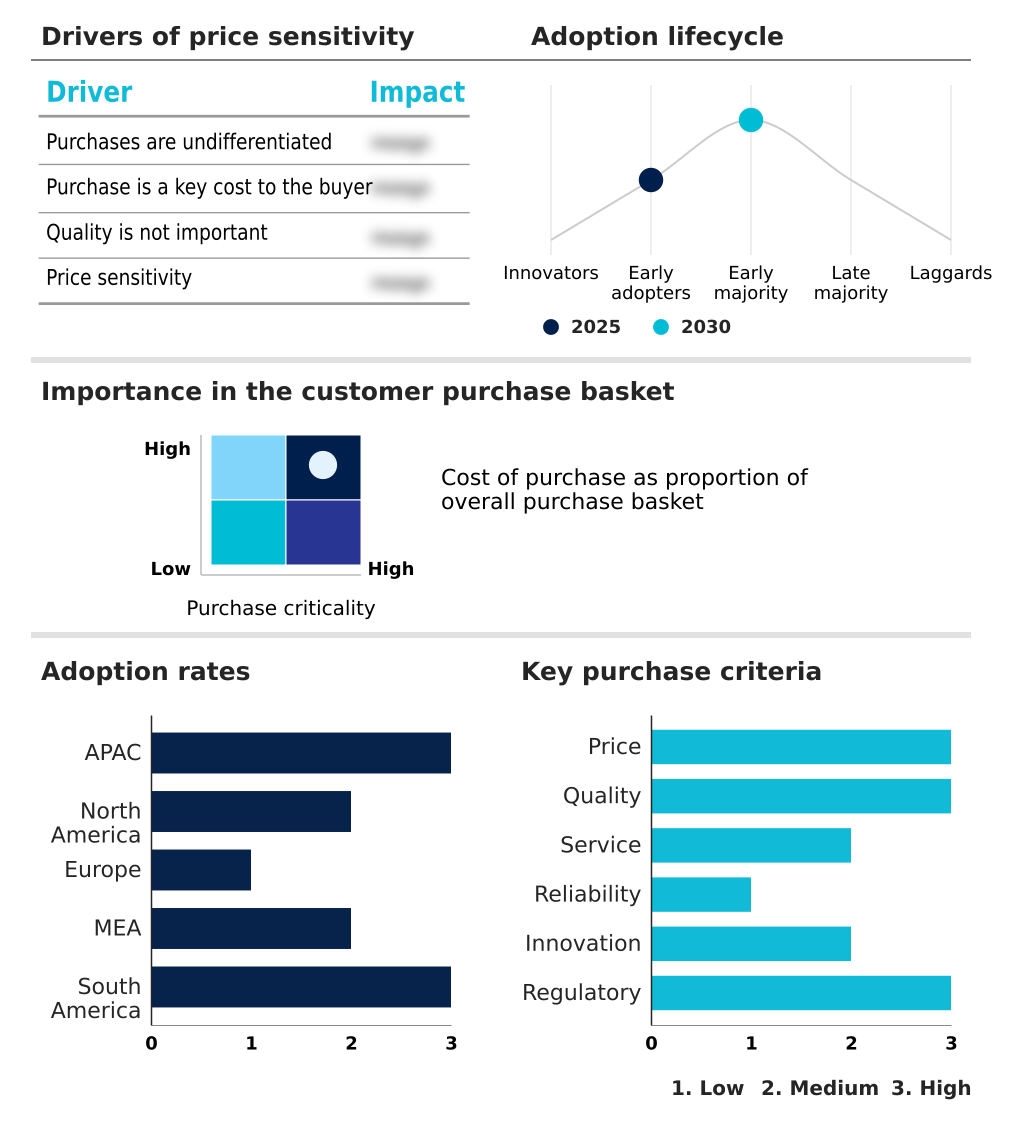
The temperature control rental market forecasting report includes the adoption lifecycle of the market, covering from the innovator’s stage to the laggard’s stage. It focuses on adoption rates in different regions based on penetration. Furthermore, the temperature control rental market report also includes key purchase criteria and drivers of price sensitivity to help companies evaluate and develop their market growth analysis strategies.

Customer Landscape of Temperature Control Rental Industry

Competitive Landscape

Companies are implementing various strategies, such as strategic alliances, temperature control rental market forecast, partnerships, mergers and acquisitions, geographical expansion, and product/service launches, to enhance their presence in the industry.

Aggreko Plc - Provides a comprehensive temperature control rental fleet, offering scalable solutions for process cooling, data centers, events, and emergency response, including industrial chillers and temporary HVAC.

The industry research and growth report includes detailed analyses of the competitive landscape of the market and information about key companies, including:

  • Aggreko Plc
  • Andrews Sykes Group PLC.
  • Boels Rental.
  • Byrne Equipment Rental
  • Carrier Global Corp.
  • Cat Rentals
  • Cool Air Rentals Ltd.
  • Emerson Electric Co.
  • HERC HOLDINGS INC.
  • Honeywell International Inc.
  • Johnson Controls International
  • Kiloutou
  • LOXAM GROUP.
  • Modulaire Group
  • Polygon International AB
  • Rankin Climate LLC.
  • Sunbelt Rentals Inc.
  • Trane Technologies plc
  • United Rentals Inc.
  • WillScot Holdings Corp.

Qualitative and quantitative analysis of companies has been conducted to help clients understand the wider business environment as well as the strengths and weaknesses of key industry players. Data is qualitatively analyzed to categorize companies as pure play, category-focused, industry-focused, and diversified; it is quantitatively analyzed to categorize companies as dominant, leading, strong, tentative, and weak.

Recent Development and News in Temperature control rental market

  • In August 2025, Aggreko deployed a large-scale hybrid cooling system in South America, combining solar arrays and battery storage to power industrial temperature control units at a remote mining site.
  • In October 2025, Trane introduced a new series of modular rental chillers in Europe optimized for cooling high-density AI server racks that generate significant thermal loads.
  • In July 2025, the Environmental Protection Agency in the US implemented new mandates to phase out specific HFCs in portable cooling units, compelling rental providers to accelerate fleet replacement.
  • In May 2025, United Rentals announced a major strategic investment to add advanced electric industrial heat pumps to its rental portfolio, targeting industrial clients with stringent carbon emission caps.

Dive into Technavio’s robust research methodology, blending expert interviews, extensive data synthesis, and validated models for unparalleled Temperature Control Rental Market insights. See full methodology.

Market Scope
Page number 315
Base year 2025
Historic period 2020-2024
Forecast period 2026-2030
Growth momentum & CAGR Accelerate at a CAGR of 7.3%
Market growth 2026-2030 USD 2300.1 million
Market structure Fragmented
YoY growth 2025-2026(%) 7.1%
Key countries China, India, Japan, South Korea, Australia, Indonesia, US, Canada, Mexico, Germany, UK, France, Italy, The Netherlands, Spain, Saudi Arabia, UAE, South Africa, Israel, Turkey, Brazil, Argentina and Colombia
Competitive landscape Leading Companies, Market Positioning of Companies, Competitive Strategies, and Industry Risks

Request Free Sample

Research Analyst Overview

  • The temperature control rental market is defined by its critical role in maintaining operational continuity across diverse industrial sectors. The deployment of turnkey modular packages, including industrial chillers and high-capacity boilers, allows businesses to adapt to fluctuating thermal demands without significant capital investment.
  • A core market dynamic is the move toward advanced thermal management solutions that integrate technologies like variable speed drives and modular heat exchangers. For instance, businesses using predictive maintenance models on rental equipment have reported up to a 20% reduction in unexpected failures.
  • This shift impacts boardroom decisions, tying operational strategy directly to sustainability goals through the adoption of electric-driven chillers and hybrid cooling systems. The market addresses needs from basic spot coolers and portable air conditioners to complex industrial refrigeration for cold-chain storage.
  • Equipment such as desiccant dehumidifiers, indirect-fired heaters, and air handlers ensures precise environmental control, supporting everything from routine process cooling to emergency climate stabilization in sub-zero environments.

What are the Key Data Covered in this Temperature Control Rental Market Research and Growth Report?

  • What is the expected growth of the Temperature Control Rental Market between 2026 and 2030?

    • USD 2.30 billion, at a CAGR of 7.3%

  • What segmentation does the market report cover?

    • The report is segmented by Type (Chillers, Air conditioners, Cooling towers, Dehumidifiers, and Others), End-user (Industrial, Commercial, and Residential), Application (Oil and gas, Manufacturing, Construction, Petrochemical and refining, and Others) and Geography (APAC, North America, Europe, Middle East and Africa, South America)

  • Which regions are analyzed in the report?

    • APAC, North America, Europe, Middle East and Africa and South America

  • What are the key growth drivers and market challenges?

    • Increasing focus on environmental sustainability, Navigating stringent regulatory frameworks and refrigerant transitions

  • Who are the major players in the Temperature Control Rental Market?

    • Aggreko Plc, Andrews Sykes Group PLC., Boels Rental., Byrne Equipment Rental, Carrier Global Corp., Cat Rentals, Cool Air Rentals Ltd., Emerson Electric Co., HERC HOLDINGS INC., Honeywell International Inc., Johnson Controls International, Kiloutou, LOXAM GROUP., Modulaire Group, Polygon International AB, Rankin Climate LLC., Sunbelt Rentals Inc., Trane Technologies plc, United Rentals Inc. and WillScot Holdings Corp.

Market Research Insights

  • The temperature control rental market is defined by a strategic shift toward asset-light business models that enhance operational resilience. This approach allows companies to avoid significant capital expenditure, with some firms reducing upfront equipment investment by over 90% compared to direct purchasing. Adopting rental solutions for planned maintenance shutdowns also improves operational continuity, minimizing downtime by an average of 15%.
  • Furthermore, leveraging rental fleets for disaster recovery support provides critical contingency planning capabilities. The model's flexibility is essential for managing seasonal demand fluctuations and supporting temporary power integration for remote site operations. As industries focus on operating expense management, the rental market offers a financially agile and resilient alternative to equipment ownership.

We can help! Our analysts can customize this temperature control rental market research report to meet your requirements.

Get in touch

1. Executive Summary

1.1 Market overview

Executive Summary - Chart on Market Overview
Executive Summary - Data Table on Market Overview
Executive Summary - Chart on Global Market Characteristics
Executive Summary - Chart on Market by Geography
Executive Summary - Chart on Market Segmentation by Type
Executive Summary - Chart on Market Segmentation by End-user
Executive Summary - Chart on Market Segmentation by Application
Executive Summary - Chart on Incremental Growth
Executive Summary - Data Table on Incremental Growth
Executive Summary - Chart on Company Market Positioning

2. Technavio Analysis

2.1 Analysis of price sensitivity, lifecycle, customer purchase basket, adoption rates, and purchase criteria

2.2 Criticality of inputs and Factors of differentiation

Chart on Overview on criticality of inputs and factors of differentiation

2.3 Factors of disruption

Chart on Overview on factors of disruption

2.4 Impact of drivers and challenges

Chart on Impact of drivers and challenges in 2025 and 2030

3. Market Landscape

3.1 Market ecosystem

Chart on Parent Market
Data Table on - Parent Market

3.2 Market characteristics

Chart on Market characteristics analysis

3.3 Value chain analysis

Chart on Value chain analysis

4. Market Sizing

4.1 Market definition

Data Table on Offerings of companies included in the market definition

4.2 Market segment analysis

Market segments

4.3 Market size 2025

4.4 Market outlook: Forecast for 2025-2030

Chart on Global - Market size and forecast 2025-2030 ($ million)
Data Table on Global - Market size and forecast 2025-2030 ($ million)
Chart on Global Market: Year-over-year growth 2025-2030 (%)
Data Table on Global Market: Year-over-year growth 2025-2030 (%)

5. Historic Market Size

5.1 Global Temperature Control Rental Market 2020 - 2024

Historic Market Size - Data Table on Global Temperature Control Rental Market 2020 - 2024 ($ million)

5.2 Type segment analysis 2020 - 2024

Historic Market Size - Type Segment 2020 - 2024 ($ million)

5.3 End-user segment analysis 2020 - 2024

Historic Market Size - End-user Segment 2020 - 2024 ($ million)

5.4 Application segment analysis 2020 - 2024

Historic Market Size - Application Segment 2020 - 2024 ($ million)

5.5 Geography segment analysis 2020 - 2024

Historic Market Size - Geography Segment 2020 - 2024 ($ million)

5.6 Country segment analysis 2020 - 2024

Historic Market Size - Country Segment 2020 - 2024 ($ million)

6. Qualitative Analysis

6.1 The AI impact on Global Temperature Control Rental Market

6.2 Impact of geopolitical conflicts on Global Temperature Control Rental Market

7. Five Forces Analysis

7.1 Five forces summary

Five forces analysis - Comparison between 2025 and 2030

7.2 Bargaining power of buyers

Bargaining power of buyers - Impact of key factors 2025 and 2030

7.3 Bargaining power of suppliers

Bargaining power of suppliers - Impact of key factors in 2025 and 2030

7.4 Threat of new entrants

Threat of new entrants - Impact of key factors in 2025 and 2030

7.5 Threat of substitutes

Threat of substitutes - Impact of key factors in 2025 and 2030

7.6 Threat of rivalry

Threat of rivalry - Impact of key factors in 2025 and 2030

7.7 Market condition

Chart on Market condition - Five forces 2025 and 2030

8. Market Segmentation by Type

8.1 Market segments

Chart on Type - Market share 2025-2030 (%)
Data Table on Type - Market share 2025-2030 (%)

8.2 Comparison by Type

Chart on Comparison by Type
Data Table on Comparison by Type

8.3 Chillers - Market size and forecast 2025-2030

Chart on Chillers - Market size and forecast 2025-2030 ($ million)
Data Table on Chillers - Market size and forecast 2025-2030 ($ million)
Chart on Chillers - Year-over-year growth 2025-2030 (%)
Data Table on Chillers - Year-over-year growth 2025-2030 (%)

8.4 Air conditioners - Market size and forecast 2025-2030

Chart on Air conditioners - Market size and forecast 2025-2030 ($ million)
Data Table on Air conditioners - Market size and forecast 2025-2030 ($ million)
Chart on Air conditioners - Year-over-year growth 2025-2030 (%)
Data Table on Air conditioners - Year-over-year growth 2025-2030 (%)

8.5 Cooling towers - Market size and forecast 2025-2030

Chart on Cooling towers - Market size and forecast 2025-2030 ($ million)
Data Table on Cooling towers - Market size and forecast 2025-2030 ($ million)
Chart on Cooling towers - Year-over-year growth 2025-2030 (%)
Data Table on Cooling towers - Year-over-year growth 2025-2030 (%)

8.6 Dehumidifiers - Market size and forecast 2025-2030

Chart on Dehumidifiers - Market size and forecast 2025-2030 ($ million)
Data Table on Dehumidifiers - Market size and forecast 2025-2030 ($ million)
Chart on Dehumidifiers - Year-over-year growth 2025-2030 (%)
Data Table on Dehumidifiers - Year-over-year growth 2025-2030 (%)

8.7 Others - Market size and forecast 2025-2030

Chart on Others - Market size and forecast 2025-2030 ($ million)
Data Table on Others - Market size and forecast 2025-2030 ($ million)
Chart on Others - Year-over-year growth 2025-2030 (%)
Data Table on Others - Year-over-year growth 2025-2030 (%)

8.8 Market opportunity by Type

Market opportunity by Type ($ million)
Data Table on Market opportunity by Type ($ million)

9. Market Segmentation by End-user

9.1 Market segments

Chart on End-user - Market share 2025-2030 (%)
Data Table on End-user - Market share 2025-2030 (%)

9.2 Comparison by End-user

Chart on Comparison by End-user
Data Table on Comparison by End-user

9.3 Industrial - Market size and forecast 2025-2030

Chart on Industrial - Market size and forecast 2025-2030 ($ million)
Data Table on Industrial - Market size and forecast 2025-2030 ($ million)
Chart on Industrial - Year-over-year growth 2025-2030 (%)
Data Table on Industrial - Year-over-year growth 2025-2030 (%)

9.4 Commercial - Market size and forecast 2025-2030

Chart on Commercial - Market size and forecast 2025-2030 ($ million)
Data Table on Commercial - Market size and forecast 2025-2030 ($ million)
Chart on Commercial - Year-over-year growth 2025-2030 (%)
Data Table on Commercial - Year-over-year growth 2025-2030 (%)

9.5 Residential - Market size and forecast 2025-2030

Chart on Residential - Market size and forecast 2025-2030 ($ million)
Data Table on Residential - Market size and forecast 2025-2030 ($ million)
Chart on Residential - Year-over-year growth 2025-2030 (%)
Data Table on Residential - Year-over-year growth 2025-2030 (%)

9.6 Market opportunity by End-user

Market opportunity by End-user ($ million)
Data Table on Market opportunity by End-user ($ million)

10. Market Segmentation by Application

10.1 Market segments

Chart on Application - Market share 2025-2030 (%)
Data Table on Application - Market share 2025-2030 (%)

10.2 Comparison by Application

Chart on Comparison by Application
Data Table on Comparison by Application

10.3 Oil and gas - Market size and forecast 2025-2030

Chart on Oil and gas - Market size and forecast 2025-2030 ($ million)
Data Table on Oil and gas - Market size and forecast 2025-2030 ($ million)
Chart on Oil and gas - Year-over-year growth 2025-2030 (%)
Data Table on Oil and gas - Year-over-year growth 2025-2030 (%)

10.4 Manufacturing - Market size and forecast 2025-2030

Chart on Manufacturing - Market size and forecast 2025-2030 ($ million)
Data Table on Manufacturing - Market size and forecast 2025-2030 ($ million)
Chart on Manufacturing - Year-over-year growth 2025-2030 (%)
Data Table on Manufacturing - Year-over-year growth 2025-2030 (%)

10.5 Construction - Market size and forecast 2025-2030

Chart on Construction - Market size and forecast 2025-2030 ($ million)
Data Table on Construction - Market size and forecast 2025-2030 ($ million)
Chart on Construction - Year-over-year growth 2025-2030 (%)
Data Table on Construction - Year-over-year growth 2025-2030 (%)

10.6 Petrochemical and refining - Market size and forecast 2025-2030

Chart on Petrochemical and refining - Market size and forecast 2025-2030 ($ million)
Data Table on Petrochemical and refining - Market size and forecast 2025-2030 ($ million)
Chart on Petrochemical and refining - Year-over-year growth 2025-2030 (%)
Data Table on Petrochemical and refining - Year-over-year growth 2025-2030 (%)

10.7 Others - Market size and forecast 2025-2030

Chart on Others - Market size and forecast 2025-2030 ($ million)
Data Table on Others - Market size and forecast 2025-2030 ($ million)
Chart on Others - Year-over-year growth 2025-2030 (%)
Data Table on Others - Year-over-year growth 2025-2030 (%)

10.8 Market opportunity by Application

Market opportunity by Application ($ million)
Data Table on Market opportunity by Application ($ million)

11. Customer Landscape

11.1 Customer landscape overview

Analysis of price sensitivity, lifecycle, customer purchase basket, adoption rates, and purchase criteria

12. Geographic Landscape

12.1 Geographic segmentation

Chart on Market share by geography 2025-2030 (%)
Data Table on Market share by geography 2025-2030 (%)

12.2 Geographic comparison

Chart on Geographic comparison
Data Table on Geographic comparison

12.3 APAC - Market size and forecast 2025-2030

Chart on APAC - Market size and forecast 2025-2030 ($ million)
Data Table on APAC - Market size and forecast 2025-2030 ($ million)
Chart on APAC - Year-over-year growth 2025-2030 (%)
Data Table on APAC - Year-over-year growth 2025-2030 (%)
Chart on Regional Comparison - APAC
Data Table on Regional Comparison - APAC

12.3.1 China - Market size and forecast 2025-2030

Chart on China - Market size and forecast 2025-2030 ($ million)
Data Table on China - Market size and forecast 2025-2030 ($ million)
Chart on China - Year-over-year growth 2025-2030 (%)
Data Table on China - Year-over-year growth 2025-2030 (%)

12.3.2 India - Market size and forecast 2025-2030

Chart on India - Market size and forecast 2025-2030 ($ million)
Data Table on India - Market size and forecast 2025-2030 ($ million)
Chart on India - Year-over-year growth 2025-2030 (%)
Data Table on India - Year-over-year growth 2025-2030 (%)

12.3.3 Japan - Market size and forecast 2025-2030

Chart on Japan - Market size and forecast 2025-2030 ($ million)
Data Table on Japan - Market size and forecast 2025-2030 ($ million)
Chart on Japan - Year-over-year growth 2025-2030 (%)
Data Table on Japan - Year-over-year growth 2025-2030 (%)

12.3.4 South Korea - Market size and forecast 2025-2030

Chart on South Korea - Market size and forecast 2025-2030 ($ million)
Data Table on South Korea - Market size and forecast 2025-2030 ($ million)
Chart on South Korea - Year-over-year growth 2025-2030 (%)
Data Table on South Korea - Year-over-year growth 2025-2030 (%)

12.3.5 Australia - Market size and forecast 2025-2030

Chart on Australia - Market size and forecast 2025-2030 ($ million)
Data Table on Australia - Market size and forecast 2025-2030 ($ million)
Chart on Australia - Year-over-year growth 2025-2030 (%)
Data Table on Australia - Year-over-year growth 2025-2030 (%)

12.3.6 Indonesia - Market size and forecast 2025-2030

Chart on Indonesia - Market size and forecast 2025-2030 ($ million)
Data Table on Indonesia - Market size and forecast 2025-2030 ($ million)
Chart on Indonesia - Year-over-year growth 2025-2030 (%)
Data Table on Indonesia - Year-over-year growth 2025-2030 (%)

12.4 North America - Market size and forecast 2025-2030

Chart on North America - Market size and forecast 2025-2030 ($ million)
Data Table on North America - Market size and forecast 2025-2030 ($ million)
Chart on North America - Year-over-year growth 2025-2030 (%)
Data Table on North America - Year-over-year growth 2025-2030 (%)
Chart on Regional Comparison - North America
Data Table on Regional Comparison - North America

12.4.1 US - Market size and forecast 2025-2030

Chart on US - Market size and forecast 2025-2030 ($ million)
Data Table on US - Market size and forecast 2025-2030 ($ million)
Chart on US - Year-over-year growth 2025-2030 (%)
Data Table on US - Year-over-year growth 2025-2030 (%)

12.4.2 Canada - Market size and forecast 2025-2030

Chart on Canada - Market size and forecast 2025-2030 ($ million)
Data Table on Canada - Market size and forecast 2025-2030 ($ million)
Chart on Canada - Year-over-year growth 2025-2030 (%)
Data Table on Canada - Year-over-year growth 2025-2030 (%)

12.4.3 Mexico - Market size and forecast 2025-2030

Chart on Mexico - Market size and forecast 2025-2030 ($ million)
Data Table on Mexico - Market size and forecast 2025-2030 ($ million)
Chart on Mexico - Year-over-year growth 2025-2030 (%)
Data Table on Mexico - Year-over-year growth 2025-2030 (%)

12.5 Europe - Market size and forecast 2025-2030

Chart on Europe - Market size and forecast 2025-2030 ($ million)
Data Table on Europe - Market size and forecast 2025-2030 ($ million)
Chart on Europe - Year-over-year growth 2025-2030 (%)
Data Table on Europe - Year-over-year growth 2025-2030 (%)
Chart on Regional Comparison - Europe
Data Table on Regional Comparison - Europe

12.5.1 Germany - Market size and forecast 2025-2030

Chart on Germany - Market size and forecast 2025-2030 ($ million)
Data Table on Germany - Market size and forecast 2025-2030 ($ million)
Chart on Germany - Year-over-year growth 2025-2030 (%)
Data Table on Germany - Year-over-year growth 2025-2030 (%)

12.5.2 UK - Market size and forecast 2025-2030

Chart on UK - Market size and forecast 2025-2030 ($ million)
Data Table on UK - Market size and forecast 2025-2030 ($ million)
Chart on UK - Year-over-year growth 2025-2030 (%)
Data Table on UK - Year-over-year growth 2025-2030 (%)

12.5.3 France - Market size and forecast 2025-2030

Chart on France - Market size and forecast 2025-2030 ($ million)
Data Table on France - Market size and forecast 2025-2030 ($ million)
Chart on France - Year-over-year growth 2025-2030 (%)
Data Table on France - Year-over-year growth 2025-2030 (%)

12.5.4 Italy - Market size and forecast 2025-2030

Chart on Italy - Market size and forecast 2025-2030 ($ million)
Data Table on Italy - Market size and forecast 2025-2030 ($ million)
Chart on Italy - Year-over-year growth 2025-2030 (%)
Data Table on Italy - Year-over-year growth 2025-2030 (%)

12.5.5 The Netherlands - Market size and forecast 2025-2030

Chart on The Netherlands - Market size and forecast 2025-2030 ($ million)
Data Table on The Netherlands - Market size and forecast 2025-2030 ($ million)
Chart on The Netherlands - Year-over-year growth 2025-2030 (%)
Data Table on The Netherlands - Year-over-year growth 2025-2030 (%)

12.5.6 Spain - Market size and forecast 2025-2030

Chart on Spain - Market size and forecast 2025-2030 ($ million)
Data Table on Spain - Market size and forecast 2025-2030 ($ million)
Chart on Spain - Year-over-year growth 2025-2030 (%)
Data Table on Spain - Year-over-year growth 2025-2030 (%)

12.6 Middle East and Africa - Market size and forecast 2025-2030

Chart on Middle East and Africa - Market size and forecast 2025-2030 ($ million)
Data Table on Middle East and Africa - Market size and forecast 2025-2030 ($ million)
Chart on Middle East and Africa - Year-over-year growth 2025-2030 (%)
Data Table on Middle East and Africa - Year-over-year growth 2025-2030 (%)
Chart on Regional Comparison - Middle East and Africa
Data Table on Regional Comparison - Middle East and Africa

12.6.1 Saudi Arabia - Market size and forecast 2025-2030

Chart on Saudi Arabia - Market size and forecast 2025-2030 ($ million)
Data Table on Saudi Arabia - Market size and forecast 2025-2030 ($ million)
Chart on Saudi Arabia - Year-over-year growth 2025-2030 (%)
Data Table on Saudi Arabia - Year-over-year growth 2025-2030 (%)

12.6.2 UAE - Market size and forecast 2025-2030

Chart on UAE - Market size and forecast 2025-2030 ($ million)
Data Table on UAE - Market size and forecast 2025-2030 ($ million)
Chart on UAE - Year-over-year growth 2025-2030 (%)
Data Table on UAE - Year-over-year growth 2025-2030 (%)

12.6.3 South Africa - Market size and forecast 2025-2030

Chart on South Africa - Market size and forecast 2025-2030 ($ million)
Data Table on South Africa - Market size and forecast 2025-2030 ($ million)
Chart on South Africa - Year-over-year growth 2025-2030 (%)
Data Table on South Africa - Year-over-year growth 2025-2030 (%)

12.6.4 Israel - Market size and forecast 2025-2030

Chart on Israel - Market size and forecast 2025-2030 ($ million)
Data Table on Israel - Market size and forecast 2025-2030 ($ million)
Chart on Israel - Year-over-year growth 2025-2030 (%)
Data Table on Israel - Year-over-year growth 2025-2030 (%)

12.6.5 Turkey - Market size and forecast 2025-2030

Chart on Turkey - Market size and forecast 2025-2030 ($ million)
Data Table on Turkey - Market size and forecast 2025-2030 ($ million)
Chart on Turkey - Year-over-year growth 2025-2030 (%)
Data Table on Turkey - Year-over-year growth 2025-2030 (%)

12.7 South America - Market size and forecast 2025-2030

Chart on South America - Market size and forecast 2025-2030 ($ million)
Data Table on South America - Market size and forecast 2025-2030 ($ million)
Chart on South America - Year-over-year growth 2025-2030 (%)
Data Table on South America - Year-over-year growth 2025-2030 (%)
Chart on Regional Comparison - South America
Data Table on Regional Comparison - South America

12.7.1 Brazil - Market size and forecast 2025-2030

Chart on Brazil - Market size and forecast 2025-2030 ($ million)
Data Table on Brazil - Market size and forecast 2025-2030 ($ million)
Chart on Brazil - Year-over-year growth 2025-2030 (%)
Data Table on Brazil - Year-over-year growth 2025-2030 (%)

12.7.2 Argentina - Market size and forecast 2025-2030

Chart on Argentina - Market size and forecast 2025-2030 ($ million)
Data Table on Argentina - Market size and forecast 2025-2030 ($ million)
Chart on Argentina - Year-over-year growth 2025-2030 (%)
Data Table on Argentina - Year-over-year growth 2025-2030 (%)

12.7.3 Colombia - Market size and forecast 2025-2030

Chart on Colombia - Market size and forecast 2025-2030 ($ million)
Data Table on Colombia - Market size and forecast 2025-2030 ($ million)
Chart on Colombia - Year-over-year growth 2025-2030 (%)
Data Table on Colombia - Year-over-year growth 2025-2030 (%)

12.8 Market opportunity by geography

Market opportunity by geography ($ million)
Data Tables on Market opportunity by geography ($ million)

13. Drivers, Challenges, and Opportunity

13.1 Market drivers

Increasing focus on environmental sustainability
Rapid industrialization and infrastructure development
Strategic shift toward asset-light business models and operational resilience

13.2 Market challenges

Navigating stringent regulatory frameworks and refrigerant transitions
Logistical complexities and scarcity of specialized technical labor
Global supply chain volatility and raw material cost inflation

13.3 Impact of drivers and challenges

Impact of drivers and challenges in 2025 and 2030

13.4 Market opportunities

Integration of advanced telematics and real-time remote monitoring
Expansion of hybrid and electric cooling solutions for decarbonization
Rise of industry-specific modular temperature control architectures

14. Competitive Landscape

14.1 Overview

14.2

Overview on criticality of inputs and factors of differentiation

14.3 Landscape disruption

Overview on factors of disruption

14.4 Industry risks

Impact of key risks on business

15. Competitive Analysis

15.1 Companies profiled

Companies covered

15.2 Company ranking index

15.3 Market positioning of companies

Matrix on companies position and classification

15.4 Aggreko Plc

Aggreko Plc - Overview
Aggreko Plc - Product / Service
Aggreko Plc - Key offerings
SWOT

15.5 Andrews Sykes Group PLC.

Andrews Sykes Group PLC. - Overview
Andrews Sykes Group PLC. - Product / Service
Andrews Sykes Group PLC. - Key offerings
SWOT

15.6 Boels Rental.

Boels Rental. - Overview
Boels Rental. - Product / Service
Boels Rental. - Key offerings
SWOT

15.7 Byrne Equipment Rental

Byrne Equipment Rental - Overview
Byrne Equipment Rental - Product / Service
Byrne Equipment Rental - Key offerings
SWOT

15.8 Carrier Global Corp.

Carrier Global Corp. - Overview
Carrier Global Corp. - Business segments
Carrier Global Corp. - Key offerings
Carrier Global Corp. - Segment focus
SWOT

15.9 Cat Rentals

Cat Rentals - Overview
Cat Rentals - Product / Service
Cat Rentals - Key offerings
SWOT

15.10 Cool Air Rentals Ltd.

Cool Air Rentals Ltd. - Overview
Cool Air Rentals Ltd. - Product / Service
Cool Air Rentals Ltd. - Key offerings
SWOT

15.11 Emerson Electric Co.

Emerson Electric Co. - Overview
Emerson Electric Co. - Business segments
Emerson Electric Co. - Key offerings
Emerson Electric Co. - Segment focus
SWOT

15.12 HERC HOLDINGS INC.

HERC HOLDINGS INC. - Overview
HERC HOLDINGS INC. - Product / Service
HERC HOLDINGS INC. - Key offerings
SWOT

15.13 Honeywell International Inc.

Honeywell International Inc. - Overview
Honeywell International Inc. - Business segments
Honeywell International Inc. - Key news
Honeywell International Inc. - Key offerings
Honeywell International Inc. - Segment focus
SWOT

15.14 Johnson Controls International

Johnson Controls International - Overview
Johnson Controls International - Business segments
Johnson Controls International - Key offerings
Johnson Controls International - Segment focus
SWOT

15.15 Kiloutou

Kiloutou - Overview
Kiloutou - Product / Service
Kiloutou - Key offerings
SWOT

15.16 LOXAM GROUP.

LOXAM GROUP. - Overview
LOXAM GROUP. - Business segments
LOXAM GROUP. - Key offerings
LOXAM GROUP. - Segment focus
SWOT

15.17 Modulaire Group

Modulaire Group - Overview
Modulaire Group - Product / Service
Modulaire Group - Key offerings
SWOT

15.18 Polygon International AB

Polygon International AB - Overview
Polygon International AB - Product / Service
Polygon International AB - Key offerings
SWOT

16. Appendix

16.1 Scope of the report

Market definition
Objectives
Notes and caveats

16.2 Inclusions and exclusions checklist

Inclusions checklist
Exclusions checklist

16.3 Currency conversion rates for US$

16.4 Research methodology

16.5 Data procurement

Information sources

16.6 Data validation

16.7 Validation techniques employed for market sizing

16.8 Data synthesis

16.9 360 degree market analysis

16.10 List of abbreviations

Research Methodology

Technavio presents a detailed picture of the market by way of study, synthesis, and summation of data from multiple sources. The analysts have presented the various facets of the market with a particular focus on identifying the key industry influencers. The data thus presented is comprehensive, reliable, and the result of extensive research, both primary and secondary.

INFORMATION SOURCES

Primary sources

  • Manufacturers and suppliers
  • Channel partners
  • Industry experts
  • Strategic decision makers

Secondary sources

  • Industry journals and periodicals
  • Government data
  • Financial reports of key industry players
  • Historical data
  • Press releases

DATA ANALYSIS

Data Synthesis

  • Collation of data
  • Estimation of key figures
  • Analysis of derived insights

Data Validation

  • Triangulation with data models
  • Reference against proprietary databases
  • Corroboration with industry experts

REPORT WRITING

Qualitative

  • Market drivers
  • Market challenges
  • Market trends
  • Five forces analysis

Quantitative

  • Market size and forecast
  • Market segmentation
  • Geographical insights
  • Competitive landscape

Interested in this report?

Get your sample now to see our research methodology and insights!

Download Now

Frequently Asked Questions

Temperature Control Rental market growth will increase by USD 2300.1 million during 2026-2030.

The Temperature Control Rental market is expected to grow at a CAGR of 7.3% during 2026-2030.

Temperature Control Rental market is segmented by Type (Chillers, Air conditioners, Cooling towers, Dehumidifiers, Others) End-user (Industrial, Commercial, Residential) Application (Oil and gas, Manufacturing, Construction, Petrochemical and refining, Others)

Aggreko Plc, Andrews Sykes Group PLC., Boels Rental., Byrne Equipment Rental, Carrier Global Corp., Cat Rentals, Cool Air Rentals Ltd., Emerson Electric Co., HERC HOLDINGS INC., Honeywell International Inc., Johnson Controls International, Kiloutou, LOXAM GROUP., Modulaire Group, Polygon International AB, Rankin Climate LLC., Sunbelt Rentals Inc., Trane Technologies plc, United Rentals Inc., WillScot Holdings Corp. are a few of the key vendors in the Temperature Control Rental market.

APAC will register the highest growth rate of 42.1% among the other regions. Therefore, the Temperature Control Rental market in APAC is expected to garner significant business opportunities for the vendors during the forecast period.

China, India, Japan, South Korea, Australia, Indonesia, US, Canada, Mexico, Germany, UK, France, Italy, The Netherlands, Spain, Saudi Arabia, UAE, South Africa, Israel, Turkey, Brazil, Argentina, Colombia

  • Increasing focus on environmental sustainability is the driving factor this market.

The Temperature Control Rental market vendors should focus on grabbing business opportunities from the Type segment as it accounted for the largest market share in the base year.
RIA - Research AI Assistant
Ask RIA