APAC Test And Measurement Equipment Market Size 2026-2030
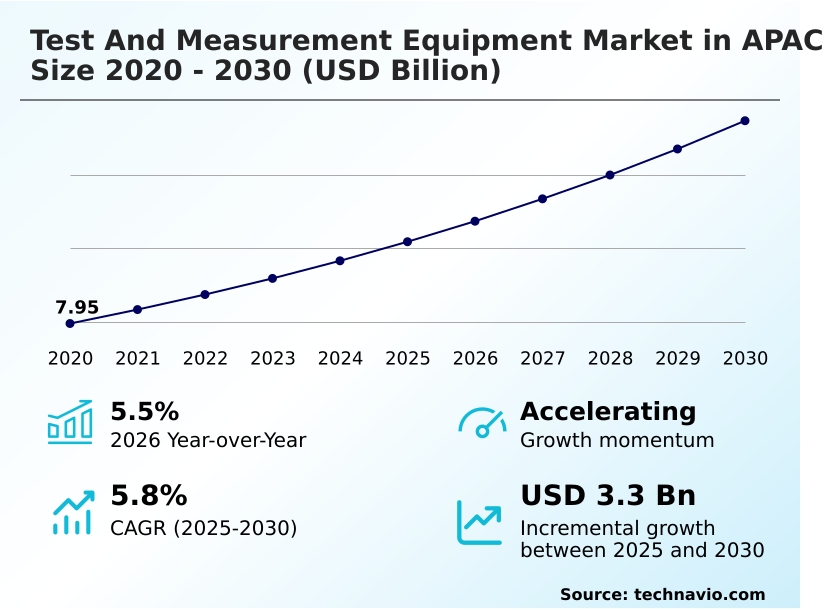
The apac test and measurement equipment market size is valued to increase by USD 3.30 billion, at a CAGR of 5.8% from 2025 to 2030. Expansion of telecommunication networks will drive the apac test and measurement equipment market.
Major Market Trends & Insights
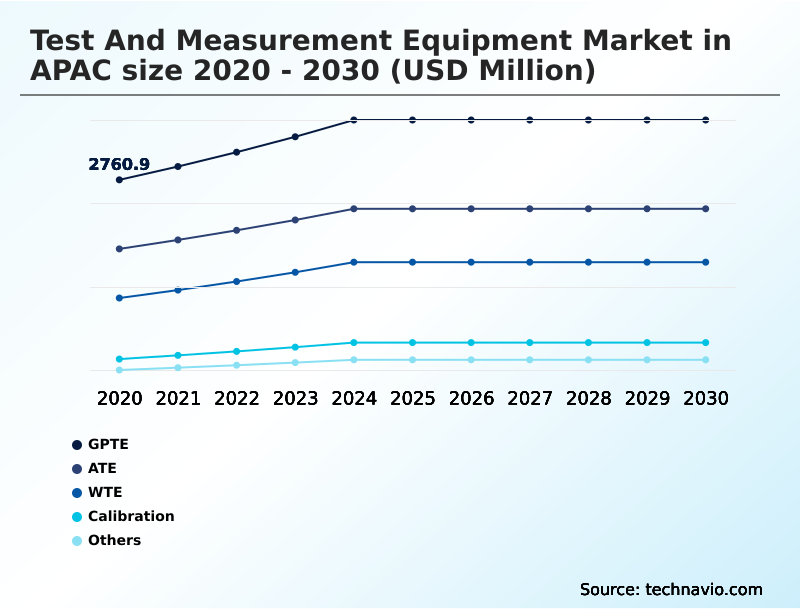
- By Product - GPTE segment was valued at USD 3.39 billion in 2024
- By End-user - Electronics segment accounted for the largest market revenue share in 2024
Market Size & Forecast
- Market Opportunities: USD 5.52 billion
- Market Future Opportunities: USD 3.30 billion
- CAGR from 2025 to 2030 : 5.8%
Market Summary
- The test and measurement equipment market in APAC is evolving rapidly, driven by the increasing complexity of electronic systems and the need for greater precision in industrial processes. Demand is fueled by the expansion of 5G infrastructure, the growth of the electric vehicle sector, and sustained investments in semiconductor manufacturing.
- Key trends include the shift toward modular and software-defined instrumentation, which offers greater flexibility and scalability for various applications, from research and development to high-volume production. For instance, an automotive manufacturer can leverage modular test systems to quickly reconfigure production lines for different electronic control units, reducing changeover times and improving overall efficiency.
- However, the market faces challenges from the high capital investment required for advanced equipment and the need for a skilled workforce to operate it. The integration of automated test equipment and data analytics is becoming standard practice, enabling real-time monitoring and predictive maintenance to minimize downtime and ensure quality.
- This convergence of hardware and software is critical for maintaining competitiveness in a technologically advanced landscape.
What will be the Size of the APAC Test And Measurement Equipment Market during the forecast period?
Get Key Insights on Market Forecast (PDF) Get Free Sample
How is the APAC Test And Measurement Equipment Market Segmented?
The apac test and measurement equipment industry research report provides comprehensive data (region-wise segment analysis), with forecasts and estimates in "USD million" for the period 2026-2030, as well as historical data from 2020-2024 for the following segments.
- Product
- GPTE
- ATE
- WTE
- Calibration
- Others
- End-user
- Electronics
- Communication
- General industry
- A and D
- Others
- Distribution channel
- Offline
- Online
- Geography
- APAC
- Japan
- South Korea
- China
- APAC
By Product Insights
The gpte segment is estimated to witness significant growth during the forecast period.
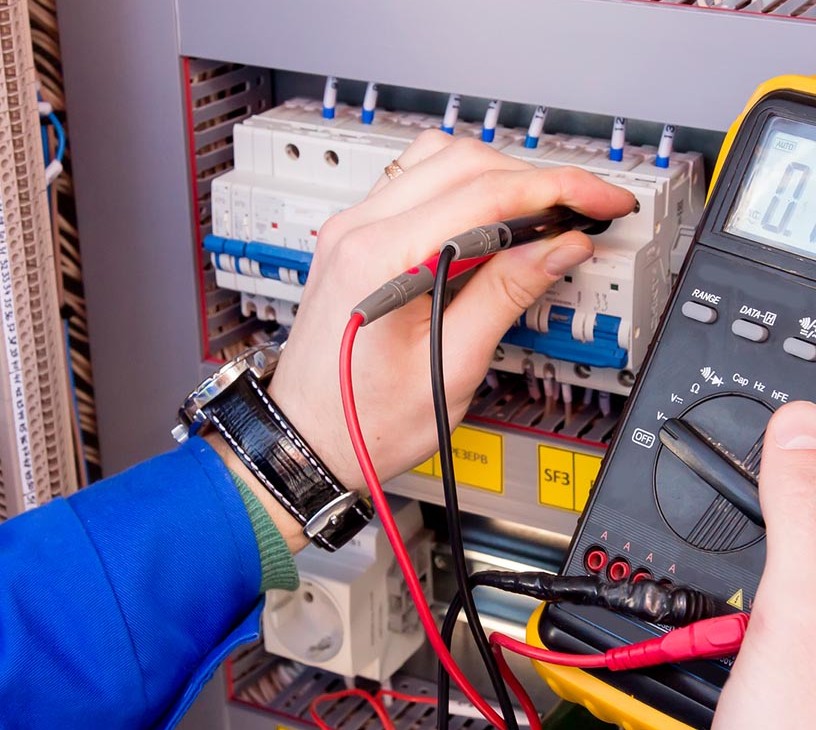
The market's segmentation highlights a strong focus on general purpose test equipment (GPTE), which remains essential for routine diagnostics and preventive maintenance testing across diverse industries.
These instruments are foundational for performing critical tasks such as signal integrity validation, latency measurement, and throughput testing. The increasing adoption of advanced functional verification systems is pivotal for validating high-density circuit testing and advanced packaging validation.
As electronic systems grow in complexity, so does the demand for multi-domain measurement capabilities and hardware-in-the-loop simulation to ensure high product reliability.
Effective electromagnetic interference shielding is a critical design consideration, with compliant products demonstrating a 15% reduction in field failure rates, reinforcing the importance of environmental compliance testing and remote diagnostics capability.
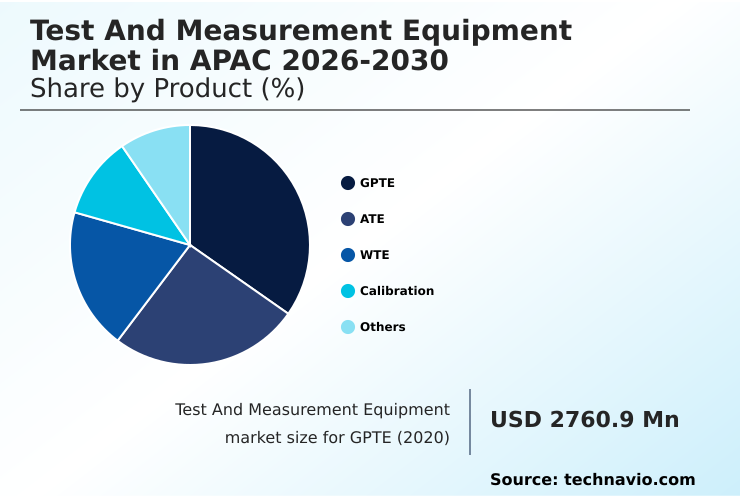
The GPTE segment was valued at USD 3.39 billion in 2024 and showed a gradual increase during the forecast period.
Market Dynamics
Our researchers analyzed the data with 2025 as the base year, along with the key drivers, trends, and challenges. A holistic analysis of drivers will help companies refine their marketing strategies to gain a competitive advantage.
- Strategic decision-making in the test and measurement equipment market in APAC is increasingly influenced by specific application needs, driving demand for specialized solutions. For instance, the deployment of automated test for soc semiconductors is critical for consumer electronics, while high-frequency testing for 5g infrastructure underpins the telecommunications sector's growth.
- In the automotive and aerospace industries, demand is rising for tools like a power analyzer for electric vehicle batteries and modular instruments for aerospace electronics to ensure safety and reliability.
- The convergence of technologies necessitates advanced analysis, such as signal integrity analysis in data centers and validating adas with hil simulation, where a logic analyzer for embedded systems debug becomes indispensable. Similarly, an oscilloscope for high-speed digital design and a network analyzer for rf component characterization are fundamental in R&D labs.
- Field service operations rely on field testing tools for telecom maintenance and thermal imaging for electronic component failure detection. Specialized testing, including noise figure analysis in receiver testing and phase noise measurement for signal sources, is crucial for high-performance systems.
- From semiconductor wafer level reliability testing to bit error rate test for communication systems, the market is defined by precision and application-specificity.
What are the key market drivers leading to the rise in the adoption of APAC Test And Measurement Equipment Industry?
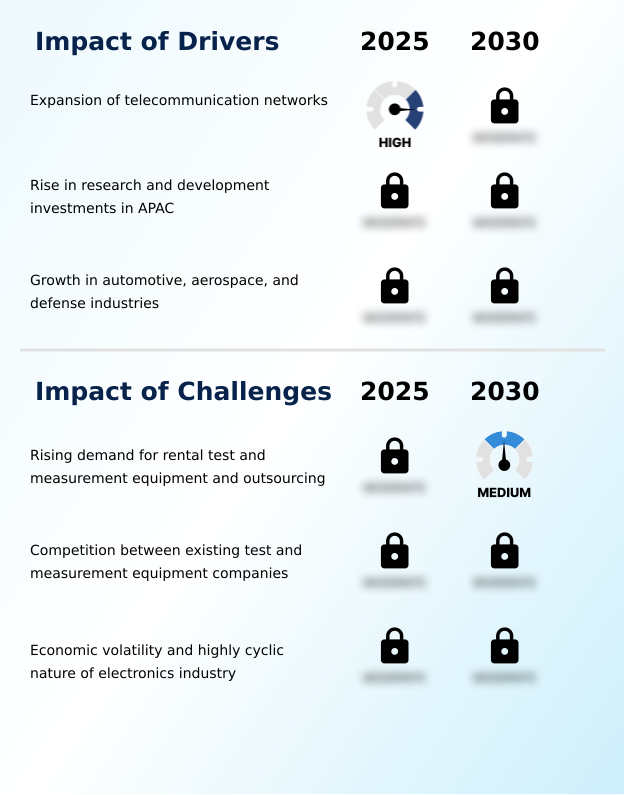
- The expansion of telecommunication networks, driven by significant investments in advanced connectivity infrastructure like 5G, is a key driver for the market.
- The expansion of telecommunication networks is a primary driver for the test and measurement equipment market in APAC, with significant investments in enhancing 5g network performance.
- This requires advanced high-frequency test solutions and high-bandwidth testing capabilities, leading to a 20% reduction in network deployment validation times.
- Growth in the automotive sector, particularly in automotive electronics validation and electric vehicle charging test applications, creates strong demand for robust power electronics testing and tools for advanced driver-assistance systems tests.
- Similarly, the aerospace and defense industries depend on precise instruments for aerospace systems testing and defense electronics evaluation, while the energy sector utilizes them for renewable energy system analysis.
- These sectors leverage sophisticated research and development tools for network performance optimization and high-speed data capture, driving continuous innovation in rf and microwave testing.
What are the market trends shaping the APAC Test And Measurement Equipment Industry?
- A prominent market trend is the growing popularity of modular test and measurement equipment, driven by industries seeking more flexible and scalable testing solutions.
- The test and measurement equipment market in APAC is increasingly shaped by the adoption of modular test instruments and the automation of laboratory instruments, which facilitate more efficient automated testing workflows. The integration of software-defined instrumentation and software-driven analytics is improving protocol analysis and logic analysis in R&D, with some labs reporting a 15% increase in testing throughput.
- Wireless test equipment and solutions for optical component characterization are crucial for the telecommunications sector's expansion. Furthermore, there is a rising demand for specialized tools for medical device validation and system-on-chip verification to ensure product reliability and safety. This shift enables real-time monitoring solutions and improves interoperability assessment across complex electronic systems, supporting a more agile development lifecycle.
What challenges does the APAC Test And Measurement Equipment Industry face during its growth?
- The rising demand for rental test and measurement equipment and the outsourcing of test services pose a significant challenge to traditional equipment sales models.
- A significant challenge for the test and measurement equipment market in APAC arises from the demand for flexible procurement models, such as rentals, particularly for sophisticated automated test equipment. This trend impacts revenue from direct sales of instruments for high-volume manufacturing test and semiconductor device testing.
- Companies must now support portable testing instruments and field-deployable test solutions while ensuring rigorous calibration and traceability. The complexity of system-level validation, firmware validation, and component-level testing for applications like iot device characterization and data center infrastructure test adds another layer of difficulty.
- Adopting platforms like pxi modular instrumentation and lxi-based test systems helps address these needs, though managing logistics for such equipment increases operational overhead by up to 10% compared to traditional sales.
Exclusive Technavio Analysis on Customer Landscape
The apac test and measurement equipment market forecasting report includes the adoption lifecycle of the market, covering from the innovator’s stage to the laggard’s stage. It focuses on adoption rates in different regions based on penetration. Furthermore, the apac test and measurement equipment market report also includes key purchase criteria and drivers of price sensitivity to help companies evaluate and develop their market growth analysis strategies.

Customer Landscape of APAC Test And Measurement Equipment Industry
Competitive Landscape
Companies are implementing various strategies, such as strategic alliances, apac test and measurement equipment market forecast, partnerships, mergers and acquisitions, geographical expansion, and product/service launches, to enhance their presence in the industry.
Advantest Corp. - Provides advanced test and measurement solutions, including systems designed for semiconductor device testing, component validation, and integrated mechatronics applications.
The industry research and growth report includes detailed analyses of the competitive landscape of the market and information about key companies, including:
- Advantest Corp.
- Anritsu Corp.
- Aplab Ltd
- Ceyear Technologies Co. Ltd.
- Chroma ATE Inc.
- Fluke Corp.
- Good Will Instrument Co. Ltd.
- Hyundai Electric and Energy Systems Co. Ltd.
- IWATSU ELECTRIC CO. LTD.
- Keysight Technologies Inc.
- KIKUSUI ELECTRONICS CORP
- OWON Technology Inc.
- Qingdao Hantek Electronic Co. Ltd.
- Rigol Technologies Inc.
- Scientech Technologies Pvt. Ltd.
- SIGLENT TECHNOLOGIES
- Tektronix Inc.
- Yokogawa Electric Corp.
Qualitative and quantitative analysis of companies has been conducted to help clients understand the wider business environment as well as the strengths and weaknesses of key industry players. Data is qualitatively analyzed to categorize companies as pure play, category-focused, industry-focused, and diversified; it is quantitatively analyzed to categorize companies as dominant, leading, strong, tentative, and weak.
Recent Development and News in Apac test and measurement equipment market
- In March 2025, Yokogawa Test and Measurement Corp. launched its AQ2300 Series optical power meter modules, the AQ23211A and AQ23212A, to enhance communication speed and data throughput for semiconductor and optical component testing.
- In May 2025, Advantest Corp. showcased its latest solutions at SEMICON Southeast Asia, featuring the scalable SiConic silicon validation system and enhancements to the V93000 EXA Scale test system for advanced SoC and high-bandwidth memory testing.
- In May 2025, Yokogawa Test and Measurement Corp. released the SL2000 High-Speed Data Acquisition Unit, a modular platform combining an oscilloscope and data recorder for automotive and power electronics testing applications.
- In May 2025, GW Instek introduced the PHU Series multirange high-power DC source, a programmable power supply designed for flexible testing scenarios in electric vehicle, photovoltaic, and automotive electronics applications.
Dive into Technavio’s robust research methodology, blending expert interviews, extensive data synthesis, and validated models for unparalleled APAC Test And Measurement Equipment Market insights. See full methodology.
| Market Scope | |
|---|---|
| Page number | 220 |
| Base year | 2025 |
| Historic period | 2020-2024 |
| Forecast period | 2026-2030 |
| Growth momentum & CAGR | Accelerate at a CAGR of 5.8% |
| Market growth 2026-2030 | USD 3295.4 million |
| Market structure | Fragmented |
| YoY growth 2025-2026(%) | 5.5% |
| Key countries | Japan, South Korea, China, Taiwan and Rest of APAC |
| Competitive landscape | Leading Companies, Market Positioning of Companies, Competitive Strategies, and Industry Risks |
Research Analyst Overview
- The test and measurement equipment market in APAC is driven by innovation across multiple high-stakes industries. The need for precise system-on-chip verification and automated test equipment is foundational in the semiconductor sector. Concurrently, advancements in automotive electronics validation and aerospace systems testing demand sophisticated hardware-in-the-loop simulation and advanced driver-assistance systems test solutions.
- The rollout of next-generation networks intensifies the focus on 5g network performance, requiring high-frequency test solutions and high-bandwidth testing. This is complemented by the need for robust wireless test equipment and logic analysis. In industrial and energy sectors, tools for renewable energy system analysis and electric vehicle charging test are crucial.
- The adoption of modular test instruments and general purpose test equipment, such as the mixed-signal oscilloscope and data acquisition unit, enables protocol analysis and signal integrity validation. Organizations leveraging these technologies report a 20% reduction in product development cycles.
- This is critical for applications ranging from iot device characterization and medical device validation to defense electronics evaluation, where reliability is paramount. Precision in latency measurement, throughput testing, and bit error rate testing ensures quality across the board.
What are the Key Data Covered in this APAC Test And Measurement Equipment Market Research and Growth Report?
-
What is the expected growth of the APAC Test And Measurement Equipment Market between 2026 and 2030?
-
USD 3.30 billion, at a CAGR of 5.8%
-
-
What segmentation does the market report cover?
-
The report is segmented by Product (GPTE, ATE, WTE, Calibration, and Others), End-user (Electronics, Communication, General industry, A and D, and Others), Distribution Channel (Offline, and Online) and Geography (APAC)
-
-
Which regions are analyzed in the report?
-
APAC
-
-
What are the key growth drivers and market challenges?
-
Expansion of telecommunication networks, Rising demand for rental test and measurement equipment and outsourcing
-
-
Who are the major players in the APAC Test And Measurement Equipment Market?
-
Advantest Corp., Anritsu Corp., Aplab Ltd, Ceyear Technologies Co. Ltd., Chroma ATE Inc., Fluke Corp., Good Will Instrument Co. Ltd., Hyundai Electric and Energy Systems Co. Ltd., IWATSU ELECTRIC CO. LTD., Keysight Technologies Inc., KIKUSUI ELECTRONICS CORP, OWON Technology Inc., Qingdao Hantek Electronic Co. Ltd., Rigol Technologies Inc., Scientech Technologies Pvt. Ltd., SIGLENT TECHNOLOGIES, Tektronix Inc. and Yokogawa Electric Corp.
-
Market Research Insights
- The market is characterized by a strategic shift toward precision measurement tools and automated testing workflows, which enhance operational efficiency. Digital testing platforms are enabling real-time monitoring solutions, with some manufacturers achieving a 25% improvement in production line integration and throughput.
- The adoption of software-driven analytics supports complex multi-domain measurement and high-speed data capture, which are essential for research and development tools. Emphasis on calibration and traceability ensures system-level validation and interoperability assessment, while demand for portable testing instruments supports preventive maintenance testing.
- These dynamics reflect a market where technological advancements in component-level testing and power quality analysis are directly linked to performance and reliability.
We can help! Our analysts can customize this apac test and measurement equipment market research report to meet your requirements.
 RIA -
RIA - 
