Third-Party Risk Management Market Analysis, Size, and Forecast 2025-2029: North America (US and Canada), Europe (France, Germany, Italy, UK), APAC (China, India, Japan, South Korea), South America , and Middle East and Africa

Third-Party Risk Management Market Analysis, Size, and Forecast 2025-2029:
North America (US and Canada), Europe (France, Germany, Italy, UK), APAC (China, India, Japan, South Korea), South America , and Middle East and Africa

Published: Mar 2025 248 Pages SKU: IRTNTR74177

Market Overview at a Glance

$9.78 B
Market Opportunity
18.5%
CAGR
16.6
YoY growth 2024-2025(%)

Third-Party Risk Management Market Size 2025-2029

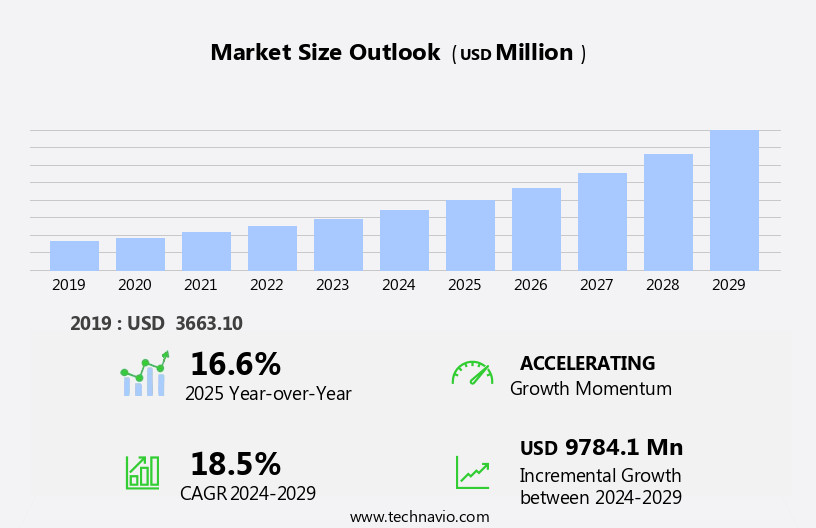
The third-party risk management market size is forecast to increase by USD 9.78 billion, at a CAGR of 18.5% between 2024 and 2029.

  • The market is experiencing significant growth and transformation, driven by the increasing adoption of advanced technologies such as artificial intelligence (AI) and machine learning (ML) in third-party risk management software solutions. These technologies enable organizations to automate risk assessments, monitor risks in real-time, and make data-driven decisions, thereby improving operational efficiency and reducing risks. However, the market also faces challenges, including the emergence of open-source risk management software. While open-source solutions offer cost advantages, they may lack the advanced features and capabilities of proprietary software, potentially compromising the effectiveness of risk management efforts. Organizations must carefully evaluate the trade-offs between cost savings and risk mitigation capabilities when considering open-source solutions.
  • Effective third-party risk management is crucial for businesses seeking to protect their reputation, mitigate financial losses, and ensure regulatory compliance. Companies can capitalize on market opportunities by investing in AI- and ML-powered third-party risk management software, while addressing challenges by conducting thorough evaluations of open-source solutions.

What will be the Size of the Third-Party Risk Management Market during the forecast period?

Third-Party Risk Management Market Size

Explore in-depth regional segment analysis with market size data - historical 2019-2023 and forecasts 2025-2029 - in the full report.  
Request Free Sample

The market continues to evolve, with dynamic market dynamics shaping its applications across various sectors. Access control and risk avoidance remain key priorities, as entities seek to mitigate potential threats posed by external partners. Performance indicators and company management are essential tools for measuring and optimizing third-party relationships, while supplier diversity and performance measurement help ensure ethical sourcing and maintain compliance with regulatory frameworks. Key risk indicators, data loss prevention, and compliance monitoring are critical components of effective third-party risk management. Strategic risk, regulatory frameworks, and security audits are integral to managing risks associated with third-party relationships.

Reputational risk and stakeholder engagement are also crucial, as entities strive to maintain a positive public image and build strong partnerships. Risk monitoring, policy development, metrics reporting, identity management, financial risk, vulnerability management, business continuity, technology solutions, data analytics, scenario planning, contract lifecycle management, information governance, quantitative analysis, and governance framework are all integral to the ongoing management of third-party risks. Disaster recovery, ethical sourcing, data security, training programs, contract negotiation, communication strategy, risk appetite, board reporting, incident response, due diligence, fraud detection, compliance audits, insurance policies, risk transfer, penetration testing, risk mitigation, predictive modeling, threat intelligence, risk assessment, risk tolerance, legal counsel, internal controls, and qualitative analysis are all essential elements of a comprehensive third-party risk management strategy.

As market dynamics continue to unfold, entities must remain vigilant and adapt to evolving risks and regulatory requirements. By implementing robust third-party risk management practices, organizations can mitigate risks, optimize performance, and build strong, sustainable partnerships.

How is this Third-Party Risk Management Industry segmented?

The third-party risk management industry research report provides comprehensive data (region-wise segment analysis), with forecasts and estimates in "USD million" for the period 2025-2029, as well as historical data from 2019-2023 for the following segments.

  • Component
    • Solution
    • Service
  • Deployment
    • Cloud
    • On-premises
  • Consumer
    • Large enterprises
    • SMEs
  • End-user
    • BFSI
    • IT and telecom
    • Healthcare
    • Retail
    • Others
  • Service
    • Professional services
    • Management services
  • Geography
    • North America
      • US
      • Canada
    • Europe
      • France
      • Germany
      • Italy
      • UK
    • APAC
      • China
      • India
      • Japan
      • South Korea
    • Rest of World (ROW)

    By Component Insights

    The solution segment is estimated to witness significant growth during the forecast period.

    Third-party risk management solutions have gained significant importance in business organizations, particularly in managing risks associated with external entities such as companies, suppliers, and contractors. These solutions offer software-as-a-service (SaaS) that provides a real-time, integrated view of the extended enterprise to mitigate third-party risks. The offerings automate end-to-end processes, including information gathering, onboarding, monitoring, risk assessments, compliance checks, and control assessments. An effective third-party risk management strategy encompasses various aspects, including access control, risk avoidance, performance indicators, company management, supplier diversity, performance measurement, key risk indicators, data loss prevention, compliance monitoring, strategic risk, regulatory frameworks, security audits, reputational risk, stakeholder engagement, risk monitoring, policy development, metrics reporting, identity management, financial risk, vulnerability management, operational risk, business continuity, technology solutions, data analytics, scenario planning, contract lifecycle management, third-party relationships, information governance, quantitative analysis, executive summaries, governance framework, disaster recovery, ethical sourcing, data security, training programs, contract negotiation, communication strategy, risk appetite, board reporting, incident response, due diligence, fraud detection, compliance audits, insurance policies, risk transfer, penetration testing, risk mitigation, predictive modeling, threat intelligence, risk assessment, risk tolerance, legal counsel, internal controls, and qualitative analysis.

    Through an integrated and federated approach, organizations can build trust and confidence in third-party relationships, ensuring the security of shared data and facilitating mutual growth. This approach is essential in today's complex business landscape, where managing third-party risks is crucial for maintaining a strong organizational reputation and ensuring regulatory compliance.

    Third-Party Risk Management Market Size

    Request Free Sample

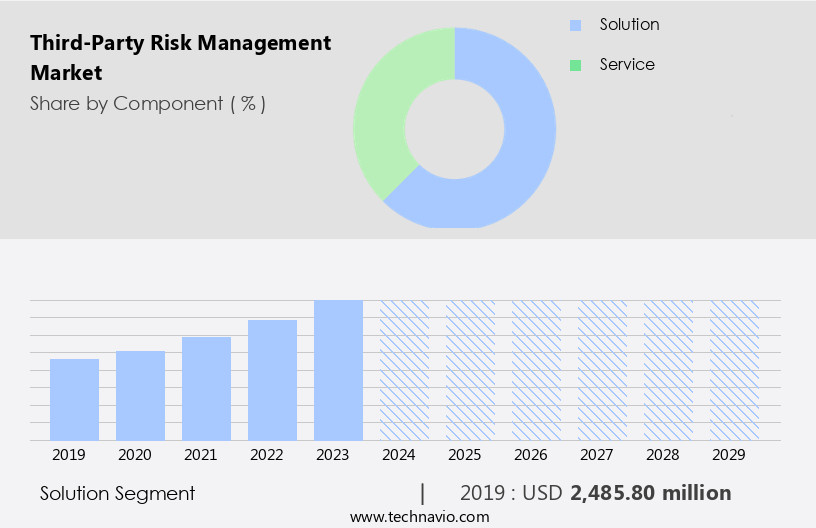
    The Solution segment was valued at USD 2.49 billion in 2019 and showed a gradual increase during the forecast period.

    Regional Analysis

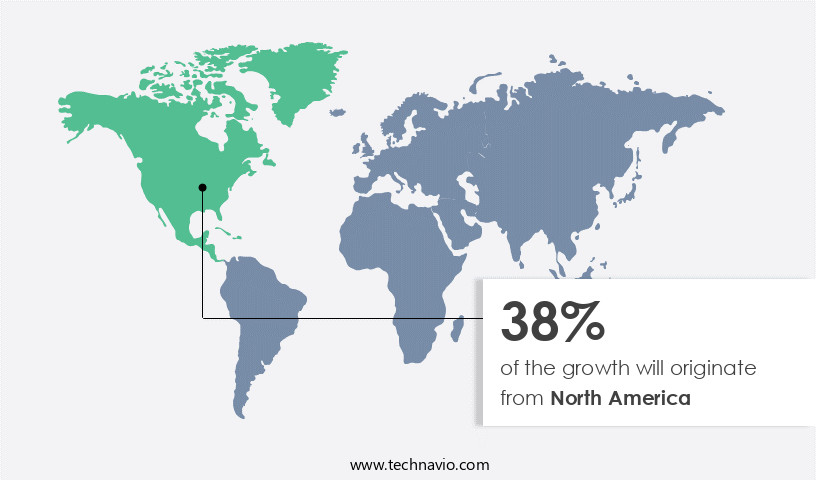
    North America is estimated to contribute 38% to the growth of the global market during the forecast period.Technavio’s analysts have elaborately explained the regional trends and drivers that shape the market during the forecast period.

    Third-Party Risk Management Market Share by Geography

     Request Free Sample

    The European the market is experiencing significant growth due to the increasing need for organizations to adhere to regulatory frameworks. One of the primary risks faced by businesses in this region is the translation risk resulting from currency fluctuations in the market. Brexit, in particular, has led to uncertainties in currency exchange rates, posing challenges for organizations dealing with multiple currencies. To mitigate the financial risks associated with FX rates and ensure effective cash management and forecasting, industries such as BFSI, IT, and healthcare are increasingly adopting third-party risk management solutions. company management, supplier diversity, and performance measurement are crucial aspects of third-party risk management.

    Key risk indicators, data loss prevention, and compliance monitoring are essential performance indicators that organizations use to evaluate potential risks. Identity management, financial risk, and operational risk are significant areas of concern, necessitating robust internal controls and data security measures. Strategic risk, regulatory frameworks, and reputational risk are other critical factors influencing the market. Security audits, stakeholder engagement, risk monitoring, policy development, metrics reporting, and communication strategy are integral components of an effective third-party risk management program. Contract lifecycle management, information governance, and business continuity planning are essential for managing risks related to third-party relationships. Technology solutions, such as data analytics, scenario planning, and predictive modeling, are increasingly being adopted to enhance risk assessment capabilities.

    Contract negotiation, incident response, due diligence, fraud detection, and compliance audits are crucial elements of the risk management process. Insurance policies and risk transfer mechanisms are also essential for managing financial risks. Risk mitigation strategies, including penetration testing, risk assessment, risk tolerance, and legal counsel, are essential for managing various risks. Quantitative analysis and executive summaries provide valuable insights into the effectiveness of risk management programs. Governance frameworks, disaster recovery, ethical sourcing, and training programs are essential for ensuring a harmonious and risk-free business environment.

    Market Dynamics

    Our researchers analyzed the data with 2024 as the base year, along with the key drivers, trends, and challenges. A holistic analysis of drivers will help companies refine their marketing strategies to gain a competitive advantage.

    In today's interconnected business landscape, the market plays a pivotal role in safeguarding organizations from potential threats posed by external companies and partners. This market encompasses solutions and services designed to assess, mitigate, and monitor risks associated with third-party relationships. Key components include company risk assessment, due diligence, contract management, risk scoring, and ongoing monitoring. Regulatory compliance, cybersecurity risks, operational risks, and reputational risks are primary concerns driving demand for third-party risk management solutions. Effective implementation of these solutions can enhance organizational resilience, ensure regulatory compliance, and protect sensitive data. Ultimately, third-party risk management is an essential aspect of enterprise risk management strategies, enabling businesses to mitigate risks, build trust, and foster successful partnerships.

    What are the key market drivers leading to the rise in the adoption of Third-Party Risk Management Industry?

    • The significance of benefits derived from third-party risk management is the primary market motivator. 

    • Third-party risk management has become a critical aspect for organizations as they increasingly rely on external companies for supply chain, data hosting, infrastructure, and services. This dependence creates potential risks, such as cybersecurity breaches, compliance issues, reputational damage, financial losses, operational disruptions, and strategic misalignment. To mitigate these risks, businesses are implementing third-party risk management solutions. These solutions provide organizations with the ability to assess, monitor, and manage risks associated with third parties. Third-party risk management encompasses various areas, including compliance audits, insurance policies, risk transfer, penetration testing, risk mitigation, predictive modeling, threat intelligence, risk assessment, risk tolerance, legal counsel, internal controls, and qualitative analysis.
    • By effectively managing third-party risks, organizations can protect their assets, reputation, and financial stability while ensuring regulatory compliance and maintaining strong business relationships. Professional risk management practices involve continuous monitoring, evaluation, and improvement of third-party relationships. Organizations can leverage technology and industry best practices to enhance their third-party risk management capabilities, ensuring a harmonious and immersive approach to risk management that emphasizes collaboration and transparency. In conclusion, the importance of third-party risk management cannot be overstated in today's interconnected business landscape. By implementing robust risk management practices, organizations can effectively identify, assess, and mitigate risks associated with third parties, ultimately driving growth and success.

    What are the market trends shaping the Third-Party Risk Management Industry?

    • Artificial intelligence (AI) and machine learning (ML) integration is becoming a standard feature in third-party risk management software solutions. This market trend reflects the growing importance of advanced technologies in enhancing risk assessment and mitigation capabilities.

    • Artificial Intelligence (AI) and Machine Learning (ML) technologies are revolutionizing Third-Party Risk Management (TRM) by providing more sophisticated risk assessments. These advanced technologies enable organizations to analyze large datasets and identify potential risks associated with third-party relationships that may not be apparent through traditional methods. By predicting risks based on historical data and ongoing monitoring, organizations can take a proactive approach to risk management, mitigating risks before they escalate. AI and ML automate the monitoring of third-party activities, continuously assessing company behavior, regulatory compliance, and other risk indicators. Automated alerts and notifications facilitate rapid responses to emerging risks, enhancing overall risk management effectiveness.
    • Key performance indicators (KPIs) and key risk indicators (KRIs) can be monitored in real-time, allowing organizations to measure and improve company performance. Supplier diversity, access control, and data loss prevention are critical aspects of TRM. AI and ML technologies can help ensure compliance with regulatory frameworks and industry standards, reducing reputational risk and stakeholder engagement. Security audits and compliance monitoring are essential components of TRM, and AI and ML can streamline these processes, making them more efficient and effective. Strategic risk management is also enhanced through the use of AI and ML, enabling organizations to identify and prioritize risks based on potential impact and likelihood.

    What challenges does the Third-Party Risk Management Industry face during its growth?

    • The growth of the industry is confronted with a significant challenge from the threat posed by open-source risk management software. This issue merits close attention due to its potential impact on business operations and expansion. 

    • The market faces a significant challenge due to the availability of open-source application software. These solutions, developed and offered by organizations or communities, are free of cost and have gained popularity among organizations with limited IT budgets. The high cost of proprietary third-party risk management software has driven some organizations towards open-source alternatives. Notable open-source solutions in the market include Open PPM, OpenPro, CK-EFP, and Open Source Risk Engine (ORE). Despite their advantages, open-source applications pose risks, such as vulnerability to cyberattacks and lack of support and updates. To mitigate these risks, organizations need to implement robust identity management, vulnerability management, and contract lifecycle management practices.
    • Additionally, they must prioritize policy development, metrics reporting, business continuity planning, and technology solutions to ensure information governance and effective risk monitoring. Data analytics and scenario planning are also crucial components of an effective third-party risk management strategy. By focusing on these areas, organizations can effectively manage their third-party relationships and mitigate financial, operational, and technology risks.

    Exclusive Customer Landscape

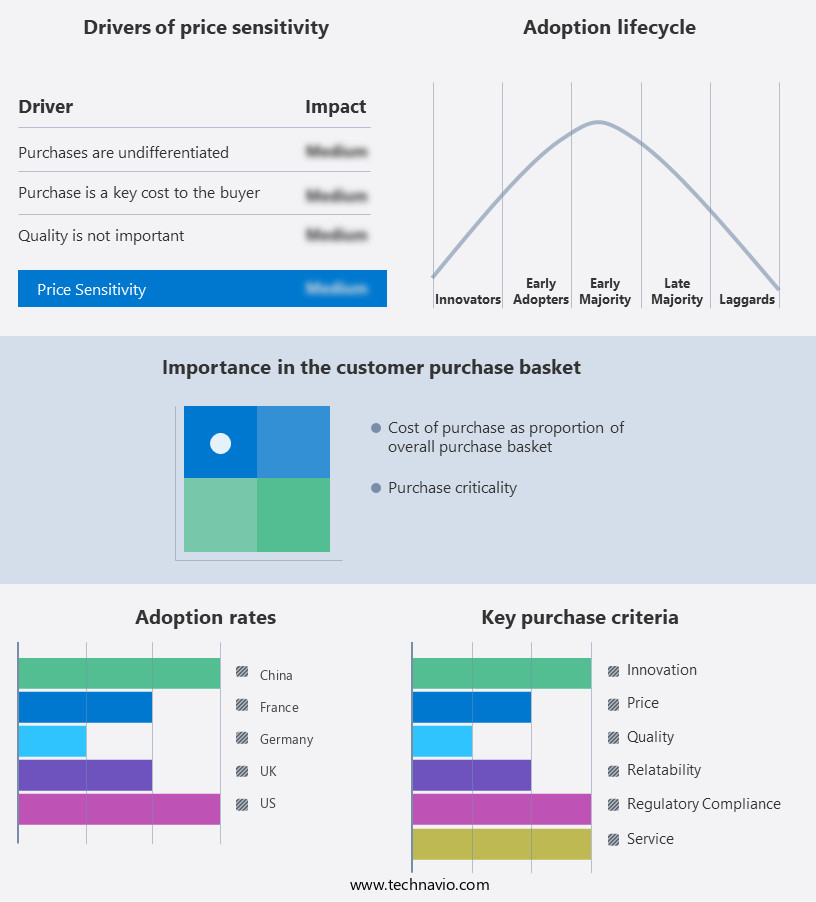
    The third-party risk management market forecasting report includes the adoption lifecycle of the market, covering from the innovator’s stage to the laggard’s stage. It focuses on adoption rates in different regions based on penetration. Furthermore, the third-party risk management market report also includes key purchase criteria and drivers of price sensitivity to help companies evaluate and develop their market growth analysis strategies.

    Third-Party Risk Management Market Share by Geography

     Customer Landscape

    Key Companies & Market Insights

    Companies are implementing various strategies, such as strategic alliances, third-party risk management market forecast, partnerships, mergers and acquisitions, geographical expansion, and product/service launches, to enhance their presence in the industry.

    Aravo Solutions Inc. - Third party risk management is crucial for businesses to secure their digital ecosystem. Our solution enables risk leaders to assess and continuously monitor third party security, safeguarding against potential threats from the outset. By measuring and mitigating risks, organizations can fortify their defensive posture and protect their valuable assets.

    The industry research and growth report includes detailed analyses of the competitive landscape of the market and information about key companies, including:

    • Aravo Solutions Inc.
    • BitSight Technologies Inc.
    • Dell Technologies Inc.
    • Deloitte Touche Tohmatsu Ltd.
    • Diligent Corp.
    • Ernst and Young Global Ltd.
    • Genpact Ltd.
    • iMedX Inc.
    • KPMG International Ltd.
    • Kroll LLC
    • MetricStream Inc.
    • NAVEX Global Inc.
    • OneTrust LLC
    • Optiv Security Inc.
    • PricewaterhouseCoopers LLP
    • ProcessUnity Inc.
    • Rapid Ratings International Inc.
    • Riskpro India Ventures Pvt. Ltd.
    • SAI360 Inc
    • Venminder Inc.

    Qualitative and quantitative analysis of companies has been conducted to help clients understand the wider business environment as well as the strengths and weaknesses of key industry players. Data is qualitatively analyzed to categorize companies as pure play, category-focused, industry-focused, and diversified; it is quantitatively analyzed to categorize companies as dominant, leading, strong, tentative, and weak.

    Recent Development and News in Third-Party Risk Management Market

    • In January 2024, Marsh McLennan (NYSE: MMC) announced the launch of its new Third-Party Risk Center of Excellence, a global hub dedicated to helping organizations manage and mitigate risks associated with third-party relationships (Marsh McLennan Press Release, 2024). This new offering is a response to the increasing importance of third-party risk management in the wake of heightened regulatory scrutiny and growing cyber threats.
    • In March 2024, Accenture (NYSE: ACN) and SAS Institute, a leading provider of advanced analytics software and services, formed a strategic partnership to offer enhanced third-party risk management solutions to clients (Accenture Press Release, 2024). This collaboration combines Accenture's expertise in risk management consulting with SAS' advanced analytics capabilities, enabling organizations to better assess and manage risks related to their third-party relationships.
    • In May 2024, FIS (NYSE: FIS) completed the acquisition of Worldpay from Fidelity National Information Services (FIS Press Release, 2024). This deal expanded FIS' capabilities in the payments industry and provided the company with Worldpay's robust third-party risk management solutions. The acquisition strengthened FIS' position in the market and enabled it to offer more comprehensive risk management services to its clients.
    • In April 2025, the European Union's General Data Protection Regulation (GDPR) was updated to include more stringent requirements for third-party data processors (EU GDPR Press Release, 2025). This policy change increased the accountability of organizations when engaging third parties to process personal data, necessitating stronger third-party risk management practices. This development underscores the growing importance of third-party risk management in the context of data privacy regulations.

    Research Analyst Overview

    • The market is experiencing significant activity and trends as businesses prioritize supply chain resilience and mitigate risks associated with data breaches and cyber attacks. Contract review processes are increasingly leveraging AI-driven risk management and machine learning to identify potential vulnerabilities and ensure policy compliance. Data encryption and cloud security are essential components of business continuity planning, with annualized loss expectancy and single loss expectancy playing crucial roles in risk assessment. Regulatory changes and compliance frameworks continue to shape the market, with company onboarding and incident management becoming more stringent. Risk scoring and agile methodologies enable organizations to effectively manage their risk appetite framework and respond to insider threats and social engineering attacks.
    • Blockchain technology and network security are also gaining traction as effective solutions for enhancing data security and reducing the risk of data breaches. Machine learning and AI are revolutionizing risk management, enabling real-time threat detection and response. Application security and cyber attacks are major concerns, with incident management and policy compliance essential for minimizing potential losses. Risk scoring and portfolio management help organizations prioritize risks and allocate resources effectively. Annualized loss expectancy and single loss expectancy are key metrics used to assess potential risks and determine appropriate risk mitigation strategies. Regulatory changes and compliance frameworks continue to evolve, requiring businesses to stay informed and adapt to new requirements.
    • company onboarding and contract review processes must be rigorous to ensure third-party risk is minimized. Network security and application security are critical components of a robust risk management strategy, with data encryption and cloud security essential for protecting sensitive information. Cyber attacks and insider threats pose significant risks, and incident management and risk scoring are essential for effective response and recovery. Businesses must adopt agile methodologies and stay informed of the latest trends and technologies to effectively manage third-party risk and ensure supply chain resilience. Risk appetite frameworks and loss expectancy calculations are essential for prioritizing risks and allocating resources effectively.
    • Regulatory changes and compliance frameworks continue to evolve, requiring ongoing attention and adaptation. Incident management and policy compliance are essential components of a comprehensive risk management strategy. Risk scoring and portfolio management enable organizations to prioritize risks and allocate resources effectively. Machine learning and AI are revolutionizing risk management, enabling real-time threat detection and response. The market is dynamic and complex, with a range of factors shaping the landscape. Supply chain resilience, data breaches, and cyber attacks are major concerns, and businesses must adopt a proactive approach to risk management to stay ahead of potential threats. Regulatory changes and compliance frameworks continue to evolve, requiring ongoing attention and adaptation.
    • Effective risk management requires a holistic approach, with a focus on supply chain resilience, data security, and regulatory compliance. Contract review and company onboarding processes must be rigorous to minimize third-party risk. Machine learning and AI are revolutionizing risk management, enabling real-time threat detection and response. The market is experiencing significant growth and innovation, driven by the need for supply chain resilience and effective risk management strategies. Data breaches and cyber attacks are major concerns, and businesses must adopt a proactive approach to risk management to minimize potential losses. Regulatory changes and compliance frameworks continue to evolve, requiring ongoing attention and adaptation.
    • In conclusion, the market is a dynamic and complex landscape, with a range of factors shaping the landscape. Supply chain resilience, data security, and regulatory compliance are essential components of effective risk management strategies. Machine learning and AI are revolutionizing risk management, enabling real-time threat detection and response. Businesses must stay informed of the latest trends and technologies to effectively manage third-party risk and ensure long-term success.

    Dive into Technavio’s robust research methodology, blending expert interviews, extensive data synthesis, and validated models for unparalleled Third-Party Risk Management Market insights. See full methodology.

    Market Scope

    Report Coverage

    Details

    Page number

    248

    Base year

    2024

    Historic period

    2019-2023

    Forecast period

    2025-2029

    Growth momentum & CAGR

    Accelerate at a CAGR of 18.5%

    Market growth 2025-2029

    USD 9784.1 million

    Market structure

    Fragmented

    YoY growth 2024-2025(%)

    16.6

    Key countries

    US, Canada, Germany, UK, China, France, Italy, Japan, India, and South Korea

    Competitive landscape

    Leading Companies, Market Positioning of Companies, Competitive Strategies, and Industry Risks

    Request Free Sample

    What are the Key Data Covered in this Third-Party Risk Management Market Research and Growth Report?

    • CAGR of the Third-Party Risk Management industry during the forecast period
    • Detailed information on factors that will drive the growth and forecasting between 2025 and 2029
    • Precise estimation of the size of the market and its contribution of the industry in focus to the parent market
    • Accurate predictions about upcoming growth and trends and changes in consumer behaviour
    • Growth of the market across North America, Europe, APAC, South America, and Middle East and Africa
    • Thorough analysis of the market’s competitive landscape and detailed information about companies
    • Comprehensive analysis of factors that will challenge the third-party risk management market growth of industry companies

    We can help! Our analysts can customize this third-party risk management market research report to meet your requirements.

    Get in touch


    1 Executive Summary

    • 1.1 Market overview
      • Executive Summary - Chart on Market Overview
      • Executive Summary - Data Table on Market Overview
      • Executive Summary - Chart on Global Market Characteristics
      • Executive Summary - Chart on Market by Geography
      • Executive Summary - Chart on Market Segmentation by Component
      • Executive Summary - Chart on Market Segmentation by Deployment
      • Executive Summary - Chart on Market Segmentation by Consumer
      • Executive Summary - Chart on Market Segmentation by End-user
      • Executive Summary - Chart on Market Segmentation by Service
      • Executive Summary - Chart on Incremental Growth
      • Executive Summary - Data Table on Incremental Growth
      • Executive Summary - Chart on Company Market Positioning

    2 Technavio Analysis

    • 2.1 Analysis of price sensitivity, lifecycle, customer purchase basket, adoption rates, and purchase criteria
      • Analysis of price sensitivity, lifecycle, customer purchase basket, adoption rates, and purchase criteria
    • 2.2 Criticality of inputs and Factors of differentiation
      • Overview on criticality of inputs and factors of differentiation
    • 2.3 Factors of disruption
      • Overview on factors of disruption
    • 2.4 Impact of drivers and challenges
      • Impact of drivers and challenges in 2024 and 2029

    3 Market Landscape

    • 3.1 Market ecosystem
      • Parent Market
      • Data Table on - Parent Market
    • 3.2 Market characteristics
      • Market characteristics analysis
    • 3.3 Value chain analysis
      • Value chain analysis

    4 Market Sizing

    • 4.1 Market definition
      • Offerings of companies included in the market definition
    • 4.2 Market segment analysis
      • Market segments
    • 4.3 Market size 2024
      • 4.4 Market outlook: Forecast for 2024-2029
        • Chart on Global - Market size and forecast 2024-2029 ($ million)
        • Data Table on Global - Market size and forecast 2024-2029 ($ million)
        • Chart on Global Market: Year-over-year growth 2024-2029 (%)
        • Data Table on Global Market: Year-over-year growth 2024-2029 (%)

      5 Historic Market Size

      • 5.1 Global Third-Party Risk Management Market 2019 - 2023
        • Historic Market Size - Data Table on Global Third-Party Risk Management Market 2019 - 2023 ($ million)
      • 5.2 Component segment analysis 2019 - 2023
        • Historic Market Size - Component Segment 2019 - 2023 ($ million)
      • 5.3 Deployment segment analysis 2019 - 2023
        • Historic Market Size - Deployment Segment 2019 - 2023 ($ million)
      • 5.4 Consumer segment analysis 2019 - 2023
        • Historic Market Size - Consumer Segment 2019 - 2023 ($ million)
      • 5.5 End-user segment analysis 2019 - 2023
        • Historic Market Size - End-user Segment 2019 - 2023 ($ million)
      • 5.6 Service segment analysis 2019 - 2023
        • Historic Market Size - Service Segment 2019 - 2023 ($ million)
      • 5.7 Geography segment analysis 2019 - 2023
        • Historic Market Size - Geography Segment 2019 - 2023 ($ million)
      • 5.8 Country segment analysis 2019 - 2023
        • Historic Market Size - Country Segment 2019 - 2023 ($ million)

      6 Qualitative Analysis

      • 6.1 AI Impact on Global Third-Party Risk Management Market

        7 Five Forces Analysis

        • 7.1 Five forces summary
          • Five forces analysis - Comparison between 2024 and 2029
        • 7.2 Bargaining power of buyers
          • Bargaining power of buyers - Impact of key factors 2024 and 2029
        • 7.3 Bargaining power of suppliers
          • Bargaining power of suppliers - Impact of key factors in 2024 and 2029
        • 7.4 Threat of new entrants
          • Threat of new entrants - Impact of key factors in 2024 and 2029
        • 7.5 Threat of substitutes
          • Threat of substitutes - Impact of key factors in 2024 and 2029
        • 7.6 Threat of rivalry
          • Threat of rivalry - Impact of key factors in 2024 and 2029
        • 7.7 Market condition
          • Chart on Market condition - Five forces 2024 and 2029

        8 Market Segmentation by Component

        • 8.1 Market segments
          • Chart on Component - Market share 2024-2029 (%)
          • Data Table on Component - Market share 2024-2029 (%)
        • 8.2 Comparison by Component
          • Chart on Comparison by Component
          • Data Table on Comparison by Component
        • 8.3 Solution - Market size and forecast 2024-2029
          • Chart on Solution - Market size and forecast 2024-2029 ($ million)
          • Data Table on Solution - Market size and forecast 2024-2029 ($ million)
          • Chart on Solution - Year-over-year growth 2024-2029 (%)
          • Data Table on Solution - Year-over-year growth 2024-2029 (%)
        • 8.4 Service - Market size and forecast 2024-2029
          • Chart on Service - Market size and forecast 2024-2029 ($ million)
          • Data Table on Service - Market size and forecast 2024-2029 ($ million)
          • Chart on Service - Year-over-year growth 2024-2029 (%)
          • Data Table on Service - Year-over-year growth 2024-2029 (%)
        • 8.5 Market opportunity by Component
          • Market opportunity by Component ($ million)
          • Data Table on Market opportunity by Component ($ million)

        9 Market Segmentation by Deployment

        • 9.1 Market segments
          • Chart on Deployment - Market share 2024-2029 (%)
          • Data Table on Deployment - Market share 2024-2029 (%)
        • 9.2 Comparison by Deployment
          • Chart on Comparison by Deployment
          • Data Table on Comparison by Deployment
        • 9.3 Cloud - Market size and forecast 2024-2029
          • Chart on Cloud - Market size and forecast 2024-2029 ($ million)
          • Data Table on Cloud - Market size and forecast 2024-2029 ($ million)
          • Chart on Cloud - Year-over-year growth 2024-2029 (%)
          • Data Table on Cloud - Year-over-year growth 2024-2029 (%)
        • 9.4 On-premises - Market size and forecast 2024-2029
          • Chart on On-premises - Market size and forecast 2024-2029 ($ million)
          • Data Table on On-premises - Market size and forecast 2024-2029 ($ million)
          • Chart on On-premises - Year-over-year growth 2024-2029 (%)
          • Data Table on On-premises - Year-over-year growth 2024-2029 (%)
        • 9.5 Market opportunity by Deployment
          • Market opportunity by Deployment ($ million)
          • Data Table on Market opportunity by Deployment ($ million)

        10 Market Segmentation by Consumer

        • 10.1 Market segments
          • Chart on Consumer - Market share 2024-2029 (%)
          • Data Table on Consumer - Market share 2024-2029 (%)
        • 10.2 Comparison by Consumer
          • Chart on Comparison by Consumer
          • Data Table on Comparison by Consumer
        • 10.3 Large enterprises - Market size and forecast 2024-2029
          • Chart on Large enterprises - Market size and forecast 2024-2029 ($ million)
          • Data Table on Large enterprises - Market size and forecast 2024-2029 ($ million)
          • Chart on Large enterprises - Year-over-year growth 2024-2029 (%)
          • Data Table on Large enterprises - Year-over-year growth 2024-2029 (%)
        • 10.4 SMEs - Market size and forecast 2024-2029
          • Chart on SMEs - Market size and forecast 2024-2029 ($ million)
          • Data Table on SMEs - Market size and forecast 2024-2029 ($ million)
          • Chart on SMEs - Year-over-year growth 2024-2029 (%)
          • Data Table on SMEs - Year-over-year growth 2024-2029 (%)
        • 10.5 Market opportunity by Consumer
          • Market opportunity by Consumer ($ million)
          • Data Table on Market opportunity by Consumer ($ million)

        11 Market Segmentation by End-user

        • 11.1 Market segments
          • Chart on End-user - Market share 2024-2029 (%)
          • Data Table on End-user - Market share 2024-2029 (%)
        • 11.2 Comparison by End-user
          • Chart on Comparison by End-user
          • Data Table on Comparison by End-user
        • 11.3 BFSI - Market size and forecast 2024-2029
          • Chart on BFSI - Market size and forecast 2024-2029 ($ million)
          • Data Table on BFSI - Market size and forecast 2024-2029 ($ million)
          • Chart on BFSI - Year-over-year growth 2024-2029 (%)
          • Data Table on BFSI - Year-over-year growth 2024-2029 (%)
        • 11.4 IT and telecom - Market size and forecast 2024-2029
          • Chart on IT and telecom - Market size and forecast 2024-2029 ($ million)
          • Data Table on IT and telecom - Market size and forecast 2024-2029 ($ million)
          • Chart on IT and telecom - Year-over-year growth 2024-2029 (%)
          • Data Table on IT and telecom - Year-over-year growth 2024-2029 (%)
        • 11.5 Healthcare - Market size and forecast 2024-2029
          • Chart on Healthcare - Market size and forecast 2024-2029 ($ million)
          • Data Table on Healthcare - Market size and forecast 2024-2029 ($ million)
          • Chart on Healthcare - Year-over-year growth 2024-2029 (%)
          • Data Table on Healthcare - Year-over-year growth 2024-2029 (%)
        • 11.6 Retail - Market size and forecast 2024-2029
          • Chart on Retail - Market size and forecast 2024-2029 ($ million)
          • Data Table on Retail - Market size and forecast 2024-2029 ($ million)
          • Chart on Retail - Year-over-year growth 2024-2029 (%)
          • Data Table on Retail - Year-over-year growth 2024-2029 (%)
        • 11.7 Others - Market size and forecast 2024-2029
          • Chart on Others - Market size and forecast 2024-2029 ($ million)
          • Data Table on Others - Market size and forecast 2024-2029 ($ million)
          • Chart on Others - Year-over-year growth 2024-2029 (%)
          • Data Table on Others - Year-over-year growth 2024-2029 (%)
        • 11.8 Market opportunity by End-user
          • Market opportunity by End-user ($ million)
          • Data Table on Market opportunity by End-user ($ million)

        12 Market Segmentation by Service

        • 12.1 Market segments
          • Chart on Service - Market share 2024-2029 (%)
          • Data Table on Service - Market share 2024-2029 (%)
        • 12.2 Comparison by Service
          • Chart on Comparison by Service
          • Data Table on Comparison by Service
        • 12.3 Professional services - Market size and forecast 2024-2029
          • Chart on Professional services - Market size and forecast 2024-2029 ($ million)
          • Data Table on Professional services - Market size and forecast 2024-2029 ($ million)
          • Chart on Professional services - Year-over-year growth 2024-2029 (%)
          • Data Table on Professional services - Year-over-year growth 2024-2029 (%)
        • 12.4 Management services - Market size and forecast 2024-2029
          • Chart on Management services - Market size and forecast 2024-2029 ($ million)
          • Data Table on Management services - Market size and forecast 2024-2029 ($ million)
          • Chart on Management services - Year-over-year growth 2024-2029 (%)
          • Data Table on Management services - Year-over-year growth 2024-2029 (%)
        • 12.5 Market opportunity by Service
          • Market opportunity by Service ($ million)
          • Data Table on Market opportunity by Service ($ million)

        13 Customer Landscape

        • 13.1 Customer landscape overview
          • Analysis of price sensitivity, lifecycle, customer purchase basket, adoption rates, and purchase criteria

        14 Geographic Landscape

        • 14.1 Geographic segmentation
          • Chart on Market share by geography 2024-2029 (%)
          • Data Table on Market share by geography 2024-2029 (%)
        • 14.2 Geographic comparison
          • Chart on Geographic comparison
          • Data Table on Geographic comparison
        • 14.3 North America - Market size and forecast 2024-2029
          • Chart on North America - Market size and forecast 2024-2029 ($ million)
          • Data Table on North America - Market size and forecast 2024-2029 ($ million)
          • Chart on North America - Year-over-year growth 2024-2029 (%)
          • Data Table on North America - Year-over-year growth 2024-2029 (%)
        • 14.4 Europe - Market size and forecast 2024-2029
          • Chart on Europe - Market size and forecast 2024-2029 ($ million)
          • Data Table on Europe - Market size and forecast 2024-2029 ($ million)
          • Chart on Europe - Year-over-year growth 2024-2029 (%)
          • Data Table on Europe - Year-over-year growth 2024-2029 (%)
        • 14.5 APAC - Market size and forecast 2024-2029
          • Chart on APAC - Market size and forecast 2024-2029 ($ million)
          • Data Table on APAC - Market size and forecast 2024-2029 ($ million)
          • Chart on APAC - Year-over-year growth 2024-2029 (%)
          • Data Table on APAC - Year-over-year growth 2024-2029 (%)
        • 14.6 South America - Market size and forecast 2024-2029
          • Chart on South America - Market size and forecast 2024-2029 ($ million)
          • Data Table on South America - Market size and forecast 2024-2029 ($ million)
          • Chart on South America - Year-over-year growth 2024-2029 (%)
          • Data Table on South America - Year-over-year growth 2024-2029 (%)
        • 14.7 Middle East and Africa - Market size and forecast 2024-2029
          • Chart on Middle East and Africa - Market size and forecast 2024-2029 ($ million)
          • Data Table on Middle East and Africa - Market size and forecast 2024-2029 ($ million)
          • Chart on Middle East and Africa - Year-over-year growth 2024-2029 (%)
          • Data Table on Middle East and Africa - Year-over-year growth 2024-2029 (%)
        • 14.8 US - Market size and forecast 2024-2029
          • Chart on US - Market size and forecast 2024-2029 ($ million)
          • Data Table on US - Market size and forecast 2024-2029 ($ million)
          • Chart on US - Year-over-year growth 2024-2029 (%)
          • Data Table on US - Year-over-year growth 2024-2029 (%)
        • 14.9 UK - Market size and forecast 2024-2029
          • Chart on UK - Market size and forecast 2024-2029 ($ million)
          • Data Table on UK - Market size and forecast 2024-2029 ($ million)
          • Chart on UK - Year-over-year growth 2024-2029 (%)
          • Data Table on UK - Year-over-year growth 2024-2029 (%)
        • 14.10 Germany - Market size and forecast 2024-2029
          • Chart on Germany - Market size and forecast 2024-2029 ($ million)
          • Data Table on Germany - Market size and forecast 2024-2029 ($ million)
          • Chart on Germany - Year-over-year growth 2024-2029 (%)
          • Data Table on Germany - Year-over-year growth 2024-2029 (%)
        • 14.11 China - Market size and forecast 2024-2029
          • Chart on China - Market size and forecast 2024-2029 ($ million)
          • Data Table on China - Market size and forecast 2024-2029 ($ million)
          • Chart on China - Year-over-year growth 2024-2029 (%)
          • Data Table on China - Year-over-year growth 2024-2029 (%)
        • 14.12 Canada - Market size and forecast 2024-2029
          • Chart on Canada - Market size and forecast 2024-2029 ($ million)
          • Data Table on Canada - Market size and forecast 2024-2029 ($ million)
          • Chart on Canada - Year-over-year growth 2024-2029 (%)
          • Data Table on Canada - Year-over-year growth 2024-2029 (%)
        • 14.13 France - Market size and forecast 2024-2029
          • Chart on France - Market size and forecast 2024-2029 ($ million)
          • Data Table on France - Market size and forecast 2024-2029 ($ million)
          • Chart on France - Year-over-year growth 2024-2029 (%)
          • Data Table on France - Year-over-year growth 2024-2029 (%)
        • 14.14 Italy - Market size and forecast 2024-2029
          • Chart on Italy - Market size and forecast 2024-2029 ($ million)
          • Data Table on Italy - Market size and forecast 2024-2029 ($ million)
          • Chart on Italy - Year-over-year growth 2024-2029 (%)
          • Data Table on Italy - Year-over-year growth 2024-2029 (%)
        • 14.15 Japan - Market size and forecast 2024-2029
          • Chart on Japan - Market size and forecast 2024-2029 ($ million)
          • Data Table on Japan - Market size and forecast 2024-2029 ($ million)
          • Chart on Japan - Year-over-year growth 2024-2029 (%)
          • Data Table on Japan - Year-over-year growth 2024-2029 (%)
        • 14.16 India - Market size and forecast 2024-2029
          • Chart on India - Market size and forecast 2024-2029 ($ million)
          • Data Table on India - Market size and forecast 2024-2029 ($ million)
          • Chart on India - Year-over-year growth 2024-2029 (%)
          • Data Table on India - Year-over-year growth 2024-2029 (%)
        • 14.17 South Korea - Market size and forecast 2024-2029
          • Chart on South Korea - Market size and forecast 2024-2029 ($ million)
          • Data Table on South Korea - Market size and forecast 2024-2029 ($ million)
          • Chart on South Korea - Year-over-year growth 2024-2029 (%)
          • Data Table on South Korea - Year-over-year growth 2024-2029 (%)
        • 14.18 Market opportunity by geography
          • Market opportunity by geography ($ million)
          • Data Tables on Market opportunity by geography ($ million)

        15 Drivers, Challenges, and Opportunity/Restraints

        • 15.1 Market drivers
          • 15.2 Market challenges
            • 15.3 Impact of drivers and challenges
              • Impact of drivers and challenges in 2024 and 2029
            • 15.4 Market opportunities/restraints

              16 Competitive Landscape

              • 16.1 Overview
                • 16.2 Competitive Landscape
                  • Overview on criticality of inputs and factors of differentiation
                • 16.3 Landscape disruption
                  • Overview on factors of disruption
                • 16.4 Industry risks
                  • Impact of key risks on business

                17 Competitive Analysis

                • 17.1 Companies profiled
                  • Companies covered
                • 17.2 Company ranking index
                  • Company ranking index
                • 17.3 Market positioning of companies
                  • Matrix on companies position and classification
                • 17.4 BitSight Technologies Inc.
                  • BitSight Technologies Inc. - Overview
                  • BitSight Technologies Inc. - Product / Service
                  • BitSight Technologies Inc. - Key offerings
                  • SWOT
                • 17.5 Dell Technologies Inc.
                  • Dell Technologies Inc. - Overview
                  • Dell Technologies Inc. - Business segments
                  • Dell Technologies Inc. - Key news
                  • Dell Technologies Inc. - Key offerings
                  • Dell Technologies Inc. - Segment focus
                  • SWOT
                • 17.6 Deloitte Touche Tohmatsu Ltd.
                  • Deloitte Touche Tohmatsu Ltd. - Overview
                  • Deloitte Touche Tohmatsu Ltd. - Product / Service
                  • Deloitte Touche Tohmatsu Ltd. - Key offerings
                  • SWOT
                • 17.7 Ernst and Young Global Ltd.
                  • Ernst and Young Global Ltd. - Overview
                  • Ernst and Young Global Ltd. - Product / Service
                  • Ernst and Young Global Ltd. - Key offerings
                  • SWOT
                • 17.8 Genpact Ltd.
                  • Genpact Ltd. - Overview
                  • Genpact Ltd. - Business segments
                  • Genpact Ltd. - Key news
                  • Genpact Ltd. - Key offerings
                  • Genpact Ltd. - Segment focus
                  • SWOT
                • 17.9 KPMG International Ltd.
                  • KPMG International Ltd. - Overview
                  • KPMG International Ltd. - Product / Service
                  • KPMG International Ltd. - Key offerings
                  • SWOT
                • 17.10 Kroll LLC
                  • Kroll LLC - Overview
                  • Kroll LLC - Product / Service
                  • Kroll LLC - Key offerings
                  • SWOT
                • 17.11 MetricStream Inc.
                  • MetricStream Inc. - Overview
                  • MetricStream Inc. - Product / Service
                  • MetricStream Inc. - Key offerings
                  • SWOT
                • 17.12 NAVEX Global Inc.
                  • NAVEX Global Inc. - Overview
                  • NAVEX Global Inc. - Product / Service
                  • NAVEX Global Inc. - Key offerings
                  • SWOT
                • 17.13 PricewaterhouseCoopers LLP
                  • PricewaterhouseCoopers LLP - Overview
                  • PricewaterhouseCoopers LLP - Product / Service
                  • PricewaterhouseCoopers LLP - Key offerings
                  • SWOT
                • 17.14 ProcessUnity Inc.
                  • ProcessUnity Inc. - Overview
                  • ProcessUnity Inc. - Product / Service
                  • ProcessUnity Inc. - Key offerings
                  • SWOT
                • 17.15 Rapid Ratings International Inc.
                  • Rapid Ratings International Inc. - Overview
                  • Rapid Ratings International Inc. - Product / Service
                  • Rapid Ratings International Inc. - Key offerings
                  • SWOT
                • 17.16 Riskpro India Ventures Pvt. Ltd.
                  • Riskpro India Ventures Pvt. Ltd. - Overview
                  • Riskpro India Ventures Pvt. Ltd. - Product / Service
                  • Riskpro India Ventures Pvt. Ltd. - Key offerings
                  • SWOT
                • 17.17 SAI360 Inc
                  • SAI360 Inc - Overview
                  • SAI360 Inc - Product / Service
                  • SAI360 Inc - Key offerings
                  • SWOT
                • 17.18 Venminder Inc.
                  • Venminder Inc. - Overview
                  • Venminder Inc. - Product / Service
                  • Venminder Inc. - Key offerings
                  • SWOT

                18 Appendix

                • 18.1 Scope of the report
                  • 18.2 Inclusions and exclusions checklist
                    • Inclusions checklist
                    • Exclusions checklist
                  • 18.3 Currency conversion rates for US$
                    • Currency conversion rates for US$
                  • 18.4 Research methodology
                    • Research methodology
                  • 18.5 Data procurement
                    • Information sources
                  • 18.6 Data validation
                    • Data validation
                  • 18.7 Validation techniques employed for market sizing
                    • Validation techniques employed for market sizing
                  • 18.8 Data synthesis
                    • Data synthesis
                  • 18.9 360 degree market analysis
                    • 360 degree market analysis
                  • 18.10 List of abbreviations
                    • List of abbreviations

                  Research Methodology

                  Technavio presents a detailed picture of the market by way of study, synthesis, and summation of data from multiple sources. The analysts have presented the various facets of the market with a particular focus on identifying the key industry influencers. The data thus presented is comprehensive, reliable, and the result of extensive research, both primary and secondary.

                  INFORMATION SOURCES

                  Primary sources

                  • Manufacturers and suppliers
                  • Channel partners
                  • Industry experts
                  • Strategic decision makers

                  Secondary sources

                  • Industry journals and periodicals
                  • Government data
                  • Financial reports of key industry players
                  • Historical data
                  • Press releases

                  DATA ANALYSIS

                  Data Synthesis

                  • Collation of data
                  • Estimation of key figures
                  • Analysis of derived insights

                  Data Validation

                  • Triangulation with data models
                  • Reference against proprietary databases
                  • Corroboration with industry experts

                  REPORT WRITING

                  Qualitative

                  • Market drivers
                  • Market challenges
                  • Market trends
                  • Five forces analysis

                  Quantitative

                  • Market size and forecast
                  • Market segmentation
                  • Geographical insights
                  • Competitive landscape

                  Interested in this report?

                  Get your sample now to see our research methodology and insights!

                  Download Now

                  Frequently Asked Questions

                  Third-Party Risk Management market growth will increase by $ 9784.1 mn during 2025-2029.

                  The Third-Party Risk Management market is expected to grow at a CAGR of 18.5% during 2025-2029.

                  Third-Party Risk Management market is segmented by Component( Solution, Service) Deployment( Cloud, On-premises) Consumer( Large enterprises, SMEs, APAC, South America, Middle East and Africa)

                  Aravo Solutions Inc., BitSight Technologies Inc., Dell Technologies Inc., Deloitte Touche Tohmatsu Ltd., Diligent Corp., Ernst and Young Global Ltd., Genpact Ltd., iMedX Inc., KPMG International Ltd., Kroll LLC, MetricStream Inc., NAVEX Global Inc., OneTrust LLC, Optiv Security Inc., PricewaterhouseCoopers LLP, ProcessUnity Inc., Rapid Ratings International Inc., Riskpro India Ventures Pvt. Ltd., SAI360 Inc, Venminder Inc. are a few of the key vendors in the Third-Party Risk Management market.

                  North America will register the highest growth rate of 38% among the other regions. Therefore, the Third-Party Risk Management market in North America is expected to garner significant business opportunities for the vendors during the forecast period.

                  US, Canada, Germany, UK, China, France, Italy, Japan, India, South Korea

                  • Benefits associated with third-party risk managementIncreasing global supply chain and hosted data is the driving factor this market.
                  • infrastructure is the driving factor this market.
                  • and services have long contributed to third-party risk owing to increasing reliance on outsourcing. Third-party risk management typically covers various areas of risk is the driving factor this market.
                  • which include cybersecurity is the driving factor this market.
                  • compliance is the driving factor this market.
                  • reputational risk is the driving factor this market.
                  • financial risk is the driving factor this market.
                  • operational risk is the driving factor this market.
                  • and strategic risk.If third-party companies are not managed properly is the driving factor this market.
                  • then organizations may face losses. Thus is the driving factor this market.
                  • to mitigate such losses and the risks associated with them is the driving factor this market.
                  • organizations have started adopting third-party risk management. Third-party risk management gives organizations an understanding of the third parties they use. It offers integration is the driving factor this market.
                  • automation is the driving factor this market.
                  • visibility is the driving factor this market.
                  • and collaboration capabilities that help to manage risk and drive the growth of the organization.Third-party risk management reduces company is the driving factor this market.
                  • supplier is the driving factor this market.
                  • and third-party risks with third-party management software or services. The software enables organizations to run compliance checks and screen companies. Therefore is the driving factor this market.
                  • it is used widely within organizations. An increase in the adoption of third-party risk management by the IT is the driving factor this market.
                  • government is the driving factor this market.
                  • and other sectors is expected to boost the growth of the global third-party risk management market during the forecast period. is the driving factor this market.

                  The Third-Party Risk Management market vendors should focus on grabbing business opportunities from the Solution segment as it accounted for the largest market share in the base year.