Tie Layer Resin Market Analysis, Size, and Forecast 2026-2030: APAC (China, Japan, and India), North America (US, Canada, and Mexico), Europe (Germany, France, and UK), Middle East and Africa (Saudi Arabia, UAE, and South Africa), South America (Brazil, Argentina, and Colombia), and Rest of World (ROW)

Tie Layer Resin Market Analysis, Size, and Forecast 2026-2030:
APAC (China, Japan, and India), North America (US, Canada, and Mexico), Europe (Germany, France, and UK), Middle East and Africa (Saudi Arabia, UAE, and South Africa), South America (Brazil, Argentina, and Colombia), and Rest of World (ROW)

Published: Jan 2026 310 Pages SKU: IRTNTR81235

Market Overview at a Glance

$330.1 Mn
Market Opportunity
3.5%
CAGR 2025 - 2030
49.9%
APAC Growth
$987.7 Mn
Reactive segment 2024

Tie Layer Resin Market Size 2026-2030

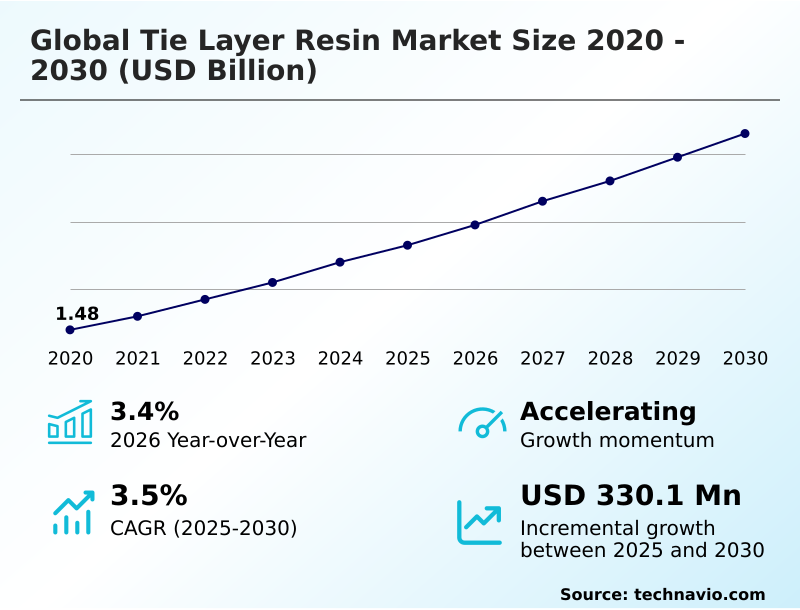
The tie layer resin market size is valued to increase by USD 330.1 million, at a CAGR of 3.5% from 2025 to 2030. Surging demand for sustainable and recyclable packaging architectures will drive the tie layer resin market.

Major Market Trends & Insights

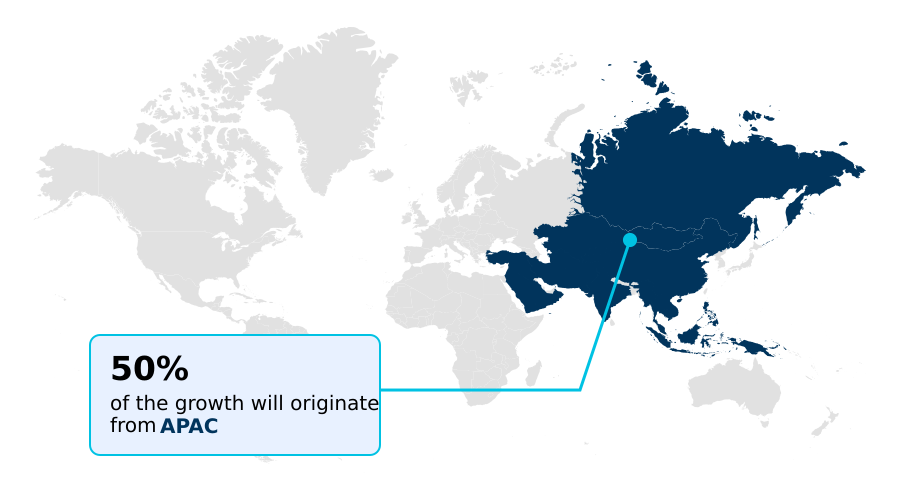
  • APAC dominated the market and accounted for a 49.9% growth during the forecast period.
  • By Product - Reactive segment was valued at USD 987.7 million in 2024
  • By Type - LLDPE segment accounted for the largest market revenue share in 2024

Market Size & Forecast

  • Market Opportunities: USD 584.8 million
  • Market Future Opportunities: USD 330.1 million
  • CAGR from 2025 to 2030 : 3.5%

Market Summary

  • The tie layer resin market is defined by its critical role in enabling complex multilayer structures across packaging and industrial sectors. These functionalized thermoplastics act as essential interfacial bonding agents, allowing the combination of materials with otherwise incompatible properties. A key driver is the industry-wide pivot toward sustainability, which necessitates recyclable mono-material packaging.
  • For instance, a food manufacturer transitioning to an all-polyolefin pouch must use a specialized tie layer to securely bond the ethylene vinyl alcohol (EVOH) oxygen barrier, ensuring product shelf life without compromising the package's recyclability. This trend is creating robust demand for advanced formulations. Simultaneously, the market is expanding into high-performance applications like automotive lightweighting and multilayer composite pipes.
  • However, producers face challenges from raw material price volatility and the technical complexities of ensuring compatibility with post-consumer recycled (PCR) content and emerging bio-polymers, which require significant R&D investment to maintain performance standards.

What will be the Size of the Tie Layer Resin Market during the forecast period?

Get Key Insights on Market Forecast (PDF) Request Free Sample

How is the Tie Layer Resin Market Segmented?

The tie layer resin industry research report provides comprehensive data (region-wise segment analysis), with forecasts and estimates in "USD million" for the period 2026-2030, as well as historical data from 2020-2024 for the following segments.

  • Product
    • Reactive
    • Non reactive
  • Type
    • LLDPE
    • LDPE
    • HDPE
    • Polypropylene (PP)
    • Others
  • End-user
    • Food and beverage
    • Pharmaceutical and medical
    • Automotive
    • Personal care
    • Others
  • Geography
    • APAC
      • China
      • Japan
      • India
    • North America
      • US
      • Canada
      • Mexico
    • Europe
      • Germany
      • France
      • UK
    • Middle East and Africa
      • Saudi Arabia
      • UAE
      • South Africa
    • South America
      • Brazil
      • Argentina
      • Colombia
    • Rest of World (ROW)

By Product Insights

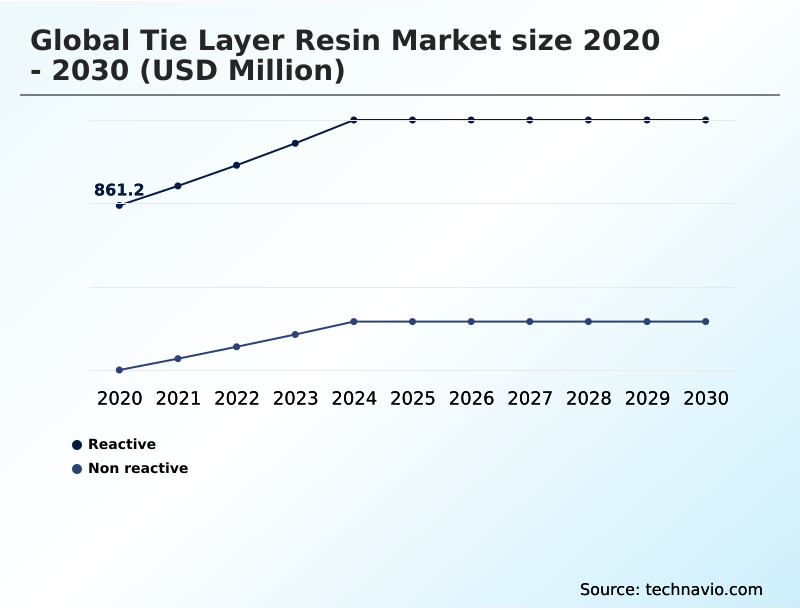
The reactive segment is estimated to witness significant growth during the forecast period.

The reactive segment is defined by functionalized thermoplastics engineered for superior performance in demanding applications. These reactive tie layers, predominantly maleic anhydride-grafted polyolefins, facilitate a robust covalent bonding mechanism at the interface of dissimilar materials.

This is critical for creating high-barrier films where delamination resistance is non-negotiable, particularly when bonding non-polar polyolefins with polar barrier substrates.

The technology is fundamental to producing resilient multilayer composite pipes for industrial use and ensuring the integrity of automotive fuel systems.

Through polymer backbone modification, these materials provide exceptional thermal stability and adhesion strength, enabling a 40% reduction in package failure rates under retort sterilization process conditions. This segment drives innovation in adhesion promoters for packaging and industrial composite pipe bonding.

Request Free Sample

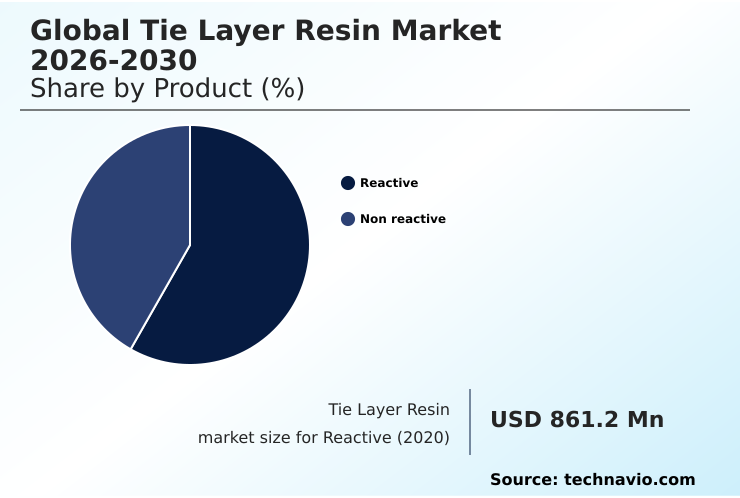
The Reactive segment was valued at USD 987.7 million in 2024 and showed a gradual increase during the forecast period.

Request Free Sample

Regional Analysis

APAC is estimated to contribute 49.9% to the growth of the global market during the forecast period.Technavio’s analysts have elaborately explained the regional trends and drivers that shape the market during the forecast period.

See How Tie Layer Resin Market Demand is Rising in APAC Request Free Sample

The geographic landscape is led by APAC, which accounts for nearly 50% of the market's incremental growth, outpacing all other regions with a growth rate of 4.3%.

This expansion is fueled by the region's vast manufacturing base for both flexible packaging compatibilizers and industrial goods. The modernization of food retail in developing economies across APAC drives demand for advanced barrier packaging solutions.

North America, with a 3.2% growth rate, focuses on innovations for recyclable mono-material structures and materials for the electric vehicle sector, including soft-touch over-molding.

Europe's market is heavily influenced by stringent regulations promoting a circular economy, prioritizing the use of sustainable packaging adhesives and materials for aseptic liquid packaging adhesion.

The development of bio-polymer adhesion technology is also most pronounced in this region, addressing consumer and regulatory demands for greener alternatives.

Market Dynamics

Our researchers analyzed the data with 2025 as the base year, along with the key drivers, trends, and challenges. A holistic analysis of drivers will help companies refine their marketing strategies to gain a competitive advantage.

  • The global tie layer resin market is evolving to meet increasingly complex demands across various sectors. A primary application remains the use of tie layer resin for food packaging, where improving adhesion in multilayer films is critical for extending shelf life and ensuring safety.
  • The development of high temperature tie layer resins has been pivotal for the growth of retortable containers, while the polypropylene tie layer for retort applications has become an industry standard.
  • In the automotive sector, the tie layer for automotive fuel tanks ensures compliance with emissions standards, and the emergence of the tie layer for EV battery cooling systems addresses new thermal management challenges. Simultaneously, sustainability is a powerful driver, pushing for recyclable mono-material packaging solutions and research into bio-based tie layer resin compostability.
  • This has led to a greater focus on using a compatibilizer for recycled PE films. Industrially, the adhesive resin for composite pipes and the tie layer for agricultural films are essential for infrastructure and food production.
  • Firms that optimized their use of high-temperature tie layer resins saw a 15% lower failure rate in sterilization processes compared to those using standard grades. From selecting the right LLDPE based tie layer properties to mastering the technique of bonding EVOH with polyethylene, technical expertise is crucial.
  • This specialization extends to medical tubing, flexible packaging, and extrusion coating, making the selection of functional polymers for industrial use a key strategic decision for manufacturers aiming to reduce delamination in packaging.

What are the key market drivers leading to the rise in the adoption of Tie Layer Resin Industry?

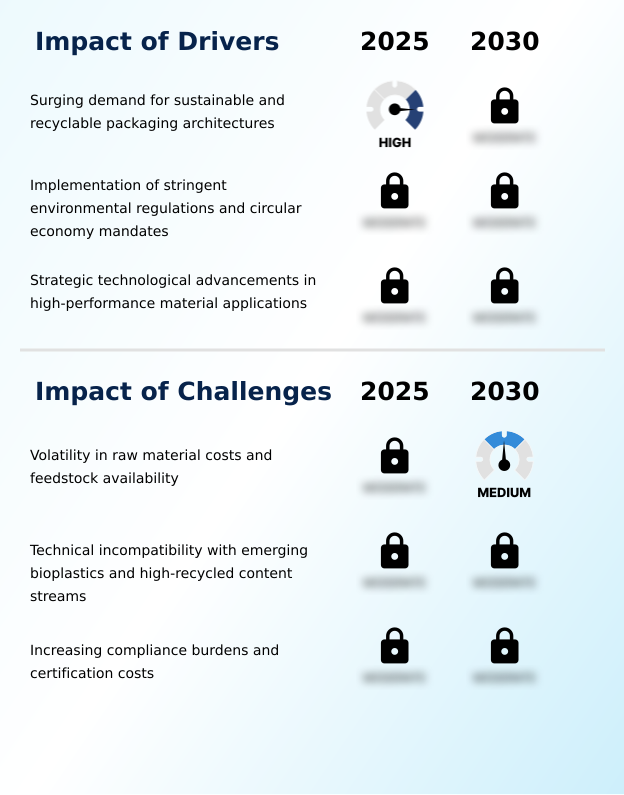
  • The market is primarily driven by the surging demand for sustainable and recyclable packaging architectures, spurred by both consumer preferences and regulatory pressures.

  • Market growth is fundamentally driven by regulatory and consumer demand for sustainability, compelling the use of advanced chemical compatibilizers.
  • New regulations mandating recycled content have spurred a 35% increase in demand for resins that can effectively incorporate post-consumer recycled (PCR) content into new products.
  • The constant evolution of material science is another powerful driver, with innovations in polymer backbone modification leading to a 15% improvement in adhesion strength for automotive lightweighting materials and industrial applications.
  • This progress enables the replacement of traditional materials with lighter, more durable composites.
  • The broad adoption of recyclable packaging formats, requiring food contact approved adhesives that also meet circular economy principles, continues to fuel demand for high-performance tie layer resins across the globe.

What are the market trends shaping the Tie Layer Resin Industry?

  • A significant trend shaping the market is the accelerated industry-wide shift toward mono-material packaging architectures. This move is driven by sustainability goals and the need for improved recyclability.

  • Key trends are reshaping the market, led by the aggressive shift to mono-material packaging, which now accounts for a significant portion of new product development, showing a 30% increase in adoption over traditional laminates. This pivot requires advanced extrudable adhesive polymers and high-performance functional polymers to maintain barrier integrity.
  • The expansion into non-packaging sectors is also notable, with applications in electric vehicles for thermal management system bonding and wire and cable shielding growing rapidly. The development of bio-based adhesive resins and bio-polymer adhesion technology represents a third major trend, driven by corporate sustainability goals.
  • These innovations have demonstrated a 50% lower carbon footprint in lifecycle assessments, offering a path to decarbonize supply chains despite current technical challenges in achieving comparable adhesion strength.

What challenges does the Tie Layer Resin Industry face during its growth?

  • A key challenge affecting market growth is the volatility in raw material costs and the inconsistent availability of essential petroleum-based feedstocks.

  • The market faces significant headwinds, primarily from the volatility of upstream feedstocks, where price fluctuations of 25% in a single quarter can severely impact the production cost of maleic anhydride-grafted polyolefins. A second major challenge is the technical incompatibility of traditional tie layers with emerging materials.
  • For instance, achieving stable adhesion with high-recycled-content streams or novel bioplastics requires substantial research, as inconsistencies in these materials can lead to a 50% increase in package delamination rates. Finally, the complex and evolving regulatory landscape creates a considerable burden.
  • The cost of securing approvals for rigid container bonding agents or new medical device multilayer tubing can be extensive, with compliance testing for novel formulations sometimes extending time-to-market by over 12 months.

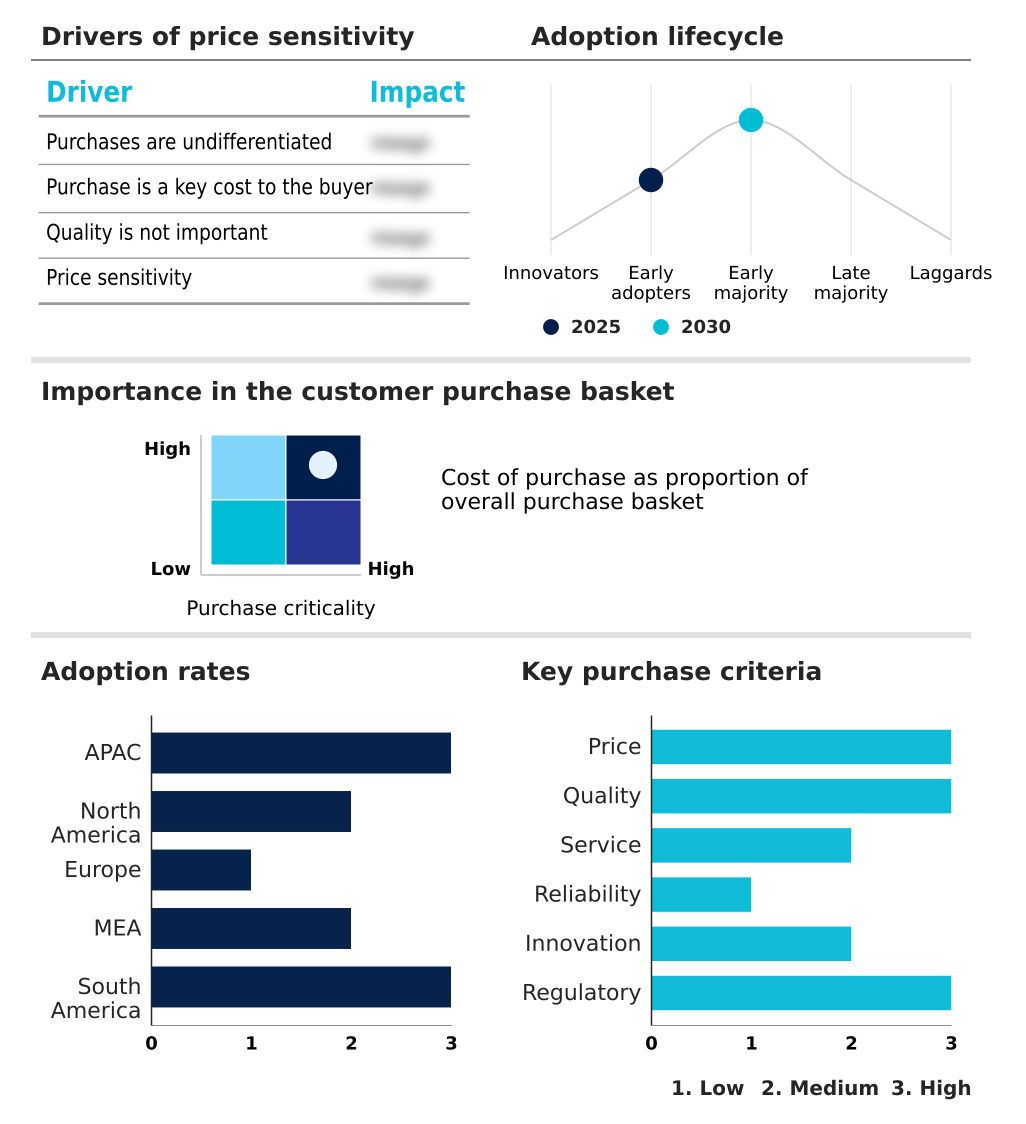
Exclusive Technavio Analysis on Customer Landscape

The tie layer resin market forecasting report includes the adoption lifecycle of the market, covering from the innovator’s stage to the laggard’s stage. It focuses on adoption rates in different regions based on penetration. Furthermore, the tie layer resin market report also includes key purchase criteria and drivers of price sensitivity to help companies evaluate and develop their market growth analysis strategies.

Customer Landscape of Tie Layer Resin Industry

Competitive Landscape

Companies are implementing various strategies, such as strategic alliances, tie layer resin market forecast, partnerships, mergers and acquisitions, geographical expansion, and product/service launches, to enhance their presence in the industry.

Arkema Group - Offers maleic anhydride-modified polyethylene and ethylene vinyl acetate (EVA) resins, enabling high-performance adhesion for multilayer packaging and various industrial applications.

The industry research and growth report includes detailed analyses of the competitive landscape of the market and information about key companies, including:

  • Arkema Group
  • BASF SE
  • Borealis AG
  • Clariant International Ltd.
  • Dow Chemical Co.
  • Eastman Chemical Co.
  • Evonik Industries AG
  • Exxon Mobil Corp.
  • LyondellBasell Industries NV
  • Mitsubishi Chemical Corp.
  • Mitsui Chemicals America Inc.
  • Saudi Basic Industries
  • The Compound Co B.V.
  • Westlake Corp.
  • Zeus Industrial

Qualitative and quantitative analysis of companies has been conducted to help clients understand the wider business environment as well as the strengths and weaknesses of key industry players. Data is qualitatively analyzed to categorize companies as pure play, category-focused, industry-focused, and diversified; it is quantitatively analyzed to categorize companies as dominant, leading, strong, tentative, and weak.

Recent Development and News in Tie layer resin market

  • In May 2025, LyondellBasell introduced Plexar PX3990, a high-performance linear low-density polyethylene tie layer resin engineered for machine direction orientation (MDO) film applications, supporting downgauging and improved processability in sustainable packaging.
  • In May 2025, Mitsui Chemicals announced a capacity expansion for its ADMER adhesive resin line in Singapore to meet rising demand for high-barrier food packaging materials in the ASEAN region.
  • In April 2025, Dow launched an extension to its RETAIN functional polymer line, specifically designed to compatibilize barrier layers within all-polyethylene pouches, enabling the production of recyclable high-barrier food packaging.
  • In February 2025, Arkema completed a capacity expansion for its Orevac adhesive resins in France, targeting the surging demand from the European electric vehicle battery market and the industrial composite pipe sector.

Dive into Technavio’s robust research methodology, blending expert interviews, extensive data synthesis, and validated models for unparalleled Tie Layer Resin Market insights. See full methodology.

Market Scope
Page number 310
Base year 2025
Historic period 2020-2024
Forecast period 2026-2030
Growth momentum & CAGR Accelerate at a CAGR of 3.5%
Market growth 2026-2030 USD 330.1 million
Market structure Fragmented
YoY growth 2025-2026(%) 3.4%
Key countries China, Japan, India, South Korea, Australia, Indonesia, US, Canada, Mexico, Germany, France, UK, Italy, Spain, The Netherlands, Saudi Arabia, UAE, South Africa, Israel, Turkey, Brazil, Argentina and Colombia
Competitive landscape Leading Companies, Market Positioning of Companies, Competitive Strategies, and Industry Risks

Request Free Sample

Research Analyst Overview

  • The tie layer resin market revolves around highly specialized extrudable adhesive polymers that function as critical interfacial bonding agents. These materials, including advanced reactive tie layers, are fundamental to manufacturing durable multilayer structures by ensuring delamination resistance between chemically dissimilar substrates.
  • Key applications for these functionalized thermoplastics range from high-barrier films for food preservation to robust automotive fuel systems and multilayer composite pipes for infrastructure. A defining market shift is the industry-wide adoption of mono-material packaging to meet sustainability mandates, which intensifies the need for sophisticated maleic anhydride-grafted polyolefins that facilitate bonding without hindering recyclability.
  • This pivot toward circularity is a boardroom-level concern, influencing investment in technologies compatible with post-consumer recycled (PCR) content and downgauging initiatives. For example, firms leveraging advanced formulations for machine direction orientation (MDO) have reported a 30% improvement in processing speeds, underscoring the link between material science innovation, operational efficiency, and strategic environmental goals.

What are the Key Data Covered in this Tie Layer Resin Market Research and Growth Report?

  • What is the expected growth of the Tie Layer Resin Market between 2026 and 2030?

    • USD 330.1 million, at a CAGR of 3.5%

  • What segmentation does the market report cover?

    • The report is segmented by Product (Reactive, and Non reactive), Type (LLDPE, LDPE, HDPE, Polypropylene (PP), and Others), End-user (Food and beverage, Pharmaceutical and medical, Automotive, Personal care, and Others) and Geography (APAC, North America, Europe, Middle East and Africa, South America)

  • Which regions are analyzed in the report?

    • APAC, North America, Europe, Middle East and Africa and South America

  • What are the key growth drivers and market challenges?

    • Surging demand for sustainable and recyclable packaging architectures, Volatility in raw material costs and feedstock availability

  • Who are the major players in the Tie Layer Resin Market?

    • Arkema Group, BASF SE, Borealis AG, Clariant International Ltd., Dow Chemical Co., Eastman Chemical Co., Evonik Industries AG, Exxon Mobil Corp., LyondellBasell Industries NV, Mitsubishi Chemical Corp., Mitsui Chemicals America Inc., Saudi Basic Industries, The Compound Co B.V., Westlake Corp. and Zeus Industrial

Market Research Insights

  • Market dynamics are shaped by a dual focus on performance and sustainability, compelling innovation in high-performance functional polymers. The adoption of advanced chemical compatibilizers has enabled a 25% increase in post-consumer recycled (PCR) content in films without compromising integrity. This push toward circular economy polymers is crucial, as new regulations increase compliance costs.
  • In industrial sectors, automotive lightweighting materials rely on these resins to bond dissimilar substrates in thermal management system bonding, where new formulations have reduced delamination rates by 40%. The demand for recyclable mono-material structures is driving a strategic shift, with converters seeking food contact approved adhesives that also meet sustainability mandates.
  • These specialized circular economy polymers are becoming essential for maintaining a competitive edge.

We can help! Our analysts can customize this tie layer resin market research report to meet your requirements.

Get in touch

1. Executive Summary

1.1 Market overview

Executive Summary - Chart on Market Overview
Executive Summary - Data Table on Market Overview
Executive Summary - Chart on Global Market Characteristics
Executive Summary - Chart on Market by Geography
Executive Summary - Chart on Market Segmentation by Product
Executive Summary - Chart on Market Segmentation by Type
Executive Summary - Chart on Market Segmentation by End-user
Executive Summary - Chart on Incremental Growth
Executive Summary - Data Table on Incremental Growth
Executive Summary - Chart on Company Market Positioning

2. Technavio Analysis

2.1 Analysis of price sensitivity, lifecycle, customer purchase basket, adoption rates, and purchase criteria

2.2 Criticality of inputs and Factors of differentiation

Chart on Overview on criticality of inputs and factors of differentiation

2.3 Factors of disruption

Chart on Overview on factors of disruption

2.4 Impact of drivers and challenges

Chart on Impact of drivers and challenges in 2025 and 2030

3. Market Landscape

3.1 Market ecosystem

Chart on Parent Market
Data Table on - Parent Market

3.2 Market characteristics

Chart on Market characteristics analysis

3.3 Value chain analysis

Chart on Value chain analysis

4. Market Sizing

4.1 Market definition

Data Table on Offerings of companies included in the market definition

4.2 Market segment analysis

Market segments

4.3 Market size 2025

4.4 Market outlook: Forecast for 2025-2030

Chart on Global - Market size and forecast 2025-2030 ($ million)
Data Table on Global - Market size and forecast 2025-2030 ($ million)
Chart on Global Market: Year-over-year growth 2025-2030 (%)
Data Table on Global Market: Year-over-year growth 2025-2030 (%)

5. Historic Market Size

5.1 Global Tie Layer Resin Market 2020 - 2024

Historic Market Size - Data Table on Global Tie Layer Resin Market 2020 - 2024 ($ million)

5.2 Product segment analysis 2020 - 2024

Historic Market Size - Product Segment 2020 - 2024 ($ million)

5.3 Type segment analysis 2020 - 2024

Historic Market Size - Type Segment 2020 - 2024 ($ million)

5.4 End-user segment analysis 2020 - 2024

Historic Market Size - End-user Segment 2020 - 2024 ($ million)

5.5 Geography segment analysis 2020 - 2024

Historic Market Size - Geography Segment 2020 - 2024 ($ million)

5.6 Country segment analysis 2020 - 2024

Historic Market Size - Country Segment 2020 - 2024 ($ million)

6. Qualitative Analysis

6.1 Impact of AI in global tie layer resin market

7. Five Forces Analysis

7.1 Five forces summary

Five forces analysis - Comparison between 2025 and 2030

7.2 Bargaining power of buyers

Bargaining power of buyers - Impact of key factors 2025 and 2030

7.3 Bargaining power of suppliers

Bargaining power of suppliers - Impact of key factors in 2025 and 2030

7.4 Threat of new entrants

Threat of new entrants - Impact of key factors in 2025 and 2030

7.5 Threat of substitutes

Threat of substitutes - Impact of key factors in 2025 and 2030

7.6 Threat of rivalry

Threat of rivalry - Impact of key factors in 2025 and 2030

7.7 Market condition

Chart on Market condition - Five forces 2025 and 2030

8. Market Segmentation by Product

8.1 Market segments

Chart on Product - Market share 2025-2030 (%)
Data Table on Product - Market share 2025-2030 (%)

8.2 Comparison by Product

Chart on Comparison by Product
Data Table on Comparison by Product

8.3 Reactive - Market size and forecast 2025-2030

Chart on Reactive - Market size and forecast 2025-2030 ($ million)
Data Table on Reactive - Market size and forecast 2025-2030 ($ million)
Chart on Reactive - Year-over-year growth 2025-2030 (%)
Data Table on Reactive - Year-over-year growth 2025-2030 (%)

8.4 Non reactive - Market size and forecast 2025-2030

Chart on Non reactive - Market size and forecast 2025-2030 ($ million)
Data Table on Non reactive - Market size and forecast 2025-2030 ($ million)
Chart on Non reactive - Year-over-year growth 2025-2030 (%)
Data Table on Non reactive - Year-over-year growth 2025-2030 (%)

8.5 Market opportunity by Product

Market opportunity by Product ($ million)
Data Table on Market opportunity by Product ($ million)

9. Market Segmentation by Type

9.1 Market segments

Chart on Type - Market share 2025-2030 (%)
Data Table on Type - Market share 2025-2030 (%)

9.2 Comparison by Type

Chart on Comparison by Type
Data Table on Comparison by Type

9.3 LLDPE - Market size and forecast 2025-2030

Chart on LLDPE - Market size and forecast 2025-2030 ($ million)
Data Table on LLDPE - Market size and forecast 2025-2030 ($ million)
Chart on LLDPE - Year-over-year growth 2025-2030 (%)
Data Table on LLDPE - Year-over-year growth 2025-2030 (%)

9.4 LDPE - Market size and forecast 2025-2030

Chart on LDPE - Market size and forecast 2025-2030 ($ million)
Data Table on LDPE - Market size and forecast 2025-2030 ($ million)
Chart on LDPE - Year-over-year growth 2025-2030 (%)
Data Table on LDPE - Year-over-year growth 2025-2030 (%)

9.5 HDPE - Market size and forecast 2025-2030

Chart on HDPE - Market size and forecast 2025-2030 ($ million)
Data Table on HDPE - Market size and forecast 2025-2030 ($ million)
Chart on HDPE - Year-over-year growth 2025-2030 (%)
Data Table on HDPE - Year-over-year growth 2025-2030 (%)

9.6 Polypropylene (PP) - Market size and forecast 2025-2030

Chart on Polypropylene (PP) - Market size and forecast 2025-2030 ($ million)
Data Table on Polypropylene (PP) - Market size and forecast 2025-2030 ($ million)
Chart on Polypropylene (PP) - Year-over-year growth 2025-2030 (%)
Data Table on Polypropylene (PP) - Year-over-year growth 2025-2030 (%)

9.7 Others - Market size and forecast 2025-2030

Chart on Others - Market size and forecast 2025-2030 ($ million)
Data Table on Others - Market size and forecast 2025-2030 ($ million)
Chart on Others - Year-over-year growth 2025-2030 (%)
Data Table on Others - Year-over-year growth 2025-2030 (%)

9.8 Market opportunity by Type

Market opportunity by Type ($ million)
Data Table on Market opportunity by Type ($ million)

10. Market Segmentation by End-user

10.1 Market segments

Chart on End-user - Market share 2025-2030 (%)
Data Table on End-user - Market share 2025-2030 (%)

10.2 Comparison by End-user

Chart on Comparison by End-user
Data Table on Comparison by End-user

10.3 Food and beverage - Market size and forecast 2025-2030

Chart on Food and beverage - Market size and forecast 2025-2030 ($ million)
Data Table on Food and beverage - Market size and forecast 2025-2030 ($ million)
Chart on Food and beverage - Year-over-year growth 2025-2030 (%)
Data Table on Food and beverage - Year-over-year growth 2025-2030 (%)

10.4 Pharmaceutical and medical - Market size and forecast 2025-2030

Chart on Pharmaceutical and medical - Market size and forecast 2025-2030 ($ million)
Data Table on Pharmaceutical and medical - Market size and forecast 2025-2030 ($ million)
Chart on Pharmaceutical and medical - Year-over-year growth 2025-2030 (%)
Data Table on Pharmaceutical and medical - Year-over-year growth 2025-2030 (%)

10.5 Automotive - Market size and forecast 2025-2030

Chart on Automotive - Market size and forecast 2025-2030 ($ million)
Data Table on Automotive - Market size and forecast 2025-2030 ($ million)
Chart on Automotive - Year-over-year growth 2025-2030 (%)
Data Table on Automotive - Year-over-year growth 2025-2030 (%)

10.6 Personal care - Market size and forecast 2025-2030

Chart on Personal care - Market size and forecast 2025-2030 ($ million)
Data Table on Personal care - Market size and forecast 2025-2030 ($ million)
Chart on Personal care - Year-over-year growth 2025-2030 (%)
Data Table on Personal care - Year-over-year growth 2025-2030 (%)

10.7 Others - Market size and forecast 2025-2030

Chart on Others - Market size and forecast 2025-2030 ($ million)
Data Table on Others - Market size and forecast 2025-2030 ($ million)
Chart on Others - Year-over-year growth 2025-2030 (%)
Data Table on Others - Year-over-year growth 2025-2030 (%)

10.8 Market opportunity by End-user

Market opportunity by End-user ($ million)
Data Table on Market opportunity by End-user ($ million)

11. Customer Landscape

11.1 Customer landscape overview

Analysis of price sensitivity, lifecycle, customer purchase basket, adoption rates, and purchase criteria

12. Geographic Landscape

12.1 Geographic segmentation

Chart on Market share by geography 2025-2030 (%)
Data Table on Market share by geography 2025-2030 (%)

12.2 Geographic comparison

Chart on Geographic comparison
Data Table on Geographic comparison

12.3 APAC - Market size and forecast 2025-2030

Chart on APAC - Market size and forecast 2025-2030 ($ million)
Data Table on APAC - Market size and forecast 2025-2030 ($ million)
Chart on APAC - Year-over-year growth 2025-2030 (%)
Data Table on APAC - Year-over-year growth 2025-2030 (%)
Chart on Regional Comparison - APAC
Data Table on Regional Comparison - APAC

12.3.1 China - Market size and forecast 2025-2030

Chart on China - Market size and forecast 2025-2030 ($ million)
Data Table on China - Market size and forecast 2025-2030 ($ million)
Chart on China - Year-over-year growth 2025-2030 (%)
Data Table on China - Year-over-year growth 2025-2030 (%)

12.3.2 Japan - Market size and forecast 2025-2030

Chart on Japan - Market size and forecast 2025-2030 ($ million)
Data Table on Japan - Market size and forecast 2025-2030 ($ million)
Chart on Japan - Year-over-year growth 2025-2030 (%)
Data Table on Japan - Year-over-year growth 2025-2030 (%)

12.3.3 India - Market size and forecast 2025-2030

Chart on India - Market size and forecast 2025-2030 ($ million)
Data Table on India - Market size and forecast 2025-2030 ($ million)
Chart on India - Year-over-year growth 2025-2030 (%)
Data Table on India - Year-over-year growth 2025-2030 (%)

12.3.4 South Korea - Market size and forecast 2025-2030

Chart on South Korea - Market size and forecast 2025-2030 ($ million)
Data Table on South Korea - Market size and forecast 2025-2030 ($ million)
Chart on South Korea - Year-over-year growth 2025-2030 (%)
Data Table on South Korea - Year-over-year growth 2025-2030 (%)

12.3.5 Australia - Market size and forecast 2025-2030

Chart on Australia - Market size and forecast 2025-2030 ($ million)
Data Table on Australia - Market size and forecast 2025-2030 ($ million)
Chart on Australia - Year-over-year growth 2025-2030 (%)
Data Table on Australia - Year-over-year growth 2025-2030 (%)

12.3.6 Indonesia - Market size and forecast 2025-2030

Chart on Indonesia - Market size and forecast 2025-2030 ($ million)
Data Table on Indonesia - Market size and forecast 2025-2030 ($ million)
Chart on Indonesia - Year-over-year growth 2025-2030 (%)
Data Table on Indonesia - Year-over-year growth 2025-2030 (%)

12.4 North America - Market size and forecast 2025-2030

Chart on North America - Market size and forecast 2025-2030 ($ million)
Data Table on North America - Market size and forecast 2025-2030 ($ million)
Chart on North America - Year-over-year growth 2025-2030 (%)
Data Table on North America - Year-over-year growth 2025-2030 (%)
Chart on Regional Comparison - North America
Data Table on Regional Comparison - North America

12.4.1 US - Market size and forecast 2025-2030

Chart on US - Market size and forecast 2025-2030 ($ million)
Data Table on US - Market size and forecast 2025-2030 ($ million)
Chart on US - Year-over-year growth 2025-2030 (%)
Data Table on US - Year-over-year growth 2025-2030 (%)

12.4.2 Canada - Market size and forecast 2025-2030

Chart on Canada - Market size and forecast 2025-2030 ($ million)
Data Table on Canada - Market size and forecast 2025-2030 ($ million)
Chart on Canada - Year-over-year growth 2025-2030 (%)
Data Table on Canada - Year-over-year growth 2025-2030 (%)

12.4.3 Mexico - Market size and forecast 2025-2030

Chart on Mexico - Market size and forecast 2025-2030 ($ million)
Data Table on Mexico - Market size and forecast 2025-2030 ($ million)
Chart on Mexico - Year-over-year growth 2025-2030 (%)
Data Table on Mexico - Year-over-year growth 2025-2030 (%)

12.5 Europe - Market size and forecast 2025-2030

Chart on Europe - Market size and forecast 2025-2030 ($ million)
Data Table on Europe - Market size and forecast 2025-2030 ($ million)
Chart on Europe - Year-over-year growth 2025-2030 (%)
Data Table on Europe - Year-over-year growth 2025-2030 (%)
Chart on Regional Comparison - Europe
Data Table on Regional Comparison - Europe

12.5.1 Germany - Market size and forecast 2025-2030

Chart on Germany - Market size and forecast 2025-2030 ($ million)
Data Table on Germany - Market size and forecast 2025-2030 ($ million)
Chart on Germany - Year-over-year growth 2025-2030 (%)
Data Table on Germany - Year-over-year growth 2025-2030 (%)

12.5.2 France - Market size and forecast 2025-2030

Chart on France - Market size and forecast 2025-2030 ($ million)
Data Table on France - Market size and forecast 2025-2030 ($ million)
Chart on France - Year-over-year growth 2025-2030 (%)
Data Table on France - Year-over-year growth 2025-2030 (%)

12.5.3 UK - Market size and forecast 2025-2030

Chart on UK - Market size and forecast 2025-2030 ($ million)
Data Table on UK - Market size and forecast 2025-2030 ($ million)
Chart on UK - Year-over-year growth 2025-2030 (%)
Data Table on UK - Year-over-year growth 2025-2030 (%)

12.5.4 Italy - Market size and forecast 2025-2030

Chart on Italy - Market size and forecast 2025-2030 ($ million)
Data Table on Italy - Market size and forecast 2025-2030 ($ million)
Chart on Italy - Year-over-year growth 2025-2030 (%)
Data Table on Italy - Year-over-year growth 2025-2030 (%)

12.5.5 Spain - Market size and forecast 2025-2030

Chart on Spain - Market size and forecast 2025-2030 ($ million)
Data Table on Spain - Market size and forecast 2025-2030 ($ million)
Chart on Spain - Year-over-year growth 2025-2030 (%)
Data Table on Spain - Year-over-year growth 2025-2030 (%)

12.5.6 The Netherlands - Market size and forecast 2025-2030

Chart on The Netherlands - Market size and forecast 2025-2030 ($ million)
Data Table on The Netherlands - Market size and forecast 2025-2030 ($ million)
Chart on The Netherlands - Year-over-year growth 2025-2030 (%)
Data Table on The Netherlands - Year-over-year growth 2025-2030 (%)

12.6 Middle East and Africa - Market size and forecast 2025-2030

Chart on Middle East and Africa - Market size and forecast 2025-2030 ($ million)
Data Table on Middle East and Africa - Market size and forecast 2025-2030 ($ million)
Chart on Middle East and Africa - Year-over-year growth 2025-2030 (%)
Data Table on Middle East and Africa - Year-over-year growth 2025-2030 (%)
Chart on Regional Comparison - Middle East and Africa
Data Table on Regional Comparison - Middle East and Africa

12.6.1 Saudi Arabia - Market size and forecast 2025-2030

Chart on Saudi Arabia - Market size and forecast 2025-2030 ($ million)
Data Table on Saudi Arabia - Market size and forecast 2025-2030 ($ million)
Chart on Saudi Arabia - Year-over-year growth 2025-2030 (%)
Data Table on Saudi Arabia - Year-over-year growth 2025-2030 (%)

12.6.2 UAE - Market size and forecast 2025-2030

Chart on UAE - Market size and forecast 2025-2030 ($ million)
Data Table on UAE - Market size and forecast 2025-2030 ($ million)
Chart on UAE - Year-over-year growth 2025-2030 (%)
Data Table on UAE - Year-over-year growth 2025-2030 (%)

12.6.3 South Africa - Market size and forecast 2025-2030

Chart on South Africa - Market size and forecast 2025-2030 ($ million)
Data Table on South Africa - Market size and forecast 2025-2030 ($ million)
Chart on South Africa - Year-over-year growth 2025-2030 (%)
Data Table on South Africa - Year-over-year growth 2025-2030 (%)

12.6.4 Israel - Market size and forecast 2025-2030

Chart on Israel - Market size and forecast 2025-2030 ($ million)
Data Table on Israel - Market size and forecast 2025-2030 ($ million)
Chart on Israel - Year-over-year growth 2025-2030 (%)
Data Table on Israel - Year-over-year growth 2025-2030 (%)

12.6.5 Turkey - Market size and forecast 2025-2030

Chart on Turkey - Market size and forecast 2025-2030 ($ million)
Data Table on Turkey - Market size and forecast 2025-2030 ($ million)
Chart on Turkey - Year-over-year growth 2025-2030 (%)
Data Table on Turkey - Year-over-year growth 2025-2030 (%)

12.7 South America - Market size and forecast 2025-2030

Chart on South America - Market size and forecast 2025-2030 ($ million)
Data Table on South America - Market size and forecast 2025-2030 ($ million)
Chart on South America - Year-over-year growth 2025-2030 (%)
Data Table on South America - Year-over-year growth 2025-2030 (%)
Chart on Regional Comparison - South America
Data Table on Regional Comparison - South America

12.7.1 Brazil - Market size and forecast 2025-2030

Chart on Brazil - Market size and forecast 2025-2030 ($ million)
Data Table on Brazil - Market size and forecast 2025-2030 ($ million)
Chart on Brazil - Year-over-year growth 2025-2030 (%)
Data Table on Brazil - Year-over-year growth 2025-2030 (%)

12.7.2 Argentina - Market size and forecast 2025-2030

Chart on Argentina - Market size and forecast 2025-2030 ($ million)
Data Table on Argentina - Market size and forecast 2025-2030 ($ million)
Chart on Argentina - Year-over-year growth 2025-2030 (%)
Data Table on Argentina - Year-over-year growth 2025-2030 (%)

12.7.3 Colombia - Market size and forecast 2025-2030

Chart on Colombia - Market size and forecast 2025-2030 ($ million)
Data Table on Colombia - Market size and forecast 2025-2030 ($ million)
Chart on Colombia - Year-over-year growth 2025-2030 (%)
Data Table on Colombia - Year-over-year growth 2025-2030 (%)

12.8 Market opportunity by geography

Market opportunity by geography ($ million)
Data Tables on Market opportunity by geography ($ million)

13. Drivers, Challenges, and Opportunity

13.1 Market drivers

Surging demand for sustainable and recyclable packaging architectures
Implementation of stringent environmental regulations and circular economy mandates
Strategic technological advancements in high-performance material applications

13.2 Market challenges

Volatility in raw material costs and feedstock availability
Technical incompatibility with emerging bioplastics and high-recycled content streams
Increasing compliance burdens and certification costs

13.3 Impact of drivers and challenges

Impact of drivers and challenges in 2025 and 2030

13.4 Market opportunities

Acceleration toward mono-material packaging architectures
Expansion of applications in electric vehicle and industrial sectors
Development of bio-based and compostable tie layer solutions

14. Competitive Landscape

14.1 Overview

14.2

Overview on criticality of inputs and factors of differentiation

14.3 Landscape disruption

Overview on factors of disruption

14.4 Industry risks

Impact of key risks on business

15. Competitive Analysis

15.1 Companies profiled

Companies covered

15.2 Company ranking index

15.3 Market positioning of companies

Matrix on companies position and classification

15.4 Arkema Group

Arkema Group - Overview
Arkema Group - Business segments
Arkema Group - Key news
Arkema Group - Key offerings
Arkema Group - Segment focus
SWOT

15.5 BASF SE

BASF SE - Overview
BASF SE - Business segments
BASF SE - Key news
BASF SE - Key offerings
BASF SE - Segment focus
SWOT

15.6 Borealis AG

Borealis AG - Overview
Borealis AG - Business segments
Borealis AG - Key offerings
Borealis AG - Segment focus
SWOT

15.7 Clariant International Ltd.

Clariant International Ltd. - Overview
Clariant International Ltd. - Business segments
Clariant International Ltd. - Key news
Clariant International Ltd. - Key offerings
Clariant International Ltd. - Segment focus
SWOT

15.8 Dow Chemical Co.

Dow Chemical Co. - Overview
Dow Chemical Co. - Business segments
Dow Chemical Co. - Key news
Dow Chemical Co. - Key offerings
Dow Chemical Co. - Segment focus
SWOT

15.9 Eastman Chemical Co.

Eastman Chemical Co. - Overview
Eastman Chemical Co. - Business segments
Eastman Chemical Co. - Key news
Eastman Chemical Co. - Key offerings
Eastman Chemical Co. - Segment focus
SWOT

15.10 Evonik Industries AG

Evonik Industries AG - Overview
Evonik Industries AG - Business segments
Evonik Industries AG - Key news
Evonik Industries AG - Key offerings
Evonik Industries AG - Segment focus
SWOT

15.11 Exxon Mobil Corp.

Exxon Mobil Corp. - Overview
Exxon Mobil Corp. - Product / Service
Exxon Mobil Corp. - Key offerings
SWOT

15.12 LyondellBasell Industries NV

LyondellBasell Industries NV - Overview
LyondellBasell Industries NV - Business segments
LyondellBasell Industries NV - Key news
LyondellBasell Industries NV - Key offerings
LyondellBasell Industries NV - Segment focus
SWOT

15.13 Mitsubishi Chemical Corp.

Mitsubishi Chemical Corp. - Overview
Mitsubishi Chemical Corp. - Business segments
Mitsubishi Chemical Corp. - Key offerings
Mitsubishi Chemical Corp. - Segment focus
SWOT

15.14 Mitsui Chemicals America Inc.

Mitsui Chemicals America Inc. - Overview
Mitsui Chemicals America Inc. - Product / Service
Mitsui Chemicals America Inc. - Key offerings
SWOT

15.15 Saudi Basic Industries

Saudi Basic Industries - Overview
Saudi Basic Industries - Business segments
Saudi Basic Industries - Key offerings
Saudi Basic Industries - Segment focus
SWOT

15.16 The Compound Co B.V.

The Compound Co B.V. - Overview
The Compound Co B.V. - Product / Service
The Compound Co B.V. - Key offerings
SWOT

15.17 Westlake Corp.

Westlake Corp. - Overview
Westlake Corp. - Business segments
Westlake Corp. - Key offerings
Westlake Corp. - Segment focus
SWOT

15.18 Zeus Industrial

Zeus Industrial - Overview
Zeus Industrial - Product / Service
Zeus Industrial - Key offerings
SWOT

16. Appendix

16.1 Scope of the report

Market definition
Objectives
Notes and caveats

16.2 Inclusions and exclusions checklist

Inclusions checklist
Exclusions checklist

16.3 Currency conversion rates for US$

16.4 Research methodology

16.5 Data procurement

Information sources

16.6 Data validation

16.7 Validation techniques employed for market sizing

16.8 Data synthesis

16.9 360 degree market analysis

16.10 List of abbreviations

Research Methodology

Technavio presents a detailed picture of the market by way of study, synthesis, and summation of data from multiple sources. The analysts have presented the various facets of the market with a particular focus on identifying the key industry influencers. The data thus presented is comprehensive, reliable, and the result of extensive research, both primary and secondary.

INFORMATION SOURCES

Primary sources

  • Manufacturers and suppliers
  • Channel partners
  • Industry experts
  • Strategic decision makers

Secondary sources

  • Industry journals and periodicals
  • Government data
  • Financial reports of key industry players
  • Historical data
  • Press releases

DATA ANALYSIS

Data Synthesis

  • Collation of data
  • Estimation of key figures
  • Analysis of derived insights

Data Validation

  • Triangulation with data models
  • Reference against proprietary databases
  • Corroboration with industry experts

REPORT WRITING

Qualitative

  • Market drivers
  • Market challenges
  • Market trends
  • Five forces analysis

Quantitative

  • Market size and forecast
  • Market segmentation
  • Geographical insights
  • Competitive landscape

Interested in this report?

Get your sample now to see our research methodology and insights!

Download Now

Frequently Asked Questions

Tie Layer Resin market growth will increase by USD 330.1 million during 2026-2030 .

The Tie Layer Resin market is expected to grow at a CAGR of 3.5% during 2026-2030 .

Tie Layer Resin market is segmented by Product (Reactive, Non reactive) Type (LLDPE, LDPE, HDPE, Polypropylene (PP), Others) End-user (Food and beverage, Pharmaceutical and medical, Automotive, Personal care, Others)

Arkema Group, BASF SE, Borealis AG, Clariant International Ltd., Dow Chemical Co., Eastman Chemical Co., Evonik Industries AG, Exxon Mobil Corp., LyondellBasell Industries NV, Mitsubishi Chemical Corp., Mitsui Chemicals America Inc., Saudi Basic Industries, The Compound Co B.V., Westlake Corp., Zeus Industrial are a few of the key vendors in the Tie Layer Resin market.

APAC will register the highest growth rate of 49.9% among the other regions. Therefore, the Tie Layer Resin market in APAC is expected to garner significant business opportunities for the vendors during the forecast period.

China, Japan, India, South Korea, Australia, Indonesia, US, Canada, Mexico, Germany, France, UK, Italy, Spain, The Netherlands, Saudi Arabia, UAE, South Africa, Israel, Turkey, Brazil, Argentina, Colombia

  • Surging demand for sustainable and recyclable packaging architectures is the driving factor this market.

The Tie Layer Resin market vendors should focus on grabbing business opportunities from the Product segment as it accounted for the largest market share in the base year.