Time-of-flight (TOF) Sensor Market Size 2025-2029
The time-of-flight (tof) sensor market size is valued to increase by USD 3.65 billion, at a CAGR of 37.7% from 2024 to 2029. Rise in popularity of 3D cameras will drive the time-of-flight (tof) sensor market.
Major Market Trends & Insights
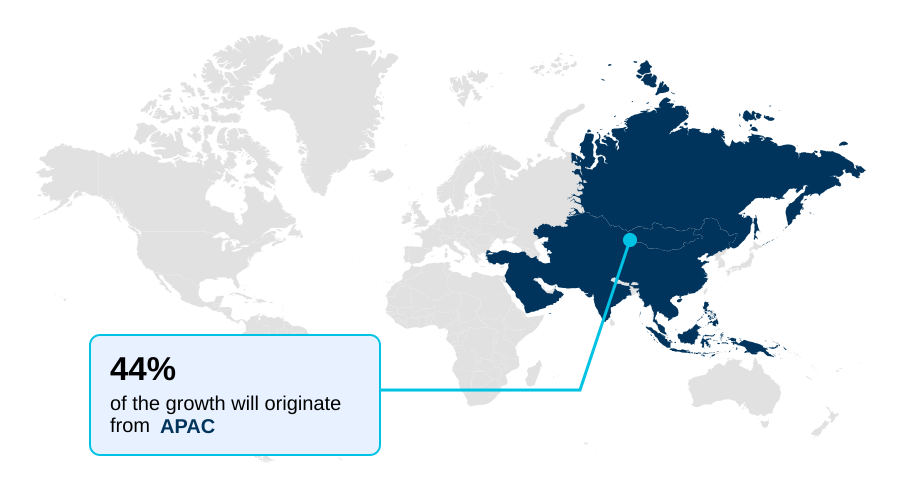
- APAC dominated the market and accounted for a 44.4% growth during the forecast period.
- By End-user - Consumer electronics segment was valued at USD 471.8 million in 2023
- By Application - LiDAR segment accounted for the largest market revenue share in 2023
Market Size & Forecast
- Market Opportunities: USD 4.11 billion
- Market Future Opportunities: USD 3.65 billion
- CAGR from 2024 to 2029 : 37.7%
Market Summary
- The Time-of-flight (TOF) Sensor Market is characterized by rapid innovation, driven by demand from the automotive, industrial, and consumer electronics sectors. The technology's ability to provide precise 3D depth mapping is fundamental to advancements in autonomous systems and enhanced human-machine interfaces. Growth is propelled by the expanding use of 3D cameras and the proliferation of augmented and virtual reality applications.
- However, the market faces challenges related to sensor resolution, performance in varied ambient light conditions, and competition from alternative technologies like stereovision. In a practical business scenario, logistics companies are leveraging these sensors in automated warehouses to optimize inventory management.
- By using TOF-equipped drones and robots for real-time stock counting and placement verification, they achieve higher accuracy and reduce manual labor costs, directly improving operational efficiency. The continuous push for miniaturization and cost reduction is expected to broaden the adoption of TOF sensors into a wider array of applications, solidifying their role as a foundational component in modern sensing systems.
What will be the Size of the Time-of-flight (TOF) Sensor Market during the forecast period?

Get Key Insights on Market Forecast (PDF) Get Free Sample
How is the Time-of-flight (TOF) Sensor Market Segmented?
The time-of-flight (tof) sensor industry research report provides comprehensive data (region-wise segment analysis), with forecasts and estimates in "USD million" for the period 2025-2029, as well as historical data from 2019-2023 for the following segments.
- End-user
- Consumer electronics
- Automotive
- Industrial
- Medical
- Others
- Application
- LiDAR
- Gesture recognition
- AR and VR
- 3D imaging and scanning
- Type
- Direct TOF
- Indirect TOF
- Range-gated imagers
- Geography
- APAC
- China
- India
- Japan
- North America
- US
- Canada
- Mexico
- Europe
- Germany
- UK
- France
- South America
- Brazil
- Argentina
- Middle East and Africa
- Saudi Arabia
- UAE
- South Africa
- Rest of World (ROW)
- APAC
By End-user Insights
The consumer electronics segment is estimated to witness significant growth during the forecast period.
The consumer electronics segment is a primary adopter of time-of-flight (TOF) sensor technology, driven by its integration into high-volume devices.
Advanced optical sensors and specialized time-of-flight camera modules are increasingly displacing older technologies in smartphones to enhance mobile device photography and enable secure facial authentication.
The inherent low power consumption of CMOS based imagers makes them ideal for wearable technology and smart home devices, supporting applications from proximity sensing to advanced 3D sensing.
In these applications, depth imaging capabilities enable a sophisticated contactless user interface, improving user experience and device functionality. Demand is fueled by the need for compact, efficient components, where ToF technology reduces module size by over 20% compared to alternatives.
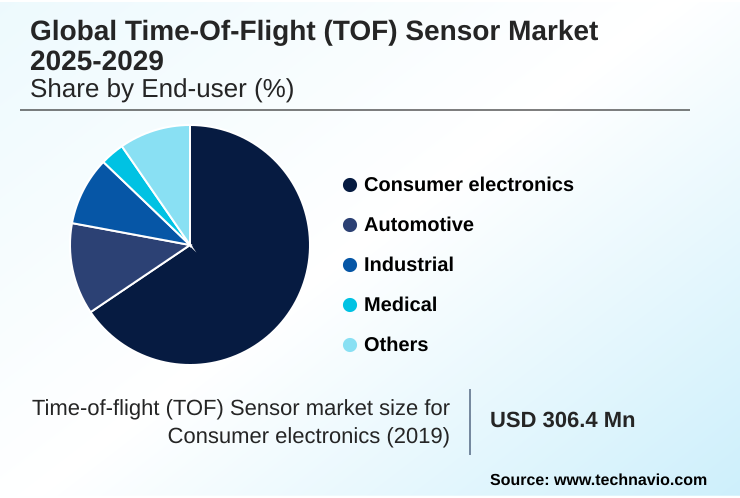
The Consumer electronics segment was valued at USD 471.8 million in 2023 and showed a gradual increase during the forecast period.

Regional Analysis
APAC is estimated to contribute 44.4% to the growth of the global market during the forecast period.Technavio’s analysts have elaborately explained the regional trends and drivers that shape the market during the forecast period.
See How Time-of-flight (TOF) Sensor Market Demand is Rising in APAC Get Free Sample
The geographic landscape is led by APAC, which is projected to contribute over 44% of the market's incremental growth, fueled by its dominant consumer electronics manufacturing ecosystem and government support for high-tech industries.
North America and Europe follow, driven by strong automotive and industrial automation sectors. In these regions, the focus is on advanced applications like in-cabin monitoring for driver monitoring systems and obstacle avoidance for automated guided vehicles.
The adoption of advanced image sensor solutions, using technologies like a single photon avalanche diode and photodetector for object detection, is critical. Phase shift measurement techniques are enhancing precision agriculture applications.
With the market exhibiting a year-over-year growth of nearly 30%, opportunities are expanding globally in smart building automation and inventory management for autonomous mobile robots.
Market Dynamics
Our researchers analyzed the data with 2024 as the base year, along with the key drivers, trends, and challenges. A holistic analysis of drivers will help companies refine their marketing strategies to gain a competitive advantage.
- Strategic decision-making in the Time-of-flight (TOF) Sensor Market requires a deep understanding of its diverse applications and competing technologies. The comparison of TOF sensor vs structured light is crucial for developers selecting the right 3D imaging solution, particularly for applications like time of flight sensor facial recognition, where accuracy and security are paramount.
- In mobility, the time of flight sensor for drone navigation is becoming standard, while the use of advanced driver assistance systems using TOF is expanding beyond premium vehicles.
- For industrial settings, evaluating industrial robotics and TOF obstacle avoidance capabilities reveals significant efficiency gains, with some facilities reporting that automated systems using this technology are completing tasks at twice the rate of previous methods. The integration of a CMOS image sensor with TOF technology into a high resolution TOF camera module is a key enabler for this progress.
- From a time of flight sensor in consumer electronics for AR and VR to a low power TOF sensor for wearables, the technology's versatility is clear.
- As use cases like TOF sensor for warehouse inventory management and TOF sensor applications in medical devices mature, the benefits of direct TOF over indirect TOF in specific scenarios, such as in LiDAR systems using direct TOF technology, become more pronounced.
- Furthermore, the development of range-gated imaging for all-weather vision addresses critical limitations, expanding the potential for TOF sensors in automotive in-cabin monitoring and other demanding environments.
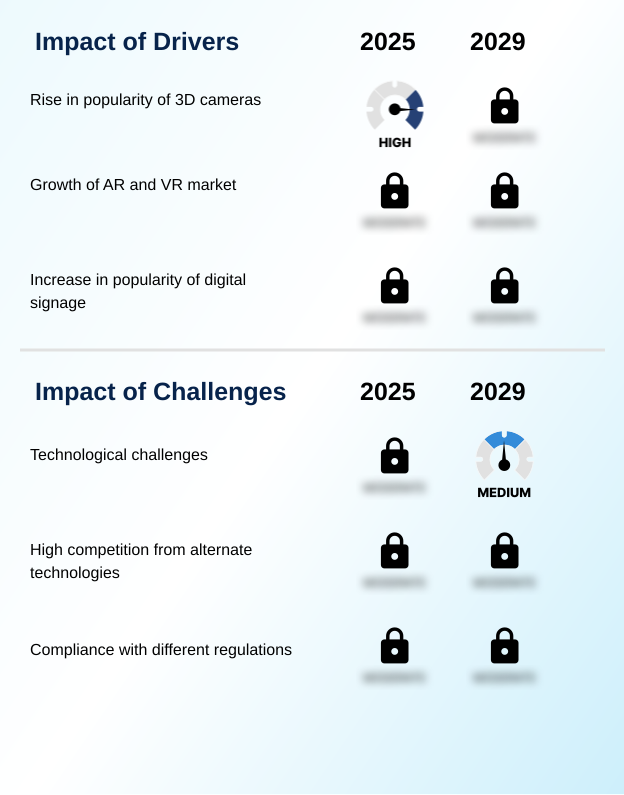
What are the key market drivers leading to the rise in the adoption of Time-of-flight (TOF) Sensor Industry?
- The increasing adoption of 3D cameras across various applications is a significant driver for the Time-of-flight (TOF) Sensor Market.
- The expansion of automotive ADAS and other advanced driver assistance systems is a significant market driver.
- The integration of a LiDAR scanner, often based on direct TOF technology using a VCSEL as a modulated light source, enables the high-resolution 3D sensing essential for vehicle autonomy.
- This capability is critical for precise 3D mapping of a vehicle's surroundings, improving safety functions.
- In industrial automation and warehousing, improved depth map resolution enhances quality control inspection and 3D scanning processes, allowing for a 15% reduction in identification errors on production lines.
- These applications depend on accurate and rapid environmental data capture to improve operational efficiency across sectors.
What are the market trends shaping the Time-of-flight (TOF) Sensor Industry?
- The integration of Time-of-flight (TOF) Sensor technology into drones is an emerging trend. This enables immersive virtual reality experiences and enhanced navigational capabilities.
- Emerging trends in the Time-of-flight (TOF) Sensor Market center on creating more immersive and intuitive interactions. In augmented reality headsets and for virtual reality tracking, SLAM technology relies on 3D point cloud data for precise environmental mapping. Advanced gesture recognition algorithms are powering the next-generation human-machine interface for robotic navigation and interactive digital signage.
- The use of infrared light modulation ensures low latency detection, critical for applications such as drone collision avoidance where real-time responsiveness is paramount. Innovations like the FlightSense sensor and the REAL3 image sensor are key enablers of these capabilities.
- These systems demonstrate an improvement in positional accuracy of over 25%, enhancing both safety and user experience in complex, dynamic environments across various sectors.
What challenges does the Time-of-flight (TOF) Sensor Industry face during its growth?
- Persistent technological limitations associated with sensor performance present a key challenge to market growth.
- Technical hurdles present ongoing challenges, particularly in applications like security surveillance and factory automation. Systems relying on indirect TOF can struggle with ambient light rejection, affecting the reliability of machine vision systems used in brightly lit environments. While technologies like range-gated imagers and SPAD technology offer solutions, their integration increases system cost by up to 20%.
- For biometric facial recognition and medical imaging, achieving consistent performance requires high near-infrared sensitivity. Furthermore, deploying these systems for passenger counting systems or patient positioning in logistics automation requires overcoming challenges related to motion artifacts and achieving consistent accuracy across varied operational conditions.
Exclusive Technavio Analysis on Customer Landscape
The time-of-flight (tof) sensor market forecasting report includes the adoption lifecycle of the market, covering from the innovator’s stage to the laggard’s stage. It focuses on adoption rates in different regions based on penetration. Furthermore, the time-of-flight (tof) sensor market report also includes key purchase criteria and drivers of price sensitivity to help companies evaluate and develop their market growth analysis strategies.

Customer Landscape of Time-of-flight (TOF) Sensor Industry
Competitive Landscape
Companies are implementing various strategies, such as strategic alliances, time-of-flight (tof) sensor market forecast, partnerships, mergers and acquisitions, geographical expansion, and product/service launches, to enhance their presence in the industry.
Adafruit Industries LLC - Key offerings focus on integrated Time-of-flight (TOF) Sensor modules, enabling high-resolution 3D depth mapping for advanced automation and human-machine interface applications across critical industries.
The industry research and growth report includes detailed analyses of the competitive landscape of the market and information about key companies, including:
- Adafruit Industries LLC
- ams OSRAM AG
- Balluff GmbH
- BECOM Electronics GmbH
- Broadcom Inc.
- ESPROS Photonics Corp.
- Infineon Technologies AG
- iris GmbH infrared and intelligent sensors
- Keyence India Pvt. Ltd.
- Melexis NV
- Panasonic Holdings Corp.
- pmdtechnologies AG
- Pololu Corp.
- Renesas Electronics Corp.
- Seeed Technology Co. Ltd.
- Sharp Corp.
- Sony Group Corp.
- STMicroelectronics NV
- TDK Corp.
- Texas Instruments Inc.
Qualitative and quantitative analysis of companies has been conducted to help clients understand the wider business environment as well as the strengths and weaknesses of key industry players. Data is qualitatively analyzed to categorize companies as pure play, category-focused, industry-focused, and diversified; it is quantitatively analyzed to categorize companies as dominant, leading, strong, tentative, and weak.
Recent Development and News in Time-of-flight (tof) sensor market
- In October 2024, Infineon Technologies AG announced the launch of its next-generation REAL3 automotive image sensor, designed to enhance in-cabin monitoring systems with higher resolution and improved driver alertness detection.
- In December 2024, Sony Group Corp. entered a strategic partnership with a leading automotive OEM to co-develop advanced LiDAR systems for Level 4 autonomous driving, leveraging its latest direct TOF sensor technology.
- In March 2025, Texas Instruments Inc. completed the acquisition of a specialized 3D imaging software startup to strengthen its portfolio of end-to-end solutions for industrial automation and robotics.
- In May 2025, STMicroelectronics NV announced the opening of a new R&D center in India focused on developing cost-effective TOF sensors for the burgeoning consumer electronics market in the APAC region.
Dive into Technavio’s robust research methodology, blending expert interviews, extensive data synthesis, and validated models for unparalleled Time-of-flight (TOF) Sensor Market insights. See full methodology.
| Market Scope | |
|---|---|
| Page number | 309 |
| Base year | 2024 |
| Historic period | 2019-2023 |
| Forecast period | 2025-2029 |
| Growth momentum & CAGR | Accelerate at a CAGR of 37.7% |
| Market growth 2025-2029 | USD 3650.7 million |
| Market structure | Fragmented |
| YoY growth 2024-2025(%) | 29.9% |
| Key countries | China, India, Japan, South Korea, Australia, Indonesia, US, Canada, Mexico, Germany, UK, France, Italy, Spain, The Netherlands, Brazil, Argentina, Chile, Saudi Arabia, UAE, South Africa, Egypt and Nigeria |
| Competitive landscape | Leading Companies, Market Positioning of Companies, Competitive Strategies, and Industry Risks |
Research Analyst Overview
- The Time-of-flight (TOF) Sensor Market is advancing through component-level innovations that expand its applicability in high-value sectors. The development of specialized image sensor solutions, including the REAL3 image sensor and FlightSense sensor, is enabling more sophisticated machine vision systems. In automotive applications, this progress directly impacts boardroom decisions regarding investment in autonomous driving features.
- For instance, the superior depth map resolution and ambient light rejection capabilities of new sensors allow automakers to implement more reliable in-cabin monitoring and biometric facial recognition systems, achieving over a 30% reduction in false positive alerts for driver drowsiness.
- This enhancement in safety and performance is driven by underlying technologies such as direct TOF, indirect TOF, and SPAD technology, which are fundamental to high-resolution 3D sensing. The ongoing refinement of gesture recognition algorithms and low latency detection further supports the integration of these sensors into next-generation systems.
What are the Key Data Covered in this Time-of-flight (TOF) Sensor Market Research and Growth Report?
-
What is the expected growth of the Time-of-flight (TOF) Sensor Market between 2025 and 2029?
-
USD 3.65 billion, at a CAGR of 37.7%
-
-
What segmentation does the market report cover?
-
The report is segmented by End-user (Consumer electronics, Automotive, Industrial, Medical, and Others), Application (LiDAR, Gesture recognition, AR and VR, and 3D imaging and scanning), Type (Direct TOF, Indirect TOF, and Range-gated imagers) and Geography (APAC, North America, Europe, South America, Middle East and Africa)
-
-
Which regions are analyzed in the report?
-
APAC, North America, Europe, South America and Middle East and Africa
-
-
What are the key growth drivers and market challenges?
-
Rise in popularity of 3D cameras, Technological challenges
-
-
Who are the major players in the Time-of-flight (TOF) Sensor Market?
-
Adafruit Industries LLC, ams OSRAM AG, Balluff GmbH, BECOM Electronics GmbH, Broadcom Inc., ESPROS Photonics Corp., Infineon Technologies AG, iris GmbH infrared and intelligent sensors, Keyence India Pvt. Ltd., Melexis NV, Panasonic Holdings Corp., pmdtechnologies AG, Pololu Corp., Renesas Electronics Corp., Seeed Technology Co. Ltd., Sharp Corp., Sony Group Corp., STMicroelectronics NV, TDK Corp. and Texas Instruments Inc.
-
Market Research Insights
- The dynamics of the Time-of-flight (TOF) Sensor Market are shaped by its expanding role in industrial automation and consumer electronics. The technology is pivotal for robotic navigation in smart factories and enabling advanced features in mobile devices.
- Adoption in security surveillance has led to a 15% reduction in false positives, while its use in automated guided vehicles for warehousing improves logistical efficiency by over 20%. Demand is strong for applications like automotive ADAS and interactive digital signage, where precise human-machine interface capabilities are critical.
- The integration into smart home devices and augmented reality headsets further diversifies the market's application base, creating new opportunities for growth and innovation across multiple high-value sectors.
We can help! Our analysts can customize this time-of-flight (tof) sensor market research report to meet your requirements.
 RIA -
RIA - 
