Titanium Mill Products Market Analysis, Size, and Forecast 2026-2030: North America (US, Canada, and Mexico), APAC (China, Japan, and India), Europe (Germany, UK, and France), Middle East and Africa (Saudi Arabia, UAE, and South Africa), South America (Brazil and Argentina), and Rest of World (ROW)

Titanium Mill Products Market Analysis, Size, and Forecast 2026-2030:
North America (US, Canada, and Mexico), APAC (China, Japan, and India), Europe (Germany, UK, and France), Middle East and Africa (Saudi Arabia, UAE, and South Africa), South America (Brazil and Argentina), and Rest of World (ROW)

Published: Apr 2026 290 Pages SKU: IRTNTR46634

Market Overview at a Glance

$686.1 Mn
Market Opportunity
3.5%
CAGR 2025 - 2030
40.4%
North America Growth
$1.57 B
Industrial segment 2024

Titanium Mill Products Market Size 2026-2030

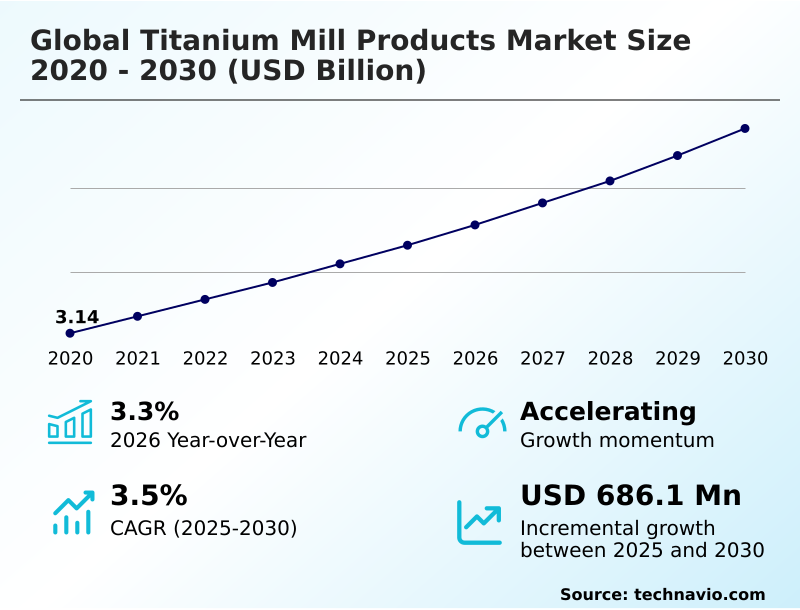
The titanium mill products market size is valued to increase by USD 686.1 million, at a CAGR of 3.5% from 2025 to 2030. Resurgent demand from aerospace and defense sectors will drive the titanium mill products market.

Major Market Trends & Insights

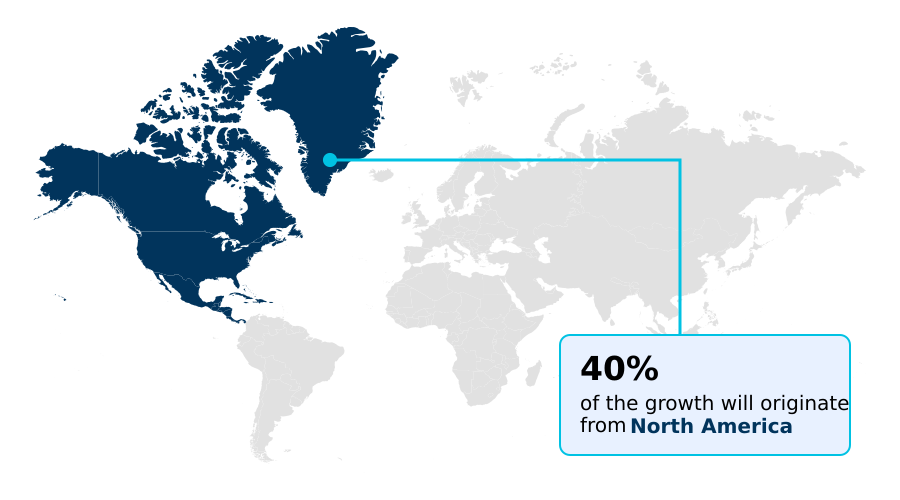
  • North America dominated the market and accounted for a 40.4% growth during the forecast period.
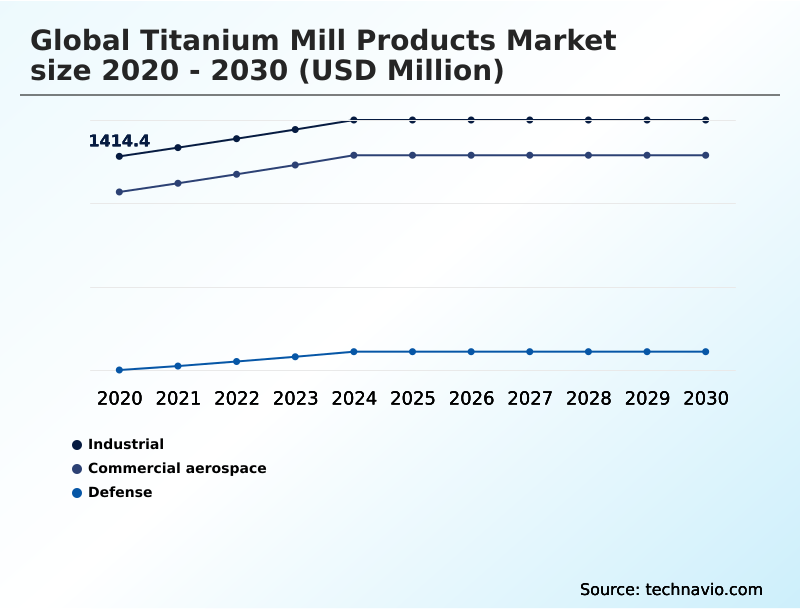
  • By End-user - Industrial segment was valued at USD 1.57 billion in 2024
  • By Product - Sheets and plates segment accounted for the largest market revenue share in 2024

Market Size & Forecast

  • Market Opportunities: USD 1.20 billion
  • Market Future Opportunities: USD 686.1 million
  • CAGR from 2025 to 2030 : 3.5%

Market Summary

  • The titanium mill products market is defined by its critical role in high-performance industries where materials must meet uncompromising standards. The market's momentum is sustained by robust demand from the aerospace sector, where the exceptional strength-to-weight ratio and corrosion resistance of titanium alloys are essential for manufacturing fuel-efficient aircraft and durable jet engines.
  • Beyond aviation, growth is fueled by expanding applications in the medical field for biocompatible implants and in industrial settings for chemical processing and desalination equipment. A key trend involves major manufacturers moving toward greater vertical integration to secure supply chains and manage costs.
  • For instance, an aerospace original equipment manufacturer might partner directly with a mill to develop a proprietary alloy and a closed-loop recycling program, ensuring material traceability and mitigating price volatility. This strategic control over the supply chain is becoming crucial.
  • However, the industry contends with challenges, including the high energy consumption of primary production and the technical difficulties of machining titanium, which tempers its adoption in more cost-sensitive sectors. Ongoing innovation in additive manufacturing and alloy development is critical to expanding the material's application envelope.

What will be the Size of the Titanium Mill Products Market during the forecast period?

Get Key Insights on Market Forecast (PDF) Request Free Sample

How is the Titanium Mill Products Market Segmented?

The titanium mill products industry research report provides comprehensive data (region-wise segment analysis), with forecasts and estimates in "USD million" for the period 2026-2030, as well as historical data from 2020-2024 for the following segments.

  • End-user
    • Industrial
    • Commercial aerospace
    • Defense
  • Product
    • Sheets and plates
    • Billets and bars
    • Others
  • Grade type
    • Titanium alloys
    • Commercially pure titanium (grades 1-4)
  • Geography
    • North America
      • US
      • Canada
      • Mexico
    • APAC
      • China
      • Japan
      • India
    • Europe
      • Germany
      • UK
      • France
    • Middle East and Africa
      • Saudi Arabia
      • UAE
      • South Africa
    • South America
      • Brazil
      • Argentina
    • Rest of World (ROW)

By End-user Insights

The industrial segment is estimated to witness significant growth during the forecast period.

The industrial segment's demand is driven by applications where material integrity is paramount. In chemical processing and across desalination facilities, commercially pure titanium is essential for fabricating durable heat exchangers and condenser tubing due to its inertness.

Its use in marine applications mitigates saltwater corrosion, directly impacting lifecycle cost analysis. In parallel, the use of titanium for biomedical devices is expanding, governed by stringent medical device regulations and quality management systems that ensure safety and performance.

This diversification, supported by robust stockholder distribution networks, highlights a shift toward sustainable manufacturing, with firms reporting equipment failure rate reductions of over 25% in corrosive environments.

Request Free Sample

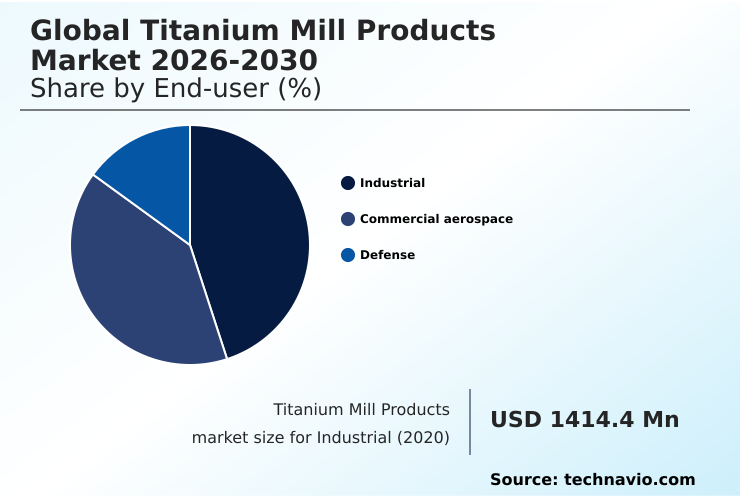
The Industrial segment was valued at USD 1.57 billion in 2024 and showed a gradual increase during the forecast period.

Request Free Sample

Regional Analysis

North America is estimated to contribute 40.4% to the growth of the global market during the forecast period.Technavio’s analysts have elaborately explained the regional trends and drivers that shape the market during the forecast period.

See How Titanium Mill Products Market Demand is Rising in North America Request Free Sample

The geographic landscape of the market for titanium mill products is concentrated in technologically advanced regions.

North America leads, driven by its massive aerospace and defense industries, which consume a vast quantity of specialized titanium alloys produced via vacuum arc remelting and electron beam melting. This region accounts for over 40% of all aerospace-grade alloy consumption.

In Europe, the focus is on high-value applications in automotive, medical, and precision engineering.

APAC, led by China and Japan, is a major hub for both production and consumption, with significant use in industrial applications and a growing demand for high-purity titanium for sputtering targets in the electronics sector.

Across these regions, advanced non-destructive testing has improved component reliability, reducing rejection rates by 12% and reinforcing the importance of quality in the global supply chain.

Market Dynamics

Our researchers analyzed the data with 2025 as the base year, along with the key drivers, trends, and challenges. A holistic analysis of drivers will help companies refine their marketing strategies to gain a competitive advantage.

  • Strategic decision-making in the titanium mill products market is increasingly complex, shaped by a confluence of technical and economic factors. A critical consideration is the high temperature performance of titanium alloys, which dictates their use in demanding aerospace applications.
  • The ongoing debate over titanium versus composites in airframe design continues, with lifecycle assessment of titanium production showing environmental benefits through recycling that composites currently lack. This has intensified the focus on the cost effective manufacturing of titanium components.
  • Central to this is the advancement of additive manufacturing techniques for titanium parts and investment casting of complex titanium shapes, which promise to reduce waste and production time. Simultaneously, efforts to improve the machinability of titanium materials are crucial, as manufacturing challenges in forging large titanium components and the complexities of welding processes for titanium structures remain significant cost drivers.
  • In the medical field, advanced titanium alloys for medical implants are being developed, with biocompatibility testing for titanium implants ensuring patient safety. In parallel, the market for recycled titanium materials is growing, supported by robust supply chain management for strategic metals.
  • This recycled feedstock is vital for industrial uses, including titanium applications in chemical processing equipment and titanium use in desalination plant technology. The emerging role of titanium in hydrogen energy systems also presents a significant future opportunity.

What are the key market drivers leading to the rise in the adoption of Titanium Mill Products Industry?

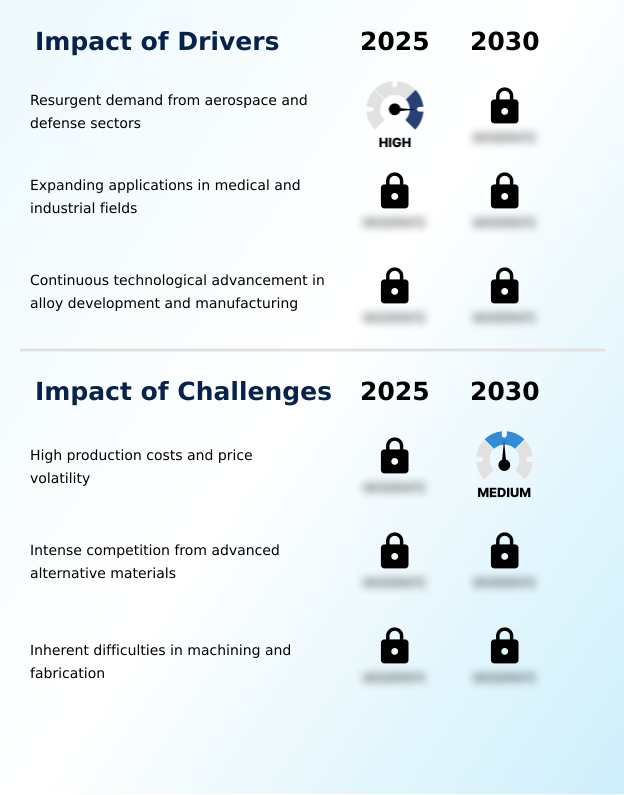
  • Resurgent demand from the aerospace and defense sectors serves as the primary driver for market growth.

  • Market growth is fundamentally driven by the material's unique properties and expanding applications in high-value sectors.
  • The unparalleled strength-to-weight ratio of titanium alloys is a primary factor in lightweighting initiatives, particularly in aerospace, enabling a 10% increase in engine thrust-to-weight ratios in some next-generation aero-engines.
  • In the medical field, its superior biocompatibility is critical for orthopedic implants and biomedical devices, where material qualification processes confirm over a 99.9% success rate in avoiding adverse biological responses.
  • This demand is bolstered by stringent medical device regulations that favor proven materials.
  • Furthermore, continuous innovation in materials like titanium aluminides and advancements in high-performance automotive parts are opening new avenues for growth beyond traditional strongholds, solidifying the market's robust trajectory.

What are the market trends shaping the Titanium Mill Products Industry?

  • A strategic focus on vertical integration is shaping the market, driven by the need to enhance supply chain security and operational control.

  • Key trends are reshaping the competitive landscape, pushing firms toward greater operational control and sustainability. A pronounced shift toward vertical integration is evident, as companies seek to mitigate geopolitical supply risk and improve supply chain security. This strategy enhances material traceability from raw material to finished product, a critical factor for aerospace and medical customers.
  • Concurrently, the circular economy is gaining traction, with an emphasis on creating robust closed-loop recycling systems. Utilizing titanium scrap recycling can reduce the energy required for production by up to 90%, a significant step for a traditionally energy-intensive industry.
  • This focus on sustainable manufacturing is driving a regionalization of supply chains, which shortens lead times by an average of 15% and builds more resilient industrial ecosystems.

What challenges does the Titanium Mill Products Industry face during its growth?

  • High production costs and significant price volatility present a key challenge to sustained industry growth.

  • Significant challenges persist, primarily related to cost, competition, and manufacturing complexity. The primary production of titanium sponge via the energy-intensive kroll process establishes a high cost floor, while fluctuating production lead times add to price instability.
  • In application, titanium faces intense competition from advanced alternatives; carbon fiber reinforced polymers and aluminum-lithium alloys can offer a 20% weight reduction in specific non-critical aerospace applications. Furthermore, the inherent difficulty in machining and fabrication, including issues like galling, requires specialized tooling and processes, with machining speeds often 50-75% slower than for alloy steels.
  • Overcoming these hurdles requires significant investment in process control automation and the development of more cost-effective manufacturing routes to expand market penetration.

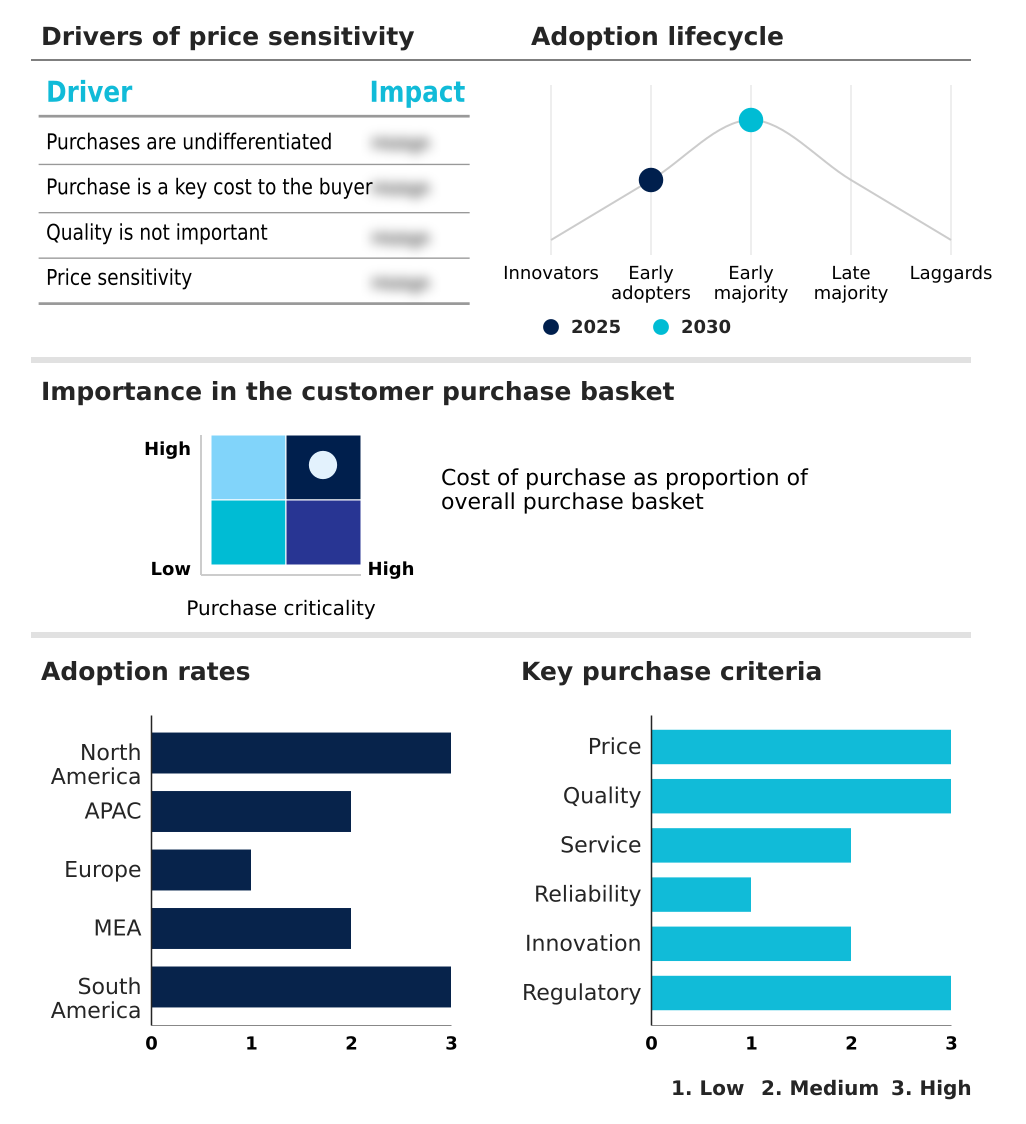
Exclusive Technavio Analysis on Customer Landscape

The titanium mill products market forecasting report includes the adoption lifecycle of the market, covering from the innovator’s stage to the laggard’s stage. It focuses on adoption rates in different regions based on penetration. Furthermore, the titanium mill products market report also includes key purchase criteria and drivers of price sensitivity to help companies evaluate and develop their market growth analysis strategies.

Customer Landscape of Titanium Mill Products Industry

Competitive Landscape

Companies are implementing various strategies, such as strategic alliances, titanium mill products market forecast, partnerships, mergers and acquisitions, geographical expansion, and product/service launches, to enhance their presence in the industry.

Acerinox SA - Provides specialized titanium mill products, including high-performance sheets and plates, for critical industrial and high-performance alloy applications.

The industry research and growth report includes detailed analyses of the competitive landscape of the market and information about key companies, including:

  • Acerinox SA
  • Allegheny Technologies Inc.
  • Auremo GmbH
  • BAOTI Group Co. Ltd.
  • EAZALL Metal Company
  • Kobe Steel Ltd.
  • Nippon Steel Corp.
  • Norsk Titanium AS
  • OSAKA Titanium Technologies
  • Precision Castparts Corp.
  • Reliance Steel and Aluminum Co.
  • Rostec State Corporation
  • Smiths Metal Centres Ltd.
  • Supra Alloys
  • Titan Engineering Pte Ltd.
  • Titanium Industries Inc.
  • Toho Titanium Co. Ltd.
  • Tricor Metals Inc.
  • United Titanium Inc.
  • WST Co. Ltd.

Qualitative and quantitative analysis of companies has been conducted to help clients understand the wider business environment as well as the strengths and weaknesses of key industry players. Data is qualitatively analyzed to categorize companies as pure play, category-focused, industry-focused, and diversified; it is quantitatively analyzed to categorize companies as dominant, leading, strong, tentative, and weak.

Recent Development and News in Titanium mill products market

  • In August 2025, ATI Inc. announced the extension and expansion of its long-term agreement with The Boeing Co. to ensure a stable supply of high-performance titanium products for all of Boeing's commercial aircraft programs.
  • In June 2025, ATI Inc. inaugurated a new, state-of-the-art production facility in South Carolina, dedicated to manufacturing advanced titanium alloy sheets to support major aerospace and defense contractors.
  • In May 2025, Titanium Industries Inc. completed its acquisition of Millennium Alloys, a strategic move intended to create a more integrated and efficient supply chain for its customer base.
  • In May 2025, VDM Metals launched a new electron beam melting production line in Germany, specifically designed to produce high-integrity titanium slabs for critical aerospace engine components.

Dive into Technavio’s robust research methodology, blending expert interviews, extensive data synthesis, and validated models for unparalleled Titanium Mill Products Market insights. See full methodology.

Market Scope
Page number 290
Base year 2025
Historic period 2020-2024
Forecast period 2026-2030
Growth momentum & CAGR Accelerate at a CAGR of 3.5%
Market growth 2026-2030 USD 686.1 million
Market structure Fragmented
YoY growth 2025-2026(%) 3.3%
Key countries US, Canada, Mexico, China, Japan, India, South Korea, Australia, Indonesia, Germany, UK, France, Italy, Spain, The Netherlands, Saudi Arabia, UAE, South Africa, Israel, Turkey, Brazil, Argentina and Chile
Competitive landscape Leading Companies, Market Positioning of Companies, Competitive Strategies, and Industry Risks

Request Free Sample

Research Analyst Overview

  • The titanium mill products market remains essential for sectors where material failure is not an option. The landscape is dominated by the production of titanium alloys and commercially pure titanium, with processes like the kroll process, vacuum arc remelting, and electron beam melting being fundamental to achieving the required purity and metallurgical properties for high-performance use.
  • The exceptional corrosion resistance, strength-to-weight ratio, and biocompatibility of the material make it indispensable for aero-engines, airframe structures, orthopedic implants, and equipment for chemical processing and desalination facilities. A significant trend is the rise of additive manufacturing, which enables the creation of complex, near-net shape parts.
  • Boardroom decisions are now centered on the high capital expenditure for this technology versus the long-term savings from reduced material waste, as adoption has been shown to reduce raw material usage by up to 90% compared to traditional machining.
  • Innovations in isothermal forging and the development of advanced titanium aluminides and beta titanium alloys are further expanding the material's application envelope.

What are the Key Data Covered in this Titanium Mill Products Market Research and Growth Report?

  • What is the expected growth of the Titanium Mill Products Market between 2026 and 2030?

    • USD 686.1 million, at a CAGR of 3.5%

  • What segmentation does the market report cover?

    • The report is segmented by End-user (Industrial, Commercial aerospace, and Defense), Product (Sheets and plates, Billets and bars, and Others), Grade Type (Titanium alloys, and Commercially pure titanium (grades 1-4)) and Geography (North America, APAC, Europe, Middle East and Africa, South America)

  • Which regions are analyzed in the report?

    • North America, APAC, Europe, Middle East and Africa and South America

  • What are the key growth drivers and market challenges?

    • Resurgent demand from aerospace and defense sectors, High production costs and price volatility

  • Who are the major players in the Titanium Mill Products Market?

    • Acerinox SA, Allegheny Technologies Inc., Auremo GmbH, BAOTI Group Co. Ltd., EAZALL Metal Company, Kobe Steel Ltd., Nippon Steel Corp., Norsk Titanium AS, OSAKA Titanium Technologies, Precision Castparts Corp., Reliance Steel and Aluminum Co., Rostec State Corporation, Smiths Metal Centres Ltd., Supra Alloys, Titan Engineering Pte Ltd., Titanium Industries Inc., Toho Titanium Co. Ltd., Tricor Metals Inc., United Titanium Inc. and WST Co. Ltd.

Market Research Insights

  • Market dynamics are increasingly shaped by strategic sourcing and operational efficiency. The emphasis on supply chain security and material traceability has become a key performance indicator, with integrated firms demonstrating a 20% lower exposure to geopolitical supply risks.
  • The adoption of a circular economy model, centered on titanium scrap recycling, is not only a sustainability initiative but also a financial one, as it can lower the energy input for material production by over 90% compared to primary processing. Firms leveraging advanced lifecycle cost analysis report a 15% improvement in long-term profitability over those focused on initial procurement costs.
  • These trends underscore a market where competitive advantage is gained through operational resilience and sustainable practices rather than purely by production volume.

We can help! Our analysts can customize this titanium mill products market research report to meet your requirements.

Get in touch

1. Executive Summary

1.1 Market overview

Executive Summary - Chart on Market Overview
Executive Summary - Data Table on Market Overview
Executive Summary - Chart on Global Market Characteristics
Executive Summary - Chart on Market by Geography
Executive Summary - Chart on Market Segmentation by End-user
Executive Summary - Chart on Market Segmentation by Product
Executive Summary - Chart on Market Segmentation by Grade Type
Executive Summary - Chart on Incremental Growth
Executive Summary - Data Table on Incremental Growth
Executive Summary - Chart on Company Market Positioning

2. Technavio Analysis

2.1 Analysis of price sensitivity, lifecycle, customer purchase basket, adoption rates, and purchase criteria

2.2 Criticality of inputs and Factors of differentiation

Chart on Overview on criticality of inputs and factors of differentiation

2.3 Factors of disruption

Chart on Overview on factors of disruption

2.4 Impact of drivers and challenges

Chart on Impact of drivers and challenges in 2025 and 2030

3. Market Landscape

3.1 Market ecosystem

Chart on Parent Market
Data Table on - Parent Market

3.2 Market characteristics

Chart on Market characteristics analysis

3.3 Value chain analysis

Chart on Value chain analysis

4. Market Sizing

4.1 Market definition

Data Table on Offerings of companies included in the market definition

4.2 Market segment analysis

Market segments

4.3 Market size 2025

4.4 Market outlook: Forecast for 2025-2030

Chart on Global - Market size and forecast 2025-2030 ($ million)
Data Table on Global - Market size and forecast 2025-2030 ($ million)
Chart on Global Market: Year-over-year growth 2025-2030 (%)
Data Table on Global Market: Year-over-year growth 2025-2030 (%)

5. Historic Market Size

5.1 Global Titanium Mill Products Market 2020 - 2024

Historic Market Size - Data Table on Global Titanium Mill Products Market 2020 - 2024 ($ million)

5.2 End-user segment analysis 2020 - 2024

Historic Market Size - End-user Segment 2020 - 2024 ($ million)

5.3 Product segment analysis 2020 - 2024

Historic Market Size - Product Segment 2020 - 2024 ($ million)

5.4 Grade Type segment analysis 2020 - 2024

Historic Market Size - Grade Type Segment 2020 - 2024 ($ million)

5.5 Geography segment analysis 2020 - 2024

Historic Market Size - Geography Segment 2020 - 2024 ($ million)

5.6 Country segment analysis 2020 - 2024

Historic Market Size - Country Segment 2020 - 2024 ($ million)

6. Qualitative Analysis

6.1 Impact of AI on global titanium mill products market

6.2 Impact of geopolitical conflicts on global titanium mill products market

7. Five Forces Analysis

7.1 Five forces summary

Five forces analysis - Comparison between 2025 and 2030

7.2 Bargaining power of buyers

Bargaining power of buyers - Impact of key factors 2025 and 2030

7.3 Bargaining power of suppliers

Bargaining power of suppliers - Impact of key factors in 2025 and 2030

7.4 Threat of new entrants

Threat of new entrants - Impact of key factors in 2025 and 2030

7.5 Threat of substitutes

Threat of substitutes - Impact of key factors in 2025 and 2030

7.6 Threat of rivalry

Threat of rivalry - Impact of key factors in 2025 and 2030

7.7 Market condition

Chart on Market condition - Five forces 2025 and 2030

8. Market Segmentation by End-user

8.1 Market segments

Chart on End-user - Market share 2025-2030 (%)
Data Table on End-user - Market share 2025-2030 (%)

8.2 Comparison by End-user

Chart on Comparison by End-user
Data Table on Comparison by End-user

8.3 Industrial - Market size and forecast 2025-2030

Chart on Industrial - Market size and forecast 2025-2030 ($ million)
Data Table on Industrial - Market size and forecast 2025-2030 ($ million)
Chart on Industrial - Year-over-year growth 2025-2030 (%)
Data Table on Industrial - Year-over-year growth 2025-2030 (%)

8.4 Commercial aerospace - Market size and forecast 2025-2030

Chart on Commercial aerospace - Market size and forecast 2025-2030 ($ million)
Data Table on Commercial aerospace - Market size and forecast 2025-2030 ($ million)
Chart on Commercial aerospace - Year-over-year growth 2025-2030 (%)
Data Table on Commercial aerospace - Year-over-year growth 2025-2030 (%)

8.5 Defense - Market size and forecast 2025-2030

Chart on Defense - Market size and forecast 2025-2030 ($ million)
Data Table on Defense - Market size and forecast 2025-2030 ($ million)
Chart on Defense - Year-over-year growth 2025-2030 (%)
Data Table on Defense - Year-over-year growth 2025-2030 (%)

8.6 Market opportunity by End-user

Market opportunity by End-user ($ million)
Data Table on Market opportunity by End-user ($ million)

9. Market Segmentation by Product

9.1 Market segments

Chart on Product - Market share 2025-2030 (%)
Data Table on Product - Market share 2025-2030 (%)

9.2 Comparison by Product

Chart on Comparison by Product
Data Table on Comparison by Product

9.3 Sheets and plates - Market size and forecast 2025-2030

Chart on Sheets and plates - Market size and forecast 2025-2030 ($ million)
Data Table on Sheets and plates - Market size and forecast 2025-2030 ($ million)
Chart on Sheets and plates - Year-over-year growth 2025-2030 (%)
Data Table on Sheets and plates - Year-over-year growth 2025-2030 (%)

9.4 Billets and bars - Market size and forecast 2025-2030

Chart on Billets and bars - Market size and forecast 2025-2030 ($ million)
Data Table on Billets and bars - Market size and forecast 2025-2030 ($ million)
Chart on Billets and bars - Year-over-year growth 2025-2030 (%)
Data Table on Billets and bars - Year-over-year growth 2025-2030 (%)

9.5 Others - Market size and forecast 2025-2030

Chart on Others - Market size and forecast 2025-2030 ($ million)
Data Table on Others - Market size and forecast 2025-2030 ($ million)
Chart on Others - Year-over-year growth 2025-2030 (%)
Data Table on Others - Year-over-year growth 2025-2030 (%)

9.6 Market opportunity by Product

Market opportunity by Product ($ million)
Data Table on Market opportunity by Product ($ million)

10. Market Segmentation by Grade Type

10.1 Market segments

Chart on Grade Type - Market share 2025-2030 (%)
Data Table on Grade Type - Market share 2025-2030 (%)

10.2 Comparison by Grade Type

Chart on Comparison by Grade Type
Data Table on Comparison by Grade Type

10.3 Titanium alloys - Market size and forecast 2025-2030

Chart on Titanium alloys - Market size and forecast 2025-2030 ($ million)
Data Table on Titanium alloys - Market size and forecast 2025-2030 ($ million)
Chart on Titanium alloys - Year-over-year growth 2025-2030 (%)
Data Table on Titanium alloys - Year-over-year growth 2025-2030 (%)

10.4 Commercially pure titanium (grades 1-4) - Market size and forecast 2025-2030

Chart on Commercially pure titanium (grades 1-4) - Market size and forecast 2025-2030 ($ million)
Data Table on Commercially pure titanium (grades 1-4) - Market size and forecast 2025-2030 ($ million)
Chart on Commercially pure titanium (grades 1-4) - Year-over-year growth 2025-2030 (%)
Data Table on Commercially pure titanium (grades 1-4) - Year-over-year growth 2025-2030 (%)

10.5 Market opportunity by Grade Type

Market opportunity by Grade Type ($ million)
Data Table on Market opportunity by Grade Type ($ million)

11. Customer Landscape

11.1 Customer landscape overview

Analysis of price sensitivity, lifecycle, customer purchase basket, adoption rates, and purchase criteria

12. Geographic Landscape

12.1 Geographic segmentation

Chart on Market share by geography 2025-2030 (%)
Data Table on Market share by geography 2025-2030 (%)

12.2 Geographic comparison

Chart on Geographic comparison
Data Table on Geographic comparison

12.3 North America - Market size and forecast 2025-2030

Chart on North America - Market size and forecast 2025-2030 ($ million)
Data Table on North America - Market size and forecast 2025-2030 ($ million)
Chart on North America - Year-over-year growth 2025-2030 (%)
Data Table on North America - Year-over-year growth 2025-2030 (%)
Chart on Regional Comparison - North America
Data Table on Regional Comparison - North America

12.3.1 US - Market size and forecast 2025-2030

Chart on US - Market size and forecast 2025-2030 ($ million)
Data Table on US - Market size and forecast 2025-2030 ($ million)
Chart on US - Year-over-year growth 2025-2030 (%)
Data Table on US - Year-over-year growth 2025-2030 (%)

12.3.2 Canada - Market size and forecast 2025-2030

Chart on Canada - Market size and forecast 2025-2030 ($ million)
Data Table on Canada - Market size and forecast 2025-2030 ($ million)
Chart on Canada - Year-over-year growth 2025-2030 (%)
Data Table on Canada - Year-over-year growth 2025-2030 (%)

12.3.3 Mexico - Market size and forecast 2025-2030

Chart on Mexico - Market size and forecast 2025-2030 ($ million)
Data Table on Mexico - Market size and forecast 2025-2030 ($ million)
Chart on Mexico - Year-over-year growth 2025-2030 (%)
Data Table on Mexico - Year-over-year growth 2025-2030 (%)

12.4 APAC - Market size and forecast 2025-2030

Chart on APAC - Market size and forecast 2025-2030 ($ million)
Data Table on APAC - Market size and forecast 2025-2030 ($ million)
Chart on APAC - Year-over-year growth 2025-2030 (%)
Data Table on APAC - Year-over-year growth 2025-2030 (%)
Chart on Regional Comparison - APAC
Data Table on Regional Comparison - APAC

12.4.1 China - Market size and forecast 2025-2030

Chart on China - Market size and forecast 2025-2030 ($ million)
Data Table on China - Market size and forecast 2025-2030 ($ million)
Chart on China - Year-over-year growth 2025-2030 (%)
Data Table on China - Year-over-year growth 2025-2030 (%)

12.4.2 Japan - Market size and forecast 2025-2030

Chart on Japan - Market size and forecast 2025-2030 ($ million)
Data Table on Japan - Market size and forecast 2025-2030 ($ million)
Chart on Japan - Year-over-year growth 2025-2030 (%)
Data Table on Japan - Year-over-year growth 2025-2030 (%)

12.4.3 India - Market size and forecast 2025-2030

Chart on India - Market size and forecast 2025-2030 ($ million)
Data Table on India - Market size and forecast 2025-2030 ($ million)
Chart on India - Year-over-year growth 2025-2030 (%)
Data Table on India - Year-over-year growth 2025-2030 (%)

12.4.4 South Korea - Market size and forecast 2025-2030

Chart on South Korea - Market size and forecast 2025-2030 ($ million)
Data Table on South Korea - Market size and forecast 2025-2030 ($ million)
Chart on South Korea - Year-over-year growth 2025-2030 (%)
Data Table on South Korea - Year-over-year growth 2025-2030 (%)

12.4.5 Australia - Market size and forecast 2025-2030

Chart on Australia - Market size and forecast 2025-2030 ($ million)
Data Table on Australia - Market size and forecast 2025-2030 ($ million)
Chart on Australia - Year-over-year growth 2025-2030 (%)
Data Table on Australia - Year-over-year growth 2025-2030 (%)

12.4.6 Indonesia - Market size and forecast 2025-2030

Chart on Indonesia - Market size and forecast 2025-2030 ($ million)
Data Table on Indonesia - Market size and forecast 2025-2030 ($ million)
Chart on Indonesia - Year-over-year growth 2025-2030 (%)
Data Table on Indonesia - Year-over-year growth 2025-2030 (%)

12.5 Europe - Market size and forecast 2025-2030

Chart on Europe - Market size and forecast 2025-2030 ($ million)
Data Table on Europe - Market size and forecast 2025-2030 ($ million)
Chart on Europe - Year-over-year growth 2025-2030 (%)
Data Table on Europe - Year-over-year growth 2025-2030 (%)
Chart on Regional Comparison - Europe
Data Table on Regional Comparison - Europe

12.5.1 Germany - Market size and forecast 2025-2030

Chart on Germany - Market size and forecast 2025-2030 ($ million)
Data Table on Germany - Market size and forecast 2025-2030 ($ million)
Chart on Germany - Year-over-year growth 2025-2030 (%)
Data Table on Germany - Year-over-year growth 2025-2030 (%)

12.5.2 UK - Market size and forecast 2025-2030

Chart on UK - Market size and forecast 2025-2030 ($ million)
Data Table on UK - Market size and forecast 2025-2030 ($ million)
Chart on UK - Year-over-year growth 2025-2030 (%)
Data Table on UK - Year-over-year growth 2025-2030 (%)

12.5.3 France - Market size and forecast 2025-2030

Chart on France - Market size and forecast 2025-2030 ($ million)
Data Table on France - Market size and forecast 2025-2030 ($ million)
Chart on France - Year-over-year growth 2025-2030 (%)
Data Table on France - Year-over-year growth 2025-2030 (%)

12.5.4 Italy - Market size and forecast 2025-2030

Chart on Italy - Market size and forecast 2025-2030 ($ million)
Data Table on Italy - Market size and forecast 2025-2030 ($ million)
Chart on Italy - Year-over-year growth 2025-2030 (%)
Data Table on Italy - Year-over-year growth 2025-2030 (%)

12.5.5 Spain - Market size and forecast 2025-2030

Chart on Spain - Market size and forecast 2025-2030 ($ million)
Data Table on Spain - Market size and forecast 2025-2030 ($ million)
Chart on Spain - Year-over-year growth 2025-2030 (%)
Data Table on Spain - Year-over-year growth 2025-2030 (%)

12.5.6 The Netherlands - Market size and forecast 2025-2030

Chart on The Netherlands - Market size and forecast 2025-2030 ($ million)
Data Table on The Netherlands - Market size and forecast 2025-2030 ($ million)
Chart on The Netherlands - Year-over-year growth 2025-2030 (%)
Data Table on The Netherlands - Year-over-year growth 2025-2030 (%)

12.6 Middle East and Africa - Market size and forecast 2025-2030

Chart on Middle East and Africa - Market size and forecast 2025-2030 ($ million)
Data Table on Middle East and Africa - Market size and forecast 2025-2030 ($ million)
Chart on Middle East and Africa - Year-over-year growth 2025-2030 (%)
Data Table on Middle East and Africa - Year-over-year growth 2025-2030 (%)
Chart on Regional Comparison - Middle East and Africa
Data Table on Regional Comparison - Middle East and Africa

12.6.1 Saudi Arabia - Market size and forecast 2025-2030

Chart on Saudi Arabia - Market size and forecast 2025-2030 ($ million)
Data Table on Saudi Arabia - Market size and forecast 2025-2030 ($ million)
Chart on Saudi Arabia - Year-over-year growth 2025-2030 (%)
Data Table on Saudi Arabia - Year-over-year growth 2025-2030 (%)

12.6.2 UAE - Market size and forecast 2025-2030

Chart on UAE - Market size and forecast 2025-2030 ($ million)
Data Table on UAE - Market size and forecast 2025-2030 ($ million)
Chart on UAE - Year-over-year growth 2025-2030 (%)
Data Table on UAE - Year-over-year growth 2025-2030 (%)

12.6.3 South Africa - Market size and forecast 2025-2030

Chart on South Africa - Market size and forecast 2025-2030 ($ million)
Data Table on South Africa - Market size and forecast 2025-2030 ($ million)
Chart on South Africa - Year-over-year growth 2025-2030 (%)
Data Table on South Africa - Year-over-year growth 2025-2030 (%)

12.6.4 Israel - Market size and forecast 2025-2030

Chart on Israel - Market size and forecast 2025-2030 ($ million)
Data Table on Israel - Market size and forecast 2025-2030 ($ million)
Chart on Israel - Year-over-year growth 2025-2030 (%)
Data Table on Israel - Year-over-year growth 2025-2030 (%)

12.6.5 Turkey - Market size and forecast 2025-2030

Chart on Turkey - Market size and forecast 2025-2030 ($ million)
Data Table on Turkey - Market size and forecast 2025-2030 ($ million)
Chart on Turkey - Year-over-year growth 2025-2030 (%)
Data Table on Turkey - Year-over-year growth 2025-2030 (%)

12.7 South America - Market size and forecast 2025-2030

Chart on South America - Market size and forecast 2025-2030 ($ million)
Data Table on South America - Market size and forecast 2025-2030 ($ million)
Chart on South America - Year-over-year growth 2025-2030 (%)
Data Table on South America - Year-over-year growth 2025-2030 (%)
Chart on Regional Comparison - South America
Data Table on Regional Comparison - South America

12.7.1 Brazil - Market size and forecast 2025-2030

Chart on Brazil - Market size and forecast 2025-2030 ($ million)
Data Table on Brazil - Market size and forecast 2025-2030 ($ million)
Chart on Brazil - Year-over-year growth 2025-2030 (%)
Data Table on Brazil - Year-over-year growth 2025-2030 (%)

12.7.2 Argentina - Market size and forecast 2025-2030

Chart on Argentina - Market size and forecast 2025-2030 ($ million)
Data Table on Argentina - Market size and forecast 2025-2030 ($ million)
Chart on Argentina - Year-over-year growth 2025-2030 (%)
Data Table on Argentina - Year-over-year growth 2025-2030 (%)

12.7.3 Chile - Market size and forecast 2025-2030

Chart on Chile - Market size and forecast 2025-2030 ($ million)
Data Table on Chile - Market size and forecast 2025-2030 ($ million)
Chart on Chile - Year-over-year growth 2025-2030 (%)
Data Table on Chile - Year-over-year growth 2025-2030 (%)

12.8 Market opportunity by geography

Market opportunity by geography ($ million)
Data Tables on Market opportunity by geography ($ million)

13. Drivers, Challenges, and Opportunity

13.1 Market drivers

Resurgent demand from aerospace and defense sectors
Expanding applications in medical and industrial fields
Continuous technological advancement in alloy development and manufacturing

13.2 Market challenges

High production costs and price volatility
Intense competition from advanced alternative materials
Inherent difficulties in machining and fabrication

13.3 Impact of drivers and challenges

Impact of drivers and challenges in 2025 and 2030

13.4 Market opportunities

Increased focus on vertical integration and supply chain security
Growing emphasis on sustainability and circular economy
Strategic shift towards regionalization of supply chains

14. Competitive Landscape

14.1 Overview

14.2

Overview on criticality of inputs and factors of differentiation

14.3 Landscape disruption

Overview on factors of disruption

14.4 Industry risks

Impact of key risks on business

15. Competitive Analysis

15.1 Companies profiled

Companies covered

15.2 Company ranking index

15.3 Market positioning of companies

Matrix on companies position and classification

15.4 Acerinox SA

Acerinox SA - Overview
Acerinox SA - Business segments
Acerinox SA - Key offerings
Acerinox SA - Segment focus
SWOT

15.5 Allegheny Technologies Inc.

Allegheny Technologies Inc. - Overview
Allegheny Technologies Inc. - Business segments
Allegheny Technologies Inc. - Key offerings
Allegheny Technologies Inc. - Segment focus
SWOT

15.6 Auremo GmbH

Auremo GmbH - Overview
Auremo GmbH - Product / Service
Auremo GmbH - Key offerings
SWOT

15.7 BAOTI Group Co. Ltd.

BAOTI Group Co. Ltd. - Overview
BAOTI Group Co. Ltd. - Product / Service
BAOTI Group Co. Ltd. - Key offerings
SWOT

15.8 Kobe Steel Ltd.

Kobe Steel Ltd. - Overview
Kobe Steel Ltd. - Business segments
Kobe Steel Ltd. - Key offerings
Kobe Steel Ltd. - Segment focus
SWOT

15.9 Nippon Steel Corp.

Nippon Steel Corp. - Overview
Nippon Steel Corp. - Business segments
Nippon Steel Corp. - Key offerings
Nippon Steel Corp. - Segment focus
SWOT

15.10 OSAKA Titanium Technologies

OSAKA Titanium Technologies - Overview
OSAKA Titanium Technologies - Product / Service
OSAKA Titanium Technologies - Key offerings
SWOT

15.11 Rostec State Corporation

Rostec State Corporation - Overview
Rostec State Corporation - Product / Service
Rostec State Corporation - Key offerings
SWOT

15.12 Supra Alloys

Supra Alloys - Overview
Supra Alloys - Product / Service
Supra Alloys - Key offerings
SWOT

15.13 Titan Engineering Pte Ltd.

Titan Engineering Pte Ltd. - Overview
Titan Engineering Pte Ltd. - Product / Service
Titan Engineering Pte Ltd. - Key offerings
SWOT

15.14 Titanium Industries Inc.

Titanium Industries Inc. - Overview
Titanium Industries Inc. - Product / Service
Titanium Industries Inc. - Key offerings
SWOT

15.15 Toho Titanium Co. Ltd.

Toho Titanium Co. Ltd. - Overview
Toho Titanium Co. Ltd. - Product / Service
Toho Titanium Co. Ltd. - Key offerings
SWOT

15.16 Tricor Metals Inc.

Tricor Metals Inc. - Overview
Tricor Metals Inc. - Product / Service
Tricor Metals Inc. - Key offerings
SWOT

15.17 United Titanium Inc.

United Titanium Inc. - Overview
United Titanium Inc. - Product / Service
United Titanium Inc. - Key offerings
SWOT

15.18 WST Co. Ltd.

WST Co. Ltd. - Overview
WST Co. Ltd. - Business segments
WST Co. Ltd. - Key offerings
WST Co. Ltd. - Segment focus
SWOT

16. Appendix

16.1 Scope of the report

Market definition
Objectives
Notes and caveats

16.2 Inclusions and exclusions checklist

Inclusions checklist
Exclusions checklist

16.3 Currency conversion rates for US$

16.4 Research methodology

16.5 Data procurement

Information sources

16.6 Data validation

16.7 Validation techniques employed for market sizing

16.8 Data synthesis

16.9 360 degree market analysis

16.10 List of abbreviations

Research Methodology

Technavio presents a detailed picture of the market by way of study, synthesis, and summation of data from multiple sources. The analysts have presented the various facets of the market with a particular focus on identifying the key industry influencers. The data thus presented is comprehensive, reliable, and the result of extensive research, both primary and secondary.

INFORMATION SOURCES

Primary sources

  • Manufacturers and suppliers
  • Channel partners
  • Industry experts
  • Strategic decision makers

Secondary sources

  • Industry journals and periodicals
  • Government data
  • Financial reports of key industry players
  • Historical data
  • Press releases

DATA ANALYSIS

Data Synthesis

  • Collation of data
  • Estimation of key figures
  • Analysis of derived insights

Data Validation

  • Triangulation with data models
  • Reference against proprietary databases
  • Corroboration with industry experts

REPORT WRITING

Qualitative

  • Market drivers
  • Market challenges
  • Market trends
  • Five forces analysis

Quantitative

  • Market size and forecast
  • Market segmentation
  • Geographical insights
  • Competitive landscape

Interested in this report?

Get your sample now to see our research methodology and insights!

Download Now

Frequently Asked Questions

Titanium Mill Products market growth will increase by USD 686.1 million during 2026-2030.

The Titanium Mill Products market is expected to grow at a CAGR of 3.5% during 2026-2030.

Titanium Mill Products market is segmented by End-user (Industrial, Commercial aerospace, Defense) Product (Sheets and plates, Billets and bars, Others) Grade type (Titanium alloys, Commercially pure titanium (grades 1-4))

Acerinox SA, Allegheny Technologies Inc., Auremo GmbH, BAOTI Group Co. Ltd., EAZALL Metal Company, Kobe Steel Ltd., Nippon Steel Corp., Norsk Titanium AS, OSAKA Titanium Technologies, Precision Castparts Corp., Reliance Steel and Aluminum Co., Rostec State Corporation, Smiths Metal Centres Ltd., Supra Alloys, Titan Engineering Pte Ltd., Titanium Industries Inc., Toho Titanium Co. Ltd., Tricor Metals Inc., United Titanium Inc., WST Co. Ltd. are a few of the key vendors in the Titanium Mill Products market.

North America will register the highest growth rate of 40.4% among the other regions. Therefore, the Titanium Mill Products market in North America is expected to garner significant business opportunities for the vendors during the forecast period.

US, Canada, Mexico, China, Japan, India, South Korea, Australia, Indonesia, Germany, UK, France, Italy, Spain, The Netherlands, Saudi Arabia, UAE, South Africa, Israel, Turkey, Brazil, Argentina, Chile

  • Resurgent demand from aerospace and defense sectors is the driving factor this market.

The Titanium Mill Products market vendors should focus on grabbing business opportunities from the End-user segment as it accounted for the largest market share in the base year.
RIA - Research AI Assistant
Ask RIA