Tpee In Automotive Industry Market Size and Growth Forecast 2026-2030
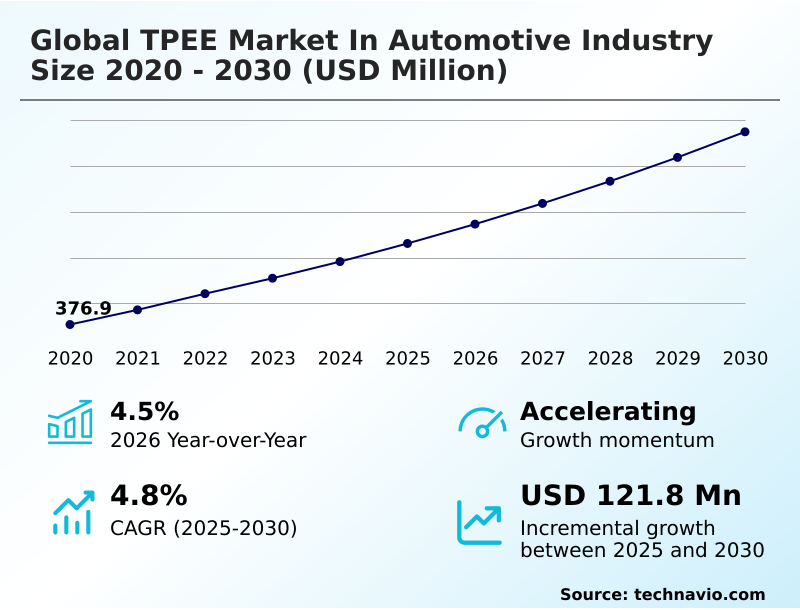
The Tpee In Automotive Industry Market size was valued at USD 465.3 million in 2025 growing at a CAGR of 4.8% during the forecast period 2026-2030.
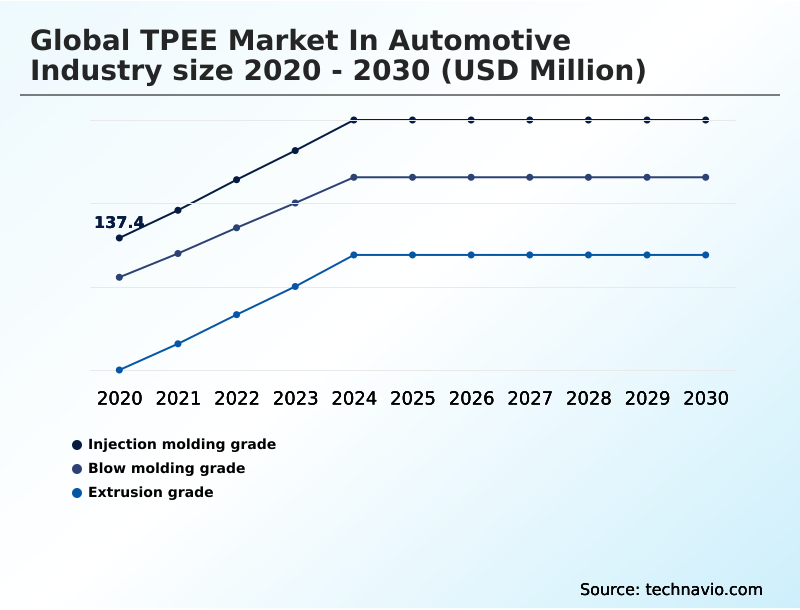
APAC accounts for 52.7% of incremental growth during the forecast period. The Injection molding grade segment by Type was valued at USD 161.7 million in 2024, while the Interior components segment holds the largest revenue share by Application.
The market is projected to grow by USD 210.2 million from 2020 to 2030, with USD 121.8 million of the growth expected during the forecast period of 2025 to 2030.
Get Key Insights on Market Forecast (PDF) Request Free Sample
Tpee In Automotive Industry Market Overview
The TPEE market in automotive industry is expanding, with a year-over-year growth of 4.5%, as vehicle manufacturers increasingly prioritize lightweighting materials to meet efficiency and performance targets. This growth is heavily influenced by the APAC region, which accounts for approximately 52.7% of the market's incremental growth, driven by its massive vehicle production and rapid EV adoption. Thermoplastic block copolymer technology is central to this shift, offering a superior alternative to traditional rubber for components requiring high fatigue resistance and chemical resistance. In a typical use case, an automotive OEM designing a new EV platform specifies TPEE for high-voltage cable jacketing and coolant lines. The material's melt-processability allows for the blow molding of complex geometries, optimizing space within the battery pack while ensuring durability against thermal cycling and road vibration, thereby improving overall vehicle reliability and range. This transition toward high-performance engineering polymers reflects a broader industry move to enhance both sustainability and performance.
Drivers, Trends, and Challenges in the Tpee In Automotive Industry Market
Strategic decision-making in the TPEE market in automotive industry is heavily influenced by a detailed cost-benefit analysis of TPEE over thermoset rubber, particularly as regulatory pressures intensify. The impact of EU End-of-Life Vehicles directive on polymer choice is a prime example, forcing OEMs to prioritize recyclable materials.
This makes TPEE performance vs TPU in automotive applications a key evaluation point for engineers, who must balance durability with material compliance. For instance, a Tier 1 supplier manufacturing constant velocity joint boots leverages the superior processing efficiency of TPEE in injection molding, achieving cycle times that are often 30-40% faster than the curing processes required for thermoset rubber.
This operational advantage directly impacts production capacity and unit cost. Furthermore, a comprehensive TPEE material selection for high-voltage EV components is now standard procedure for EV manufacturers, as the material's dielectric strength and thermal stability are critical for the safety and longevity of battery systems.
These factors combined demonstrate a clear trend toward adopting advanced thermoplastics that offer both performance gains and a more favorable total cost of ownership.
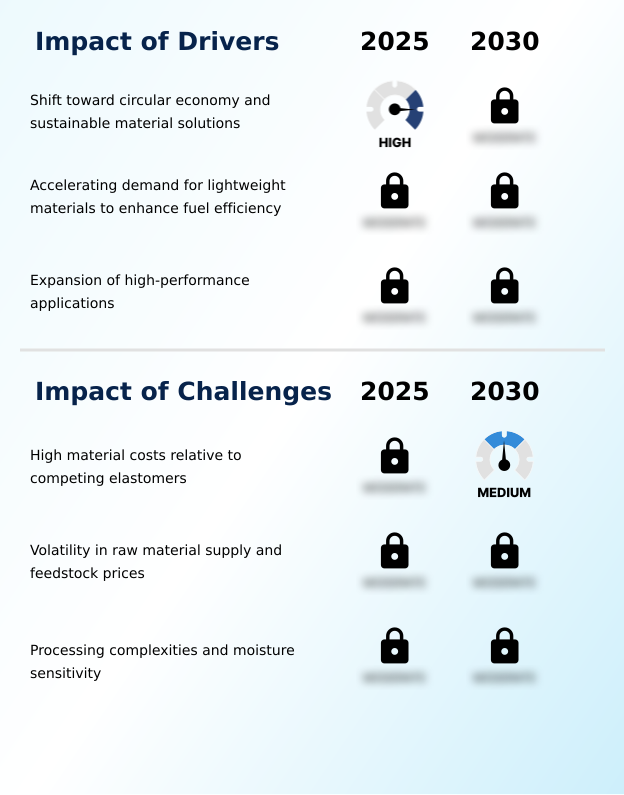
Primary Growth Driver: A primary market driver is the industry-wide shift toward a circular economy and the increasing demand for sustainable material solutions that support vehicle recyclability.
The primary driver for market expansion is the accelerating demand for lightweighting materials to improve vehicle efficiency, a factor contributing to the market's 4.5% year-over-year growth.
TPEE's high strength-to-weight ratio allows for the replacement of heavier metal and rubber parts, directly impacting fuel economy and EV range. Secondly, the expansion of high-performance applications, particularly in under-the-hood components where temperatures are extreme, leverages the material's unique properties.
The most significant driver, however, is the global shift toward a circular economy. TPEE's inherent recyclability, unlike non-recyclable thermoset rubber, aligns with sustainability goals and regulations, making it a strategic choice.
The APAC region, contributing 52.71% of incremental growth, leads this adoption due to its massive EV production.
Emerging Market Trend: The accelerated adoption of thermoplastic polyester elastomers within the thermal management systems of electric vehicles is a defining market trend. This is driven by the material's ability to provide high-temperature resistance and low-temperature flexibility.
The market is defined by the strategic transition toward bio-based and recyclable TPEE formulations, driven by automotive OEM sustainability targets and regulations like the EU's End-of-Life Vehicles Directive.
This shift is particularly evident in the accelerated adoption of TPEE for electric vehicle thermal management systems, where its combination of high-temperature resistance and chemical resistance is critical for coolant lines and battery component housings. Concurrently, the replacement of heavier thermoset rubbers and metals continues, supporting vehicle lightweighting initiatives that enhance fuel efficiency and EV range.
This trend is prominent in applications like suspension dust covers and automotive air ducts, where the material's durability and design flexibility offer significant performance advantages. The ease of melt-processability further enables complex part consolidation, reducing assembly costs.
Key Industry Challenge: The market's growth is constrained by the high material costs of thermoplastic polyester elastomers relative to competing elastomers and conventional thermoset rubbers.
A primary challenge remains the high material cost of TPEE relative to competing elastomers like TPO and TPV, which constrains adoption in price-sensitive vehicle segments. This automotive material cost analysis often favors lower-cost alternatives for non-critical applications, despite TPEE's superior performance.
Another significant issue is the volatility in raw material supply and feedstock prices, which introduces uncertainty into supply chains and production planning. This financial pressure is compounded by polymer processing complexity and the material's moisture sensitivity, which requires specialized drying equipment and stringent process controls to prevent degradation and ensure part quality.
Convincing procurement teams of the total system cost reduction through faster cycle times remains a hurdle, as the initial per-kilogram price often dictates material selection decisions.
Explore Full Market Dynamics Analysis Request Free Sample
Tpee In Automotive Industry Market Segmentation
The tpee in automotive industry industry research report provides comprehensive data including region-wise segment analysis, with forecasts and analysis for the period 2026-2030, as well as historical data from 2020-2024 for the following segments.
Type Segment Analysis
The injection molding grade segment is estimated to witness significant growth during the forecast period.
Injection molding grade TPEE commands a significant share of the TPEE market in automotive industry, driven by its suitability for producing high-precision, complex components with rapid manufacturing cycles.
This segment's materials are engineered with specific melt flow characteristics, enabling the complete filling of intricate mold cavities for parts like electrical connectors, fasteners, and airbag deployment covers.
A key advantage is its overmolding compatibility, allowing direct bonding to rigid substrates to create integrated parts that combine structural integrity with soft-touch surfaces, which eliminates assembly steps.
These high-performance engineering polymers are formulated for thermal stability to withstand the injection process, with the ability to recycle production scrap enhancing the economic case for mass-produced thermoplastic block copolymer components in modern vehicle architectures.
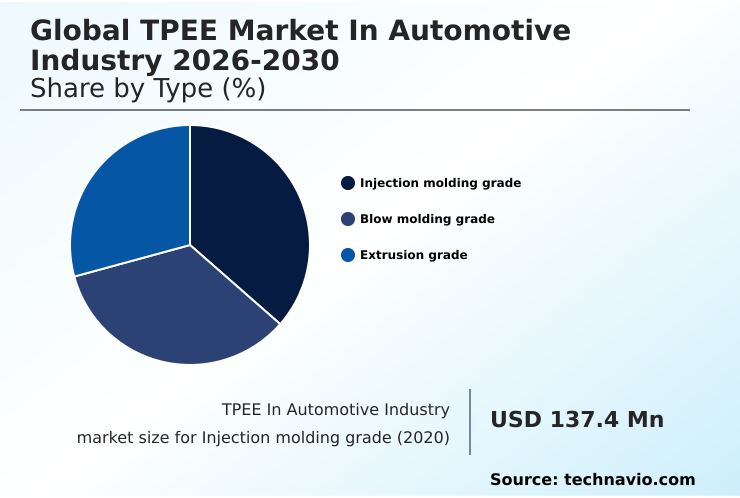
The Injection molding grade segment was valued at USD 161.7 million in 2024 and showed a gradual increase during the forecast period.
Tpee In Automotive Industry Market by Region: APAC Leads with 52.7% Growth Share
APAC is estimated to contribute 52.7% to the growth of the global market during the forecast period.
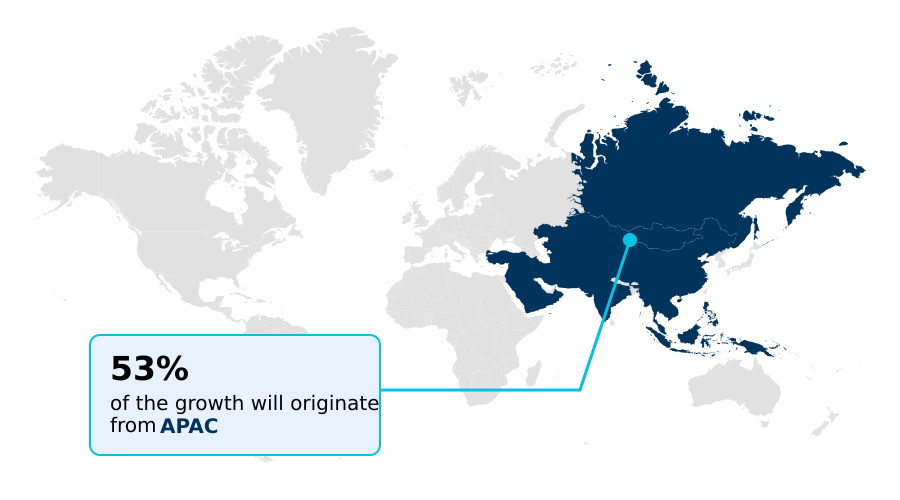
The geographic landscape is dominated by the APAC region, which is projected to contribute 52.71% of the market's incremental growth.
This is primarily fueled by China's massive vehicle production and government mandates promoting new energy vehicles, which escalates demand for under-the-hood polymer solutions and components for electric vehicle thermal management.
Countries like Japan and South Korea contribute through advanced automotive technology sectors focusing on miniaturization, specifying TPEE for intricate sensor housings and connectors.
India is also a key growth area, where the material is gaining traction as a cost-effective choice for interior and exterior trim.
The region’s manufacturing ecosystem benefits from lower production costs and localized supply chains, solidifying its position as a global hub for both consumption and innovation in automotive thermoplastic elastomers.
Customer Landscape Analysis for the Tpee In Automotive Industry Market
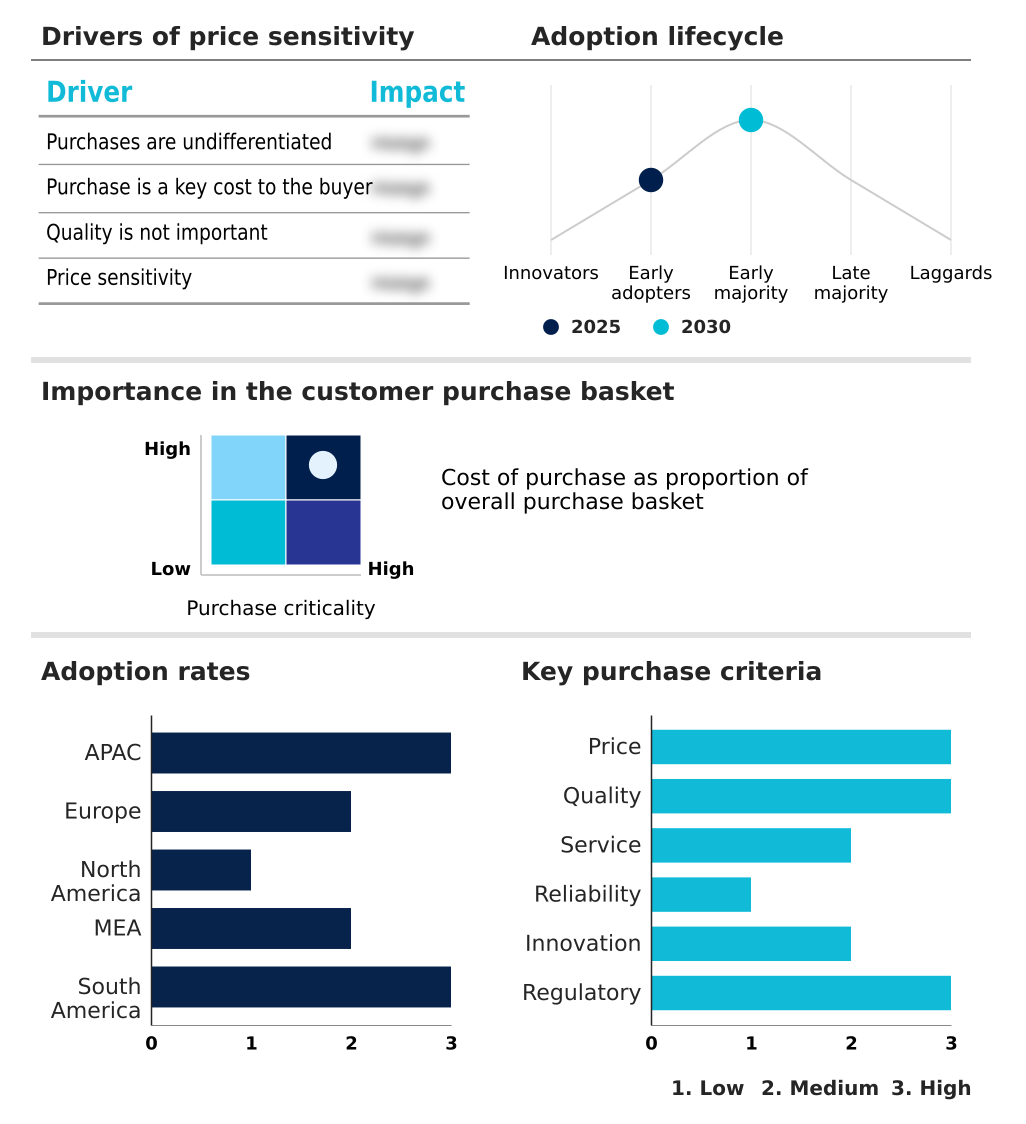
The tpee in automotive industry market forecasting report includes the adoption lifecycle of the market, covering from the innovator’s stage to the laggard’s stage. It focuses on adoption rates in different regions based on penetration. Furthermore, the tpee in automotive industry market report also includes key purchase criteria and drivers of price sensitivity to help companies evaluate and develop their market growth analysis strategies.
Competitive Landscape of the Tpee In Automotive Industry Market
Companies are implementing various strategies, such as strategic alliances, partnerships, mergers and acquisitions, geographical expansion, and product/service launches, to enhance their presence in the tpee in automotive industry market industry.
Arkema Group - Key offerings include high-performance thermoplastic elastomers, specialty compounds, and sustainable formulations, engineered to meet the stringent requirements of modern automotive applications.
The industry research and growth report includes detailed analyses of the competitive landscape of the market and information about key companies, including:
- Arkema Group
- Avient Corp.
- Celanese Corp.
- Chang Chun Group
- Eastman Chemical Co.
- Envalior
- Kraton Corp.
- LG Chem Ltd.
- Prochase Enterprise Co., Ltd
- Radici Partecipazioni Spa
- RTP Co.
- Samyang Corporation
- Saudi Basic Industries
- Sinochem Nanjing
- SK Chemicals Co. Ltd.
- The Mitsubishi Chemical Group
- Toyobo Co. Ltd.
- Wanhua Chemical Group Co. Ltd.
Qualitative and quantitative analysis of companies has been conducted to help clients understand the wider business environment as well as the strengths and weaknesses of key industry players. Data is qualitatively analyzed to categorize companies as pure play, category-focused, industry-focused, and diversified; it is quantitatively analyzed to categorize companies as dominant, leading, strong, tentative, and weak.
Recent Developments in the Tpee In Automotive Industry Market
- In March 2025, Jiaxing Nanxiong Polymer Co., Ltd. unveiled innovations in bio-based thermoplastic polyester elastomers and thermoplastic polyurethane, designed to deliver high performance while meeting eco-conscious automotive standards.
- In January 2025, EKA Mobility announced a new portfolio of electric commercial vehicles at the Bharat Mobility Auto Expo 2025, including heavy-duty trucks, driving demand for durable, lightweight polymers in its vehicle architecture.
- In November 2024, Celanese Corp. completed a capacity expansion for its Hytrel TPEE at its Nanjing, China facility, aiming to meet the escalating demand from the region's electric vehicle and consumer electronics sectors.
- In September 2024, Envalior launched a new series of its Arnitel TPEE specifically engineered for electric vehicle battery thermal management systems, featuring enhanced thermal conductivity and flame retardancy compliant with UL 94 V-0 standards.
Research Analyst Overview: Tpee In Automotive Industry Market
The operational shift toward electrification is compelling a re-evaluation of material science in automotive design, with thermoplastic polyester elastomer (TPEE) emerging as a critical enabler. The material's inherent high-temperature resistance and low-temperature flexibility make it indispensable for components like hot charge air ducts in downsized engines and the complex thermal systems of EVs.
Boardroom decisions are increasingly linking material strategy to ESG goals, where the adoption of bio-based TPEE formulations supports corporate sustainability mandates under frameworks like REACH. For example, using TPEE as a thermoset rubber replacement contributes directly to meeting end-of-life vehicle recyclability targets.
The technical advantages, such as superior fatigue resistance for constant velocity joint (CVJ) boots and NVH dampening properties, translate into improved vehicle reliability and passenger comfort. This move toward high-performance engineering polymers, including specific extrusion grade TPEE for high-voltage cable jacketing, is driven by performance necessity and regulatory compliance, with melt-processability offering significant production efficiencies over legacy materials.
Dive into Technavio’s robust research methodology, blending expert interviews, extensive data synthesis, and validated models for unparalleled Tpee In Automotive Industry Market insights. See full methodology.
| Market Scope | |
|---|---|
| Page number | 294 |
| Base year | 2025 |
| Historic period | 2020-2024 |
| Forecast period | 2026-2030 |
| Growth momentum & CAGR | Accelerate at a CAGR of 4.8% |
| Market growth 2026-2030 | USD 121.8 million |
| Market structure | Fragmented |
| YoY growth 2025-2026(%) | 4.5% |
| Key countries | China, Japan, India, South Korea, Indonesia, Australia, Germany, UK, Italy, France, Spain, The Netherlands, US, Canada, Mexico, UAE, Saudi Arabia, South Africa, Turkey, Israel, Brazil, Argentina and Colombia |
| Competitive landscape | Leading Companies, Market Positioning of Companies, Competitive Strategies, and Industry Risks |
Tpee In Automotive Industry Market: Key Questions Answered in This Report
-
What is the expected growth of the Tpee In Automotive Industry Market between 2026 and 2030?
-
The Tpee In Automotive Industry Market is expected to grow by USD 121.8 million during 2026-2030, registering a CAGR of 4.8%. Year-over-year growth in 2026 is estimated at 4.5%%. This acceleration is shaped by shift toward circular economy and sustainable material solutions, which is intensifying demand across multiple end-use verticals covered in the report.
-
-
What segmentation does the market report cover?
-
The report is segmented by Type (Injection molding grade, Blow molding grade, and Extrusion grade), Application (Interior components, Under-the-hood components, Exterior components, Sealing and gaskets, and Wiring and cables), Vehicle Type (Passenger vehicles, and Commercial vehicles) and Geography (APAC, Europe, North America, Middle East and Africa, South America). Among these, the Injection molding grade segment is estimated to witness significant growth during the forecast period, driven by rising adoption across key application areas. Each segment includes detailed qualitative and quantitative analysis, along with historical data from 2020-2024 and forecasts through 2030 with year-over-year growth rates.
-
-
Which regions are analyzed in the report?
-
The report covers APAC, Europe, North America, Middle East and Africa and South America. APAC is estimated to contribute 52.7% to market growth during the forecast period. Country-level analysis includes China, Japan, India, South Korea, Indonesia, Australia, Germany, UK, Italy, France, Spain, The Netherlands, US, Canada, Mexico, UAE, Saudi Arabia, South Africa, Turkey, Israel, Brazil, Argentina and Colombia, with dedicated market size tables and year-over-year growth for each.
-
-
What are the key growth drivers and market challenges?
-
The primary driver is shift toward circular economy and sustainable material solutions, which is accelerating investment and industry demand. The main challenge is high material costs relative to competing elastomers, creating operational barriers for key market participants. The report quantifies the impact of each driver and challenge across 2026 and 2030 with comparative analysis.
-
-
Who are the major players in the Tpee In Automotive Industry Market?
-
Key vendors include Arkema Group, Avient Corp., Celanese Corp., Chang Chun Group, Eastman Chemical Co., Envalior, Kraton Corp., LG Chem Ltd., Prochase Enterprise Co., Ltd, Radici Partecipazioni Spa, RTP Co., Samyang Corporation, Saudi Basic Industries, Sinochem Nanjing, SK Chemicals Co. Ltd., The Mitsubishi Chemical Group, Toyobo Co. Ltd. and Wanhua Chemical Group Co. Ltd.. The report provides qualitative and quantitative analysis categorizing companies as dominant, leading, strong, tentative, and weak based on their market positioning. Company profiles include business segment analysis, SWOT assessment, key offerings, and recent strategic developments.
-
Tpee In Automotive Industry Market Research Insights
Market dynamics are increasingly shaped by stringent automotive polymer recycling standards, compelling procurement decision-makers to evaluate materials beyond initial cost. The total system cost reduction in automotive parts becomes a critical metric, where TPEE's processing efficiencies can offset higher per-kilogram prices.
Compliance with regulations like the EU End-of-Life Vehicles (ELV) Directive is pushing designers to replace traditional materials in applications such as automotive sealing and gaskets. For instance, in under-the-hood polymer solutions, the material's inherent resistance to oils and chemicals reduces lifetime warranty claims compared to less durable alternatives.
This shift is reinforced by raw material price volatility, which encourages the adoption of materials with stable, long-term performance and recyclability, influencing material selection for both passenger vehicle plastic components and commercial vehicle elastomer parts.
We can help! Our analysts can customize this tpee in automotive industry market research report to meet your requirements.
 RIA -
RIA - 
