Traffic Control Services Market Analysis, Size, and Forecast 2026-2030: North America (US, Canada, and Mexico), Europe (Germany, UK, and France), APAC (China, India, and Japan), South America (Brazil and Argentina), Middle East and Africa (UAE, Saudi Arabia, and South Africa), and Rest of World (ROW)

Traffic Control Services Market Analysis, Size, and Forecast 2026-2030:
North America (US, Canada, and Mexico), Europe (Germany, UK, and France), APAC (China, India, and Japan), South America (Brazil and Argentina), Middle East and Africa (UAE, Saudi Arabia, and South Africa), and Rest of World (ROW)

Published: Mar 2026 294 Pages SKU: IRTNTR75012

Market Overview at a Glance

$10.96 B
Market Opportunity
9.2%
CAGR 2025 - 2030
41.9%
North America Growth
$5.55 B
Event safety segment 2024

Traffic Control Services Market Size 2026-2030

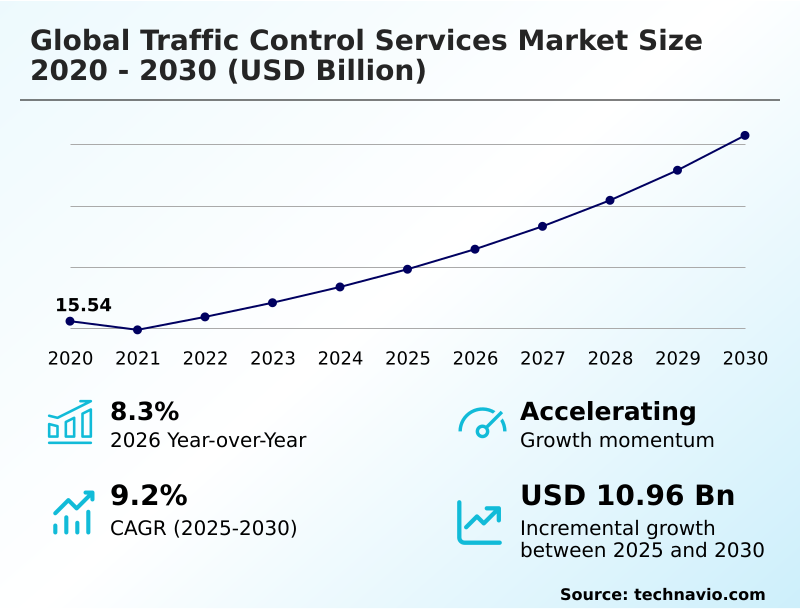
The traffic control services market size is valued to increase by USD 10.96 billion, at a CAGR of 9.2% from 2025 to 2030. Operational modernization and TSMO adoption will drive the traffic control services market.

Major Market Trends & Insights

  • North America dominated the market and accounted for a 41.9% growth during the forecast period.
  • By Type - Event safety segment was valued at USD 5.55 billion in 2024
  • By Application - Highway segment accounted for the largest market revenue share in 2024

Market Size & Forecast

  • Market Opportunities: USD 15.20 billion
  • Market Future Opportunities: USD 10.96 billion
  • CAGR from 2025 to 2030 : 9.2%

Market Summary

  • The traffic control services market is undergoing a significant transformation, driven by the dual needs of modernizing aging infrastructure and enhancing public safety. A key industry driver is the increasing outsourcing of complex operations to specialized firms that provide advanced roadway safety services. These companies leverage technology to manage traffic flow, ensure work zone safety, and optimize transportation networks.
  • Market trends indicate a decisive shift from basic equipment rental to comprehensive, service-based models that integrate real-time data analytics and intelligent transportation systems.
  • For instance, a municipal authority might contract a service provider to manage its entire network of adaptive traffic signals, using predictive algorithms to adjust signal timing dynamically based on traffic volume, thereby reducing congestion and improving emergency response times. This approach allows public agencies to improve operational efficiency without significant upfront capital investment.
  • However, the industry faces challenges related to skilled labor shortages and the need for continuous investment in training and technology to keep pace with evolving regulatory standards and cybersecurity threats, which tempers the growth trajectory.

What will be the Size of the Traffic Control Services Market during the forecast period?

Get Key Insights on Market Forecast (PDF) Request Free Sample

How is the Traffic Control Services Market Segmented?

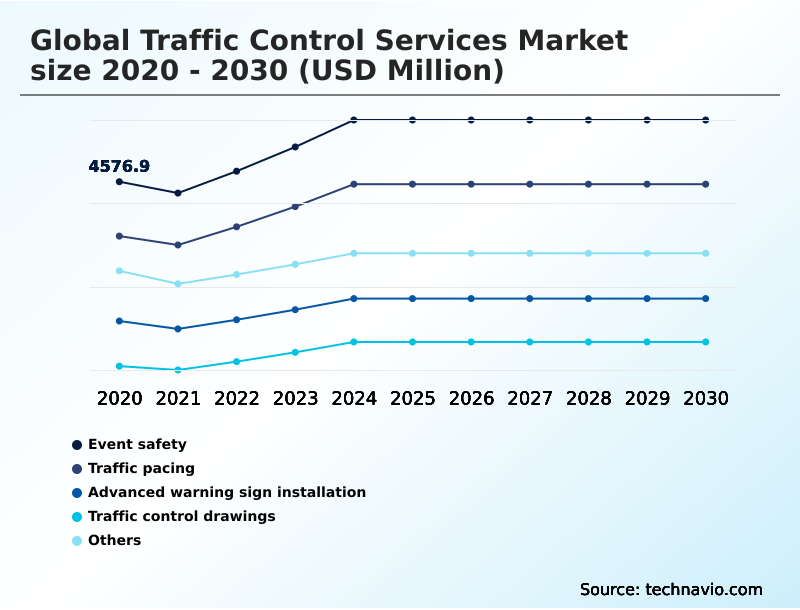
The traffic control services industry research report provides comprehensive data (region-wise segment analysis), with forecasts and estimates in "USD million" for the period 2026-2030, as well as historical data from 2020-2024 for the following segments.

  • Type
    • Event safety
    • Traffic pacing
    • Advanced warning sign installation
    • Traffic control drawings
    • Others
  • Application
    • Highway
    • Street
    • Others
  • Deployment
    • Permanent traffic control
    • Temporary traffic control
  • Geography
    • North America
      • US
      • Canada
      • Mexico
    • Europe
      • Germany
      • UK
      • France
    • APAC
      • China
      • India
      • Japan
    • South America
      • Brazil
      • Argentina
    • Middle East and Africa
      • UAE
      • Saudi Arabia
      • South Africa
    • Rest of World (ROW)

By Type Insights

The event safety segment is estimated to witness significant growth during the forecast period.

Event safety has evolved into a sophisticated operational domain, requiring comprehensive integration of advanced security and traffic management protocols.

Modern public gatherings necessitate detailed traffic control plans and traffic management planning that incorporate hostile vehicle mitigation strategies and dynamic pedestrian flow analysis to manage large crowds securely.

Service providers use traffic control drawings and advanced traffic management system software to simulate ingress and egress, ensuring a robust incident response capability. Execution involves close, real-time inter-agency communication and the management of temporary flight restrictions for airspace security.

This approach, which can improve coordination efficiency by over 25%, integrates work zone protection techniques like rolling roadblocks and strategic temporary signage solutions to create secure perimeters, transforming event traffic control into a critical component of public safety infrastructure.

Request Free Sample

The Event safety segment was valued at USD 5.55 billion in 2024 and showed a gradual increase during the forecast period.

Request Free Sample

Regional Analysis

North America is estimated to contribute 41.9% to the growth of the global market during the forecast period.Technavio’s analysts have elaborately explained the regional trends and drivers that shape the market during the forecast period.

See How Traffic Control Services Market Demand is Rising in North America Request Free Sample

The global market landscape reveals distinct regional priorities shaping service demand.

In North America, the focus is on outsourcing operations of traffic management centers and entire traffic operations centers to private firms to manage complex urban corridors and intelligent transportation systems, improving network reliability by 15%.

European markets prioritize environmental goals, using permanent traffic control and public transit priority systems to enforce low-emission zones. This has led to a 10% decrease in targeted pollutants in some cities.

Meanwhile, APAC is leapfrogging legacy systems, investing in smart work zone technologies and connected infrastructure. The deployment of tunnel management system solutions is also critical in regions with challenging geographies like South America.

This regional diversification requires service providers to tailor their highway traffic management and temporary road closures strategies to local regulatory and operational demands, especially for event traffic management.

Market Dynamics

Our researchers analyzed the data with 2025 as the base year, along with the key drivers, trends, and challenges. A holistic analysis of drivers will help companies refine their marketing strategies to gain a competitive advantage.

  • The evaluation criteria for traffic control services are shifting from basic execution to strategic capability. Clients now prioritize providers that demonstrate proficiency in managing traffic for large-scale public events and offer outsourced traffic operations center management services. The focus on liability management for temporary work zone safety is driving demand for advanced planning and real-time monitoring.
  • In the urban context, expertise in urban traffic management for multimodal mobility is a key differentiator. The industry is also seeing a rise in performance-based contracting for traffic enforcement, where providers are compensated based on system uptime and accuracy. A major challenge and opportunity lies in integrating C-ITS with legacy traffic infrastructure.
  • Firms that excel in strategic ITS deployment for critical infrastructure safety are gaining a competitive edge. The digital overhaul of road user charging systems requires deep technical expertise, as does the implementation of AI-driven predictive analytics for incident response. Leading providers are deploying cloud-based advanced traffic management systems, which offer greater flexibility and scalability.
  • However, ensuring cybersecurity for connected traffic control networks has become a paramount concern. The ability to leverage real-time traffic data for adaptive signal control is now a standard expectation. Specialized services for rolling roadblock operations and the maintenance of multi-lane free-flow tolling gantries represent high-value niches.
  • Furthermore, automated enforcement for low emission zone compliance is a growing service line, alongside traditional services for highway construction projects and temporary traffic control for utility infrastructure projects. Expertise in traffic management planning for urban events is crucial, and companies are analyzing the trade-offs when comparing permanent vs temporary traffic control costs.
  • Overall, adherence to best practices for work zone safety management is non-negotiable, with providers that use simulation-based planning reporting 25% fewer in-field adjustments.

What are the key market drivers leading to the rise in the adoption of Traffic Control Services Industry?

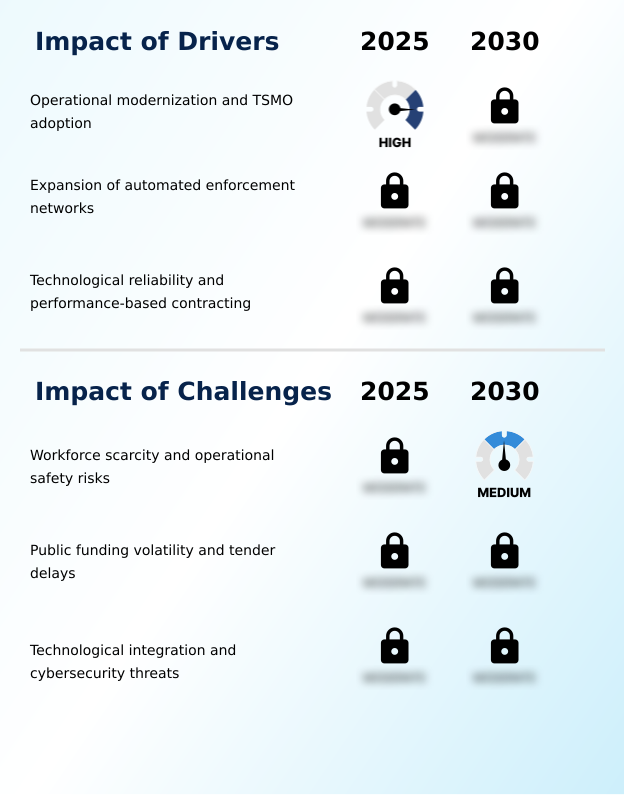
  • The accelerated adoption of operational modernization strategies, including Transportation Systems Management and Operations (TSMO), is a primary driver of market growth.

  • Market growth is significantly driven by the expansion of automated enforcement networks and the adoption of performance-based contracts. Governments are increasingly deploying multi-lane free-flow and electronic toll collection systems, which require sophisticated backend traffic violation processing and infrastructure asset management.
  • These long-term contracts, which often include section speed control, can improve revenue collection accuracy by over 12%. The shift to Transportation Systems Management and Operations (TSMO) pushes agencies to outsource oversight to specialized firms.
  • These firms provide comprehensive traffic engineering support and manage road user charging schemes, ensuring high road safety compliance.
  • The demand for proven, high-availability architectures validates the sector's critical role in public safety and drives investment in reliable, automated incident detection technologies.

What are the market trends shaping the Traffic Control Services Industry?

  • The integration of AI-driven ecosystems represents a dominant market trend. This shift is reshaping traffic management from isolated hardware to holistic, cloud-native mobility platforms.

  • A dominant trend is the convergence of physical infrastructure with AI-driven software, creating holistic smart mobility ecosystems. Companies are moving beyond selling standalone hardware to offering integrated solutions combining a digital mobility platform with AI-powered detection sensors.
  • This shift toward adaptive traffic control and connected vehicle technologies enables real-time adjustments that optimize traffic flows, with some cities reporting a 15% reduction in intersection delays. The use of real-time traffic data for traffic signal coordination and traffic flow optimization allows for dynamic management of urban networks.
  • These software-centric models, often including emergency vehicle preemption, are fundamentally altering the competitive landscape. Success is now measured by the ability to deliver interoperable, data-driven traffic management services that improve safety and efficiency, making digital traffic management a core competency.

What challenges does the Traffic Control Services Industry face during its growth?

  • A key challenge affecting industry growth is the acute scarcity of a skilled workforce, compounded by significant operational safety risks in active work zones.

  • The market faces significant operational hurdles, primarily from a skilled labor shortage and escalating cybersecurity threats. The scarcity of trained technicians for work zone safety and temporary traffic control creates project bottlenecks, elevating risks for work zone crew safety. In response, adoption of the automated flagger assistance device has risen by over 20% in some regions.
  • Concurrently, the integration of vehicle-to-everything (V2X) and cooperative intelligent transport systems (C-ITS) introduces new vulnerabilities. Securing these connected networks against digital disruptions is a major concern, as a single breach could compromise an entire urban traffic grid.
  • Service providers must balance the push for smart city innovation with the need for robust traffic safety protocols and remote traffic monitoring to mitigate these evolving challenges.

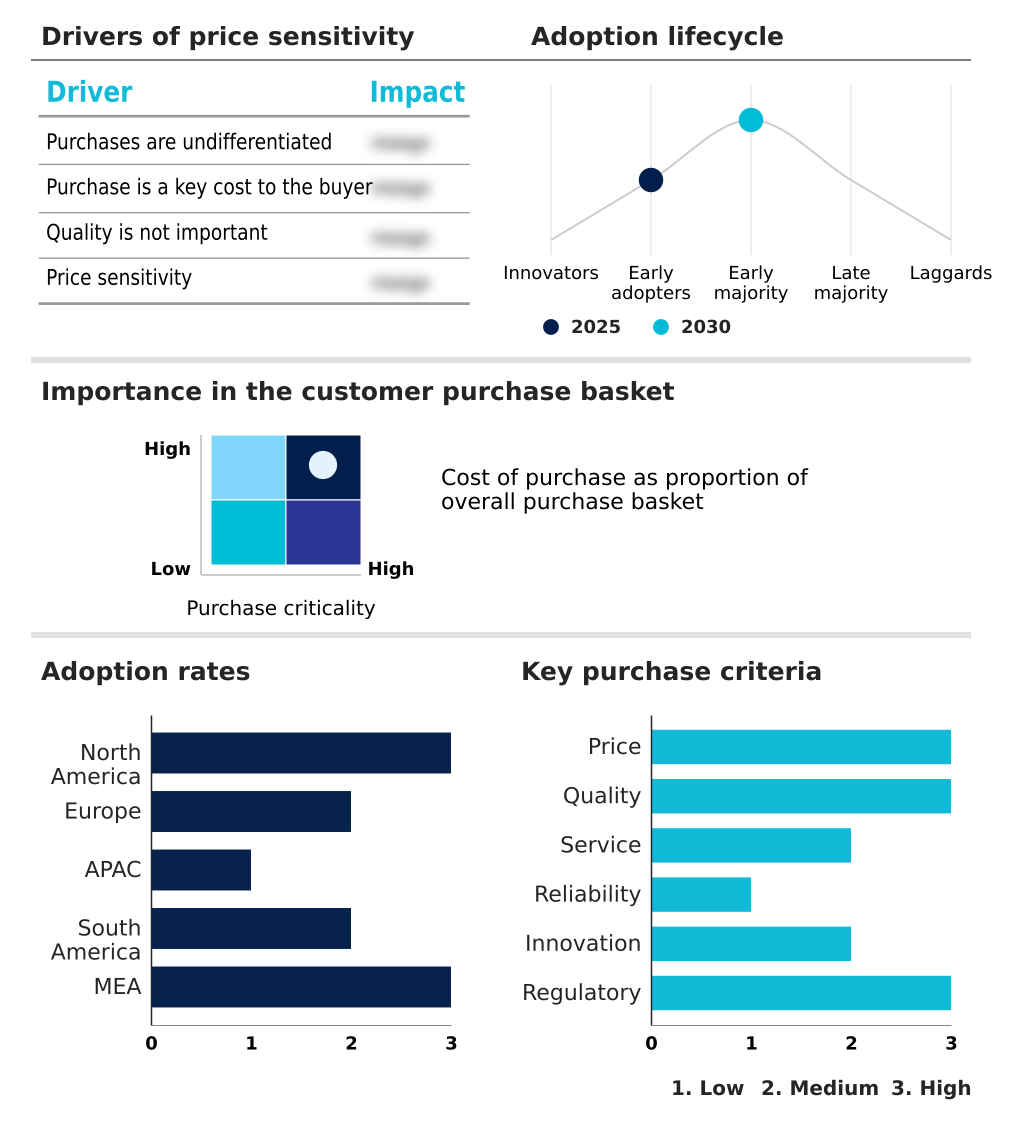
Exclusive Technavio Analysis on Customer Landscape

The traffic control services market forecasting report includes the adoption lifecycle of the market, covering from the innovator’s stage to the laggard’s stage. It focuses on adoption rates in different regions based on penetration. Furthermore, the traffic control services market report also includes key purchase criteria and drivers of price sensitivity to help companies evaluate and develop their market growth analysis strategies.

Customer Landscape of Traffic Control Services Industry

Competitive Landscape

Companies are implementing various strategies, such as strategic alliances, traffic control services market forecast, partnerships, mergers and acquisitions, geographical expansion, and product/service launches, to enhance their presence in the industry.

Acme Barricades - Provides rental and installation of temporary traffic control devices, specializing in barricades and message boards for highway construction projects.

The industry research and growth report includes detailed analyses of the competitive landscape of the market and information about key companies, including:

  • Acme Barricades
  • Altus Traffic
  • AWP Safety
  • BUKO Traffic and Safety
  • Chevron Traffic Management
  • Colorado Barricade Co.
  • Core Highways
  • D and D Traffic Management
  • Flagger Force LLC
  • Go Traffic Management
  • Hatton Traffic Management Ltd.
  • Highway Traffic Management
  • Premier Traffic Management
  • RoadSafe Traffic Systems Inc.
  • Roadway Construction Service
  • Traffic Group Australia
  • Traffic Management Inc.
  • Traffic Management NZ
  • Verifact Traffic

Qualitative and quantitative analysis of companies has been conducted to help clients understand the wider business environment as well as the strengths and weaknesses of key industry players. Data is qualitatively analyzed to categorize companies as pure play, category-focused, industry-focused, and diversified; it is quantitatively analyzed to categorize companies as dominant, leading, strong, tentative, and weak.

Recent Development and News in Traffic control services market

  • In December, 2024, Q-Free secured a contract for a comprehensive roadside tolling system project, which includes a twelve-year service and maintenance agreement.
  • In January, 2025, AWP Safety expanded its US footprint by acquiring three regional traffic control companies: Site Barricades, Integrity Traffic, and WS Barricade.
  • In March, 2025, Parsons Corp. was selected by the Virginia Department of Transportation to provide traffic engineering and operational support services for the congested Northern Virginia district.
  • In May, 2025, Kapsch TrafficCom completed the deployment of a state-of-the-art Tunnel Management System for the Greater Florianopolis Ring Road in Brazil.

Dive into Technavio’s robust research methodology, blending expert interviews, extensive data synthesis, and validated models for unparalleled Traffic Control Services Market insights. See full methodology.

Market Scope
Page number 294
Base year 2025
Historic period 2020-2024
Forecast period 2026-2030
Growth momentum & CAGR Accelerate at a CAGR of 9.2%
Market growth 2026-2030 USD 10955.7 million
Market structure Fragmented
YoY growth 2025-2026(%) 8.3%
Key countries US, Canada, Mexico, Germany, UK, France, Italy, Spain, The Netherlands, China, India, Japan, South Korea, Australia, Indonesia, Brazil, Argentina, Chile, UAE, Saudi Arabia, South Africa, Egypt and Israel
Competitive landscape Leading Companies, Market Positioning of Companies, Competitive Strategies, and Industry Risks

Request Free Sample

Research Analyst Overview

  • The traffic control services market is undergoing a structural shift driven by technology convergence. The integration of AI-powered detection, automated enforcement networks, and cooperative intelligent transport systems is redefining service delivery. Boardroom decisions are increasingly centered on shifting from capital-intensive asset ownership to flexible, performance-based service contracts, a model that can reduce initial capital outlay by over 40%.
  • This transition demands expertise in managing complex digital ecosystems, including advanced traffic management system platforms and multi-lane free-flow tolling. Service providers must now demonstrate proficiency in everything from traffic signal coordination and pedestrian flow analysis to the deployment of automated flagger assistance devices.
  • The market values holistic solutions that combine permanent traffic control maintenance with dynamic temporary traffic control for work zones. Expertise in areas like tunnel management system operations, vehicle-to-everything connectivity, and section speed control is becoming a key differentiator.
  • Success depends on the ability to leverage real-time traffic data through a cohesive digital mobility platform, ensuring robust incident response and optimized public transit priority. This data-centric approach is critical for everything from creating accurate traffic control drawings to executing complex road user charging schemes.

What are the Key Data Covered in this Traffic Control Services Market Research and Growth Report?

  • What is the expected growth of the Traffic Control Services Market between 2026 and 2030?

    • USD 10.96 billion, at a CAGR of 9.2%

  • What segmentation does the market report cover?

    • The report is segmented by Type (Event safety, Traffic pacing, Advanced warning sign installation, Traffic control drawings, and Others), Application (Highway, Street, and Others), Deployment (Permanent traffic control, and Temporary traffic control) and Geography (North America, Europe, APAC, South America, Middle East and Africa)

  • Which regions are analyzed in the report?

    • North America, Europe, APAC, South America and Middle East and Africa

  • What are the key growth drivers and market challenges?

    • Operational modernization and TSMO adoption, Workforce scarcity and operational safety risks

  • Who are the major players in the Traffic Control Services Market?

    • Acme Barricades, Altus Traffic, AWP Safety, BUKO Traffic and Safety, Chevron Traffic Management, Colorado Barricade Co., Core Highways, D and D Traffic Management, Flagger Force LLC, Go Traffic Management, Hatton Traffic Management Ltd., Highway Traffic Management, Premier Traffic Management, RoadSafe Traffic Systems Inc., Roadway Construction Service, Traffic Group Australia, Traffic Management Inc., Traffic Management NZ and Verifact Traffic

Market Research Insights

  • The traffic control services market is defined by a shift toward outsourced and technologically advanced solutions. Municipalities leveraging third-party traffic management services for traffic data analytics report up to a 20% reduction in urban gridlock.
  • The adoption of formal traffic control plans and proactive road safety audits has become critical for infrastructure asset management, with firms demonstrating certified traffic safety protocols seeing lower insurance premiums. Comprehensive work zone traffic management, which includes temporary barricades installation and active remote traffic monitoring, improves work zone crew safety compliance by over 30%.
  • This evolution underscores the move from basic equipment rental to strategic partnerships focused on measurable traffic flow optimization and public safety outcomes through robust digital traffic management.

We can help! Our analysts can customize this traffic control services market research report to meet your requirements.

Get in touch

1. Executive Summary

1.1 Market overview

Executive Summary - Chart on Market Overview
Executive Summary - Data Table on Market Overview
Executive Summary - Chart on Global Market Characteristics
Executive Summary - Chart on Market by Geography
Executive Summary - Chart on Market Segmentation by Type
Executive Summary - Chart on Market Segmentation by Application
Executive Summary - Chart on Market Segmentation by Deployment
Executive Summary - Chart on Incremental Growth
Executive Summary - Data Table on Incremental Growth
Executive Summary - Chart on Company Market Positioning

2. Technavio Analysis

2.1 Analysis of price sensitivity, lifecycle, customer purchase basket, adoption rates, and purchase criteria

2.2 Criticality of inputs and Factors of differentiation

Chart on Overview on criticality of inputs and factors of differentiation

2.3 Factors of disruption

Chart on Overview on factors of disruption

2.4 Impact of drivers and challenges

Chart on Impact of drivers and challenges in 2025 and 2030

3. Market Landscape

3.1 Market ecosystem

Chart on Parent Market
Data Table on - Parent Market

3.2 Market characteristics

Chart on Market characteristics analysis

3.3 Value chain analysis

Chart on Value chain analysis

4. Market Sizing

4.1 Market definition

Data Table on Offerings of companies included in the market definition

4.2 Market segment analysis

Market segments

4.3 Market size 2025

4.4 Market outlook: Forecast for 2025-2030

Chart on Global - Market size and forecast 2025-2030 ($ million)
Data Table on Global - Market size and forecast 2025-2030 ($ million)
Chart on Global Market: Year-over-year growth 2025-2030 (%)
Data Table on Global Market: Year-over-year growth 2025-2030 (%)

5. Historic Market Size

5.1 Global Traffic Control Services Market 2020 - 2024

Historic Market Size - Data Table on Global Traffic Control Services Market 2020 - 2024 ($ million)

5.2 Type segment analysis 2020 - 2024

Historic Market Size - Type Segment 2020 - 2024 ($ million)

5.3 Application segment analysis 2020 - 2024

Historic Market Size - Application Segment 2020 - 2024 ($ million)

5.4 Deployment segment analysis 2020 - 2024

Historic Market Size - Deployment Segment 2020 - 2024 ($ million)

5.5 Geography segment analysis 2020 - 2024

Historic Market Size - Geography Segment 2020 - 2024 ($ million)

5.6 Country segment analysis 2020 - 2024

Historic Market Size - Country Segment 2020 - 2024 ($ million)

6. Qualitative Analysis

6.1 Impact of AI on the Global Traffic Control Services Market

7. Five Forces Analysis

7.1 Five forces summary

Five forces analysis - Comparison between 2025 and 2030

7.2 Bargaining power of buyers

Bargaining power of buyers - Impact of key factors 2025 and 2030

7.3 Bargaining power of suppliers

Bargaining power of suppliers - Impact of key factors in 2025 and 2030

7.4 Threat of new entrants

Threat of new entrants - Impact of key factors in 2025 and 2030

7.5 Threat of substitutes

Threat of substitutes - Impact of key factors in 2025 and 2030

7.6 Threat of rivalry

Threat of rivalry - Impact of key factors in 2025 and 2030

7.7 Market condition

Chart on Market condition - Five forces 2025 and 2030

8. Market Segmentation by Type

8.1 Market segments

Chart on Type - Market share 2025-2030 (%)
Data Table on Type - Market share 2025-2030 (%)

8.2 Comparison by Type

Chart on Comparison by Type
Data Table on Comparison by Type

8.3 Event safety - Market size and forecast 2025-2030

Chart on Event safety - Market size and forecast 2025-2030 ($ million)
Data Table on Event safety - Market size and forecast 2025-2030 ($ million)
Chart on Event safety - Year-over-year growth 2025-2030 (%)
Data Table on Event safety - Year-over-year growth 2025-2030 (%)

8.4 Traffic pacing - Market size and forecast 2025-2030

Chart on Traffic pacing - Market size and forecast 2025-2030 ($ million)
Data Table on Traffic pacing - Market size and forecast 2025-2030 ($ million)
Chart on Traffic pacing - Year-over-year growth 2025-2030 (%)
Data Table on Traffic pacing - Year-over-year growth 2025-2030 (%)

8.5 Advanced warning sign installation - Market size and forecast 2025-2030

Chart on Advanced warning sign installation - Market size and forecast 2025-2030 ($ million)
Data Table on Advanced warning sign installation - Market size and forecast 2025-2030 ($ million)
Chart on Advanced warning sign installation - Year-over-year growth 2025-2030 (%)
Data Table on Advanced warning sign installation - Year-over-year growth 2025-2030 (%)

8.6 Traffic control drawings - Market size and forecast 2025-2030

Chart on Traffic control drawings - Market size and forecast 2025-2030 ($ million)
Data Table on Traffic control drawings - Market size and forecast 2025-2030 ($ million)
Chart on Traffic control drawings - Year-over-year growth 2025-2030 (%)
Data Table on Traffic control drawings - Year-over-year growth 2025-2030 (%)

8.7 Others - Market size and forecast 2025-2030

Chart on Others - Market size and forecast 2025-2030 ($ million)
Data Table on Others - Market size and forecast 2025-2030 ($ million)
Chart on Others - Year-over-year growth 2025-2030 (%)
Data Table on Others - Year-over-year growth 2025-2030 (%)

8.8 Market opportunity by Type

Market opportunity by Type ($ million)
Data Table on Market opportunity by Type ($ million)

9. Market Segmentation by Application

9.1 Market segments

Chart on Application - Market share 2025-2030 (%)
Data Table on Application - Market share 2025-2030 (%)

9.2 Comparison by Application

Chart on Comparison by Application
Data Table on Comparison by Application

9.3 Highway - Market size and forecast 2025-2030

Chart on Highway - Market size and forecast 2025-2030 ($ million)
Data Table on Highway - Market size and forecast 2025-2030 ($ million)
Chart on Highway - Year-over-year growth 2025-2030 (%)
Data Table on Highway - Year-over-year growth 2025-2030 (%)

9.4 Street - Market size and forecast 2025-2030

Chart on Street - Market size and forecast 2025-2030 ($ million)
Data Table on Street - Market size and forecast 2025-2030 ($ million)
Chart on Street - Year-over-year growth 2025-2030 (%)
Data Table on Street - Year-over-year growth 2025-2030 (%)

9.5 Others - Market size and forecast 2025-2030

Chart on Others - Market size and forecast 2025-2030 ($ million)
Data Table on Others - Market size and forecast 2025-2030 ($ million)
Chart on Others - Year-over-year growth 2025-2030 (%)
Data Table on Others - Year-over-year growth 2025-2030 (%)

9.6 Market opportunity by Application

Market opportunity by Application ($ million)
Data Table on Market opportunity by Application ($ million)

10. Market Segmentation by Deployment

10.1 Market segments

Chart on Deployment - Market share 2025-2030 (%)
Data Table on Deployment - Market share 2025-2030 (%)

10.2 Comparison by Deployment

Chart on Comparison by Deployment
Data Table on Comparison by Deployment

10.3 Permanent traffic control - Market size and forecast 2025-2030

Chart on Permanent traffic control - Market size and forecast 2025-2030 ($ million)
Data Table on Permanent traffic control - Market size and forecast 2025-2030 ($ million)
Chart on Permanent traffic control - Year-over-year growth 2025-2030 (%)
Data Table on Permanent traffic control - Year-over-year growth 2025-2030 (%)

10.4 Temporary traffic control - Market size and forecast 2025-2030

Chart on Temporary traffic control - Market size and forecast 2025-2030 ($ million)
Data Table on Temporary traffic control - Market size and forecast 2025-2030 ($ million)
Chart on Temporary traffic control - Year-over-year growth 2025-2030 (%)
Data Table on Temporary traffic control - Year-over-year growth 2025-2030 (%)

10.5 Market opportunity by Deployment

Market opportunity by Deployment ($ million)
Data Table on Market opportunity by Deployment ($ million)

11. Customer Landscape

11.1 Customer landscape overview

Analysis of price sensitivity, lifecycle, customer purchase basket, adoption rates, and purchase criteria

12. Geographic Landscape

12.1 Geographic segmentation

Chart on Market share by geography 2025-2030 (%)
Data Table on Market share by geography 2025-2030 (%)

12.2 Geographic comparison

Chart on Geographic comparison
Data Table on Geographic comparison

12.3 North America - Market size and forecast 2025-2030

Chart on North America - Market size and forecast 2025-2030 ($ million)
Data Table on North America - Market size and forecast 2025-2030 ($ million)
Chart on North America - Year-over-year growth 2025-2030 (%)
Data Table on North America - Year-over-year growth 2025-2030 (%)
Chart on Regional Comparison - North America
Data Table on Regional Comparison - North America

12.3.1 US - Market size and forecast 2025-2030

Chart on US - Market size and forecast 2025-2030 ($ million)
Data Table on US - Market size and forecast 2025-2030 ($ million)
Chart on US - Year-over-year growth 2025-2030 (%)
Data Table on US - Year-over-year growth 2025-2030 (%)

12.3.2 Canada - Market size and forecast 2025-2030

Chart on Canada - Market size and forecast 2025-2030 ($ million)
Data Table on Canada - Market size and forecast 2025-2030 ($ million)
Chart on Canada - Year-over-year growth 2025-2030 (%)
Data Table on Canada - Year-over-year growth 2025-2030 (%)

12.3.3 Mexico - Market size and forecast 2025-2030

Chart on Mexico - Market size and forecast 2025-2030 ($ million)
Data Table on Mexico - Market size and forecast 2025-2030 ($ million)
Chart on Mexico - Year-over-year growth 2025-2030 (%)
Data Table on Mexico - Year-over-year growth 2025-2030 (%)

12.4 Europe - Market size and forecast 2025-2030

Chart on Europe - Market size and forecast 2025-2030 ($ million)
Data Table on Europe - Market size and forecast 2025-2030 ($ million)
Chart on Europe - Year-over-year growth 2025-2030 (%)
Data Table on Europe - Year-over-year growth 2025-2030 (%)
Chart on Regional Comparison - Europe
Data Table on Regional Comparison - Europe

12.4.1 Germany - Market size and forecast 2025-2030

Chart on Germany - Market size and forecast 2025-2030 ($ million)
Data Table on Germany - Market size and forecast 2025-2030 ($ million)
Chart on Germany - Year-over-year growth 2025-2030 (%)
Data Table on Germany - Year-over-year growth 2025-2030 (%)

12.4.2 UK - Market size and forecast 2025-2030

Chart on UK - Market size and forecast 2025-2030 ($ million)
Data Table on UK - Market size and forecast 2025-2030 ($ million)
Chart on UK - Year-over-year growth 2025-2030 (%)
Data Table on UK - Year-over-year growth 2025-2030 (%)

12.4.3 France - Market size and forecast 2025-2030

Chart on France - Market size and forecast 2025-2030 ($ million)
Data Table on France - Market size and forecast 2025-2030 ($ million)
Chart on France - Year-over-year growth 2025-2030 (%)
Data Table on France - Year-over-year growth 2025-2030 (%)

12.4.4 Italy - Market size and forecast 2025-2030

Chart on Italy - Market size and forecast 2025-2030 ($ million)
Data Table on Italy - Market size and forecast 2025-2030 ($ million)
Chart on Italy - Year-over-year growth 2025-2030 (%)
Data Table on Italy - Year-over-year growth 2025-2030 (%)

12.4.5 Spain - Market size and forecast 2025-2030

Chart on Spain - Market size and forecast 2025-2030 ($ million)
Data Table on Spain - Market size and forecast 2025-2030 ($ million)
Chart on Spain - Year-over-year growth 2025-2030 (%)
Data Table on Spain - Year-over-year growth 2025-2030 (%)

12.4.6 The Netherlands - Market size and forecast 2025-2030

Chart on The Netherlands - Market size and forecast 2025-2030 ($ million)
Data Table on The Netherlands - Market size and forecast 2025-2030 ($ million)
Chart on The Netherlands - Year-over-year growth 2025-2030 (%)
Data Table on The Netherlands - Year-over-year growth 2025-2030 (%)

12.5 APAC - Market size and forecast 2025-2030

Chart on APAC - Market size and forecast 2025-2030 ($ million)
Data Table on APAC - Market size and forecast 2025-2030 ($ million)
Chart on APAC - Year-over-year growth 2025-2030 (%)
Data Table on APAC - Year-over-year growth 2025-2030 (%)
Chart on Regional Comparison - APAC
Data Table on Regional Comparison - APAC

12.5.1 China - Market size and forecast 2025-2030

Chart on China - Market size and forecast 2025-2030 ($ million)
Data Table on China - Market size and forecast 2025-2030 ($ million)
Chart on China - Year-over-year growth 2025-2030 (%)
Data Table on China - Year-over-year growth 2025-2030 (%)

12.5.2 India - Market size and forecast 2025-2030

Chart on India - Market size and forecast 2025-2030 ($ million)
Data Table on India - Market size and forecast 2025-2030 ($ million)
Chart on India - Year-over-year growth 2025-2030 (%)
Data Table on India - Year-over-year growth 2025-2030 (%)

12.5.3 Japan - Market size and forecast 2025-2030

Chart on Japan - Market size and forecast 2025-2030 ($ million)
Data Table on Japan - Market size and forecast 2025-2030 ($ million)
Chart on Japan - Year-over-year growth 2025-2030 (%)
Data Table on Japan - Year-over-year growth 2025-2030 (%)

12.5.4 South Korea - Market size and forecast 2025-2030

Chart on South Korea - Market size and forecast 2025-2030 ($ million)
Data Table on South Korea - Market size and forecast 2025-2030 ($ million)
Chart on South Korea - Year-over-year growth 2025-2030 (%)
Data Table on South Korea - Year-over-year growth 2025-2030 (%)

12.5.5 Australia - Market size and forecast 2025-2030

Chart on Australia - Market size and forecast 2025-2030 ($ million)
Data Table on Australia - Market size and forecast 2025-2030 ($ million)
Chart on Australia - Year-over-year growth 2025-2030 (%)
Data Table on Australia - Year-over-year growth 2025-2030 (%)

12.5.6 Indonesia - Market size and forecast 2025-2030

Chart on Indonesia - Market size and forecast 2025-2030 ($ million)
Data Table on Indonesia - Market size and forecast 2025-2030 ($ million)
Chart on Indonesia - Year-over-year growth 2025-2030 (%)
Data Table on Indonesia - Year-over-year growth 2025-2030 (%)

12.6 South America - Market size and forecast 2025-2030

Chart on South America - Market size and forecast 2025-2030 ($ million)
Data Table on South America - Market size and forecast 2025-2030 ($ million)
Chart on South America - Year-over-year growth 2025-2030 (%)
Data Table on South America - Year-over-year growth 2025-2030 (%)
Chart on Regional Comparison - South America
Data Table on Regional Comparison - South America

12.6.1 Brazil - Market size and forecast 2025-2030

Chart on Brazil - Market size and forecast 2025-2030 ($ million)
Data Table on Brazil - Market size and forecast 2025-2030 ($ million)
Chart on Brazil - Year-over-year growth 2025-2030 (%)
Data Table on Brazil - Year-over-year growth 2025-2030 (%)

12.6.2 Argentina - Market size and forecast 2025-2030

Chart on Argentina - Market size and forecast 2025-2030 ($ million)
Data Table on Argentina - Market size and forecast 2025-2030 ($ million)
Chart on Argentina - Year-over-year growth 2025-2030 (%)
Data Table on Argentina - Year-over-year growth 2025-2030 (%)

12.6.3 Chile - Market size and forecast 2025-2030

Chart on Chile - Market size and forecast 2025-2030 ($ million)
Data Table on Chile - Market size and forecast 2025-2030 ($ million)
Chart on Chile - Year-over-year growth 2025-2030 (%)
Data Table on Chile - Year-over-year growth 2025-2030 (%)

12.7 Middle East and Africa - Market size and forecast 2025-2030

Chart on Middle East and Africa - Market size and forecast 2025-2030 ($ million)
Data Table on Middle East and Africa - Market size and forecast 2025-2030 ($ million)
Chart on Middle East and Africa - Year-over-year growth 2025-2030 (%)
Data Table on Middle East and Africa - Year-over-year growth 2025-2030 (%)
Chart on Regional Comparison - Middle East and Africa
Data Table on Regional Comparison - Middle East and Africa

12.7.1 UAE - Market size and forecast 2025-2030

Chart on UAE - Market size and forecast 2025-2030 ($ million)
Data Table on UAE - Market size and forecast 2025-2030 ($ million)
Chart on UAE - Year-over-year growth 2025-2030 (%)
Data Table on UAE - Year-over-year growth 2025-2030 (%)

12.7.2 Saudi Arabia - Market size and forecast 2025-2030

Chart on Saudi Arabia - Market size and forecast 2025-2030 ($ million)
Data Table on Saudi Arabia - Market size and forecast 2025-2030 ($ million)
Chart on Saudi Arabia - Year-over-year growth 2025-2030 (%)
Data Table on Saudi Arabia - Year-over-year growth 2025-2030 (%)

12.7.3 South Africa - Market size and forecast 2025-2030

Chart on South Africa - Market size and forecast 2025-2030 ($ million)
Data Table on South Africa - Market size and forecast 2025-2030 ($ million)
Chart on South Africa - Year-over-year growth 2025-2030 (%)
Data Table on South Africa - Year-over-year growth 2025-2030 (%)

12.7.4 Egypt - Market size and forecast 2025-2030

Chart on Egypt - Market size and forecast 2025-2030 ($ million)
Data Table on Egypt - Market size and forecast 2025-2030 ($ million)
Chart on Egypt - Year-over-year growth 2025-2030 (%)
Data Table on Egypt - Year-over-year growth 2025-2030 (%)

12.7.5 Israel - Market size and forecast 2025-2030

Chart on Israel - Market size and forecast 2025-2030 ($ million)
Data Table on Israel - Market size and forecast 2025-2030 ($ million)
Chart on Israel - Year-over-year growth 2025-2030 (%)
Data Table on Israel - Year-over-year growth 2025-2030 (%)

12.8 Market opportunity by geography

Market opportunity by geography ($ million)
Data Tables on Market opportunity by geography ($ million)

13. Drivers, Challenges, and Opportunity

13.1 Market drivers

Operational modernization and TSMO adoption
Expansion of automated enforcement networks
Technological reliability and performance-based contracting

13.2 Market challenges

Workforce scarcity and operational safety risks
Public funding volatility and tender delays
Technological integration and cybersecurity threats

13.3 Impact of drivers and challenges

Impact of drivers and challenges in 2025 and 2030

13.4 Market opportunities

Integration of AI-driven ecosystems
Modernization of tolling and revenue collection
Strategic ITS deployment and infrastructure corridors

14. Competitive Landscape

14.1 Overview

14.2

Overview on criticality of inputs and factors of differentiation

14.3 Landscape disruption

Overview on factors of disruption

14.4 Industry risks

Impact of key risks on business

15. Competitive Analysis

15.1 Companies profiled

Companies covered

15.2 Company ranking index

15.3 Market positioning of companies

Matrix on companies position and classification

15.4 Acme Barricades

Acme Barricades - Overview
Acme Barricades - Product / Service
Acme Barricades - Key offerings
SWOT

15.5 Altus Traffic

Altus Traffic - Overview
Altus Traffic - Product / Service
Altus Traffic - Key offerings
SWOT

15.6 AWP Safety

AWP Safety - Overview
AWP Safety - Product / Service
AWP Safety - Key offerings
SWOT

15.7 BUKO Traffic and Safety

BUKO Traffic and Safety - Overview
BUKO Traffic and Safety - Product / Service
BUKO Traffic and Safety - Key offerings
SWOT

15.8 Chevron Traffic Management

Chevron Traffic Management - Overview
Chevron Traffic Management - Product / Service
Chevron Traffic Management - Key offerings
SWOT

15.9 Colorado Barricade Co.

Colorado Barricade Co. - Overview
Colorado Barricade Co. - Product / Service
Colorado Barricade Co. - Key offerings
SWOT

15.10 D and D Traffic Management

D and D Traffic Management - Overview
D and D Traffic Management - Product / Service
D and D Traffic Management - Key offerings
SWOT

15.11 Flagger Force LLC

Flagger Force LLC - Overview
Flagger Force LLC - Product / Service
Flagger Force LLC - Key offerings
SWOT

15.12 Premier Traffic Management

Premier Traffic Management - Overview
Premier Traffic Management - Product / Service
Premier Traffic Management - Key offerings
SWOT

15.13 RoadSafe Traffic Systems Inc.

RoadSafe Traffic Systems Inc. - Overview
RoadSafe Traffic Systems Inc. - Product / Service
RoadSafe Traffic Systems Inc. - Key offerings
SWOT

15.14 Roadway Construction Service

Roadway Construction Service - Overview
Roadway Construction Service - Product / Service
Roadway Construction Service - Key offerings
SWOT

15.15 Traffic Group Australia

Traffic Group Australia - Overview
Traffic Group Australia - Product / Service
Traffic Group Australia - Key offerings
SWOT

15.16 Traffic Management Inc.

Traffic Management Inc. - Overview
Traffic Management Inc. - Product / Service
Traffic Management Inc. - Key offerings
SWOT

15.17 Traffic Management NZ

Traffic Management NZ - Overview
Traffic Management NZ - Product / Service
Traffic Management NZ - Key offerings
SWOT

15.18 Verifact Traffic

Verifact Traffic - Overview
Verifact Traffic - Product / Service
Verifact Traffic - Key offerings
SWOT

16. Appendix

16.1 Scope of the report

Market definition
Objectives
Notes and caveats

16.2 Inclusions and exclusions checklist

Inclusions checklist
Exclusions checklist

16.3 Currency conversion rates for US$

16.4 Research methodology

16.5 Data procurement

Information sources

16.6 Data validation

16.7 Validation techniques employed for market sizing

16.8 Data synthesis

16.9 360 degree market analysis

16.10 List of abbreviations

Research Methodology

Technavio presents a detailed picture of the market by way of study, synthesis, and summation of data from multiple sources. The analysts have presented the various facets of the market with a particular focus on identifying the key industry influencers. The data thus presented is comprehensive, reliable, and the result of extensive research, both primary and secondary.

INFORMATION SOURCES

Primary sources

  • Manufacturers and suppliers
  • Channel partners
  • Industry experts
  • Strategic decision makers

Secondary sources

  • Industry journals and periodicals
  • Government data
  • Financial reports of key industry players
  • Historical data
  • Press releases

DATA ANALYSIS

Data Synthesis

  • Collation of data
  • Estimation of key figures
  • Analysis of derived insights

Data Validation

  • Triangulation with data models
  • Reference against proprietary databases
  • Corroboration with industry experts

REPORT WRITING

Qualitative

  • Market drivers
  • Market challenges
  • Market trends
  • Five forces analysis

Quantitative

  • Market size and forecast
  • Market segmentation
  • Geographical insights
  • Competitive landscape

Interested in this report?

Get your sample now to see our research methodology and insights!

Download Now

Frequently Asked Questions

Traffic Control Services market growth will increase by USD 10955.7 million during 2026-2030.

The Traffic Control Services market is expected to grow at a CAGR of 9.2% during 2026-2030.

Traffic Control Services market is segmented by Type (Event safety, Traffic pacing, Advanced warning sign installation, Traffic control drawings, Others) Application (Highway, Street, Others) Deployment (Permanent traffic control, Temporary traffic control)

Acme Barricades, Altus Traffic, AWP Safety, BUKO Traffic and Safety, Chevron Traffic Management, Colorado Barricade Co., Core Highways, D and D Traffic Management, Flagger Force LLC, Go Traffic Management, Hatton Traffic Management Ltd., Highway Traffic Management, Premier Traffic Management, RoadSafe Traffic Systems Inc., Roadway Construction Service, Traffic Group Australia, Traffic Management Inc., Traffic Management NZ, Verifact Traffic are a few of the key vendors in the Traffic Control Services market.

North America will register the highest growth rate of 41.9% among the other regions. Therefore, the Traffic Control Services market in North America is expected to garner significant business opportunities for the vendors during the forecast period.

US, Canada, Mexico, Germany, UK, France, Italy, Spain, The Netherlands, China, India, Japan, South Korea, Australia, Indonesia, Brazil, Argentina, Chile, UAE, Saudi Arabia, South Africa, Egypt, Israel

  • Operational modernization and TSMO adoption is the driving factor this market.

The Traffic Control Services market vendors should focus on grabbing business opportunities from the Type segment as it accounted for the largest market share in the base year.
RIA - Research AI Assistant
Ask RIA