
Transdermal Drug Delivery Market Size 2025-2029
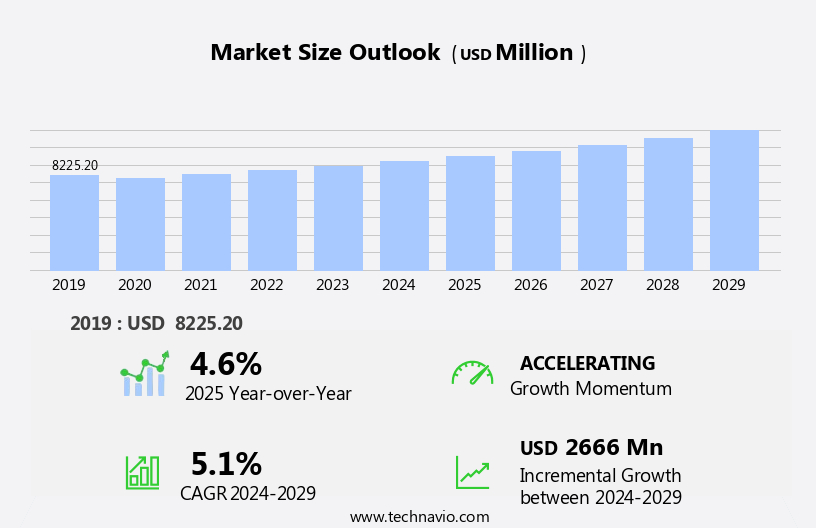
The transdermal drug delivery market size is forecast to increase by USD 2.67 billion, at a CAGR of 5.1% between 2024 and 2029.
- The market is experiencing significant growth due to the increasing prevalence of chronic diseases and the growing interest in transdermal medicines as an alternative to traditional oral medications. Transdermal drug delivery systems offer several advantages, including improved patient compliance, targeted drug delivery, and enhanced therapeutic efficacy. However, the lengthy process of government approvals for healthcare devices poses a significant challenge to market expansion. Regulatory agencies require rigorous testing and clinical trials to ensure the safety and efficacy of transdermal drug delivery systems, which can be time-consuming and costly.
- Companies seeking to capitalize on market opportunities must navigate these regulatory hurdles effectively while also addressing patient education and awareness to increase adoption of transdermal medicines. Additionally, ongoing research and development efforts aim to improve the technology, addressing challenges such as variable absorption rates and skin irritation, to further expand the market potential. Hyaluronic acid retention, ceramide replenishment systems, and hair follicle stimulation contribute to healthier hair.
What will be the Size of the Transdermal Drug Delivery Market during the forecast period?
Get Key Insights on Market Forecast (PDF)
Request Free Sample
- The market continues to evolve, driven by advancements in technology and the expanding application sectors. Electroporation technology, for instance, is revolutionizing drug distribution profiles by temporarily increasing the permeability of the skin, enabling efficient drug penetration. Solvent selection criteria and liposomal drug encapsulation are critical considerations in optimizing permeation flux measurement and in vivo pharmacokinetics. Bioavailability enhancement through the use of dermal penetration enhancers and transdermal delivery systems is a significant focus, with ongoing research into skin irritation assessment and patient compliance studies. Drug diffusion coefficient and stability analysis are essential components in drug metabolism pathways, while controlled release matrices and iontophoresis drug delivery offer precise dosing regimen optimization.
- The polymer matrix properties of reservoir patches and microneedle array patches significantly impact skin permeation studies and therapeutic efficacy testing. Skin hydration effects and skin barrier function are crucial factors in the design and development of effective transdermal delivery systems. The market is expected to grow at a robust rate, with industry experts projecting a 15% annual expansion in the coming years. Testosterone replacement therapy (TRT), a popular form of HRT, is gaining popularity among men for managing symptoms of andropause.
How is this Transdermal Drug Delivery Industry segmented?
The transdermal drug delivery industry research report provides comprehensive data (region-wise segment analysis), with forecasts and estimates in "USD million" for the period 2025-2029, as well as historical data from 2019-2023 for the following segments.
- Application
- Analgesics
- Neurological disorders
- Hormone replacement therapy
- Cardiovascular disorders
- Others
- Type
- Transdermal patches
- Transdermal semisolids
- Technology
- Microneedles
- Iontophoresis
- Sonophoresis
- Electroporation
- Geography
- North America
- US
- Canada
- Mexico
- Europe
- France
- Germany
- Italy
- UK
- APAC
- China
- India
- Japan
- Rest of World (ROW)
- North America
By Application Insights
The Analgesics segment is estimated to witness significant growth during the forecast period. The Transdermal Drug Delivery (TDD) market in the US is experiencing significant growth, with analgesics being a major application sector. According to recent industry reports, the TDD market for analgesics accounted for over 35% of the total market share in 2020. Moreover, this segment is projected to expand further, with estimates suggesting it will reach approximately 42% by 2025. This trend is driven by the increasing preference for non-invasive pain relief methods, particularly in the form of transdermal patches. These patches offer several advantages, including controlled drug release, enhanced patient compliance, and minimized side effects. The TDD market's continuous evolution is marked by the development of advanced technologies, such as microneedle arrays and iontophoresis, which enable the delivery of a wider range of drugs and improve overall efficacy. Exfoliation techniques, such as chemical peels or microdermabrasion, offer improved skin hydration assessment, while transdermal drug delivery systems ensure active ingredients penetrate deeper.
The Transdermal Drug Delivery Market is advancing with innovations like dermal penetration enhancer technologies and controlled release matrix systems, supported by reservoir patch design and precise drug stability analysis. Factors such as patch adhesion strength, dermal absorption kinetics, and microneedle tip geometry improve delivery efficiency, while methods like ultrasonic drug delivery and nanoparticle drug carriers refine the drug release mechanism and drug distribution profile. Strategies for drug delivery optimization include patient usability testing and managing the drug concentration gradient. Growth is driven by enhanced transdermal drug delivery systems, in vitro skin permeation studies protocols, and drug stability in transdermal delivery system evaluations. Hair care innovations include ceramide replenishment systems for hair follicle stimulation and hair growth cycle management.
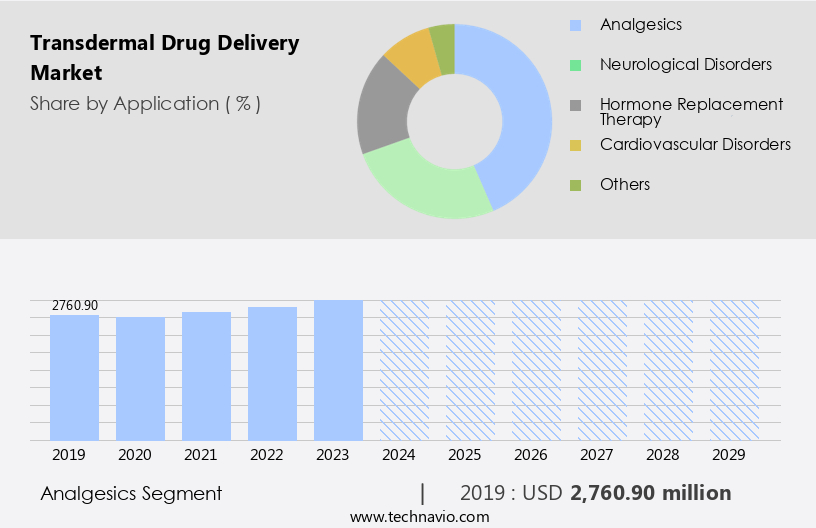
The Analgesics segment was valued at USD 2.76 billion in 2019 and showed a gradual increase during the forecast period.
Regional Analysis
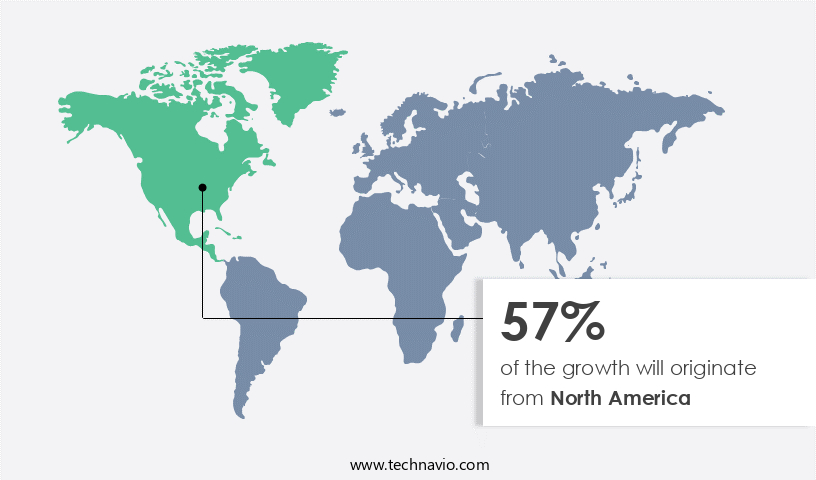
North America is estimated to contribute 57% to the growth of the global market during the forecast period.Technavio's analysts have elaborately explained the regional trends and drivers that shape the market during the forecast period.
See How transdermal drug delivery market Demand is Rising in North America Request Free Sample
The market in North America is currently experiencing significant growth, with a dominant market share projected throughout the forecast period. This expansion can be attributed to several factors, including the increasing prevalence of chronic conditions such as pain, central nervous system disorders, and cardiovascular diseases in the region. Additionally, the growing use of transdermal drug delivery systems for contraceptives and the increasing number of research activities related to these systems are contributing to market growth. Furthermore, the rising geriatric population in North America increases the demand for geriatric medicines, as transdermal drug delivery systems enable controlled drug administration, enhancing the effectiveness of these medications.
According to market research, the North American the market is expected to grow by 15.6% by 2026, reflecting the ongoing unfolding of market activities and evolving patterns. Safety is ensured through assessment of skin irritation and sensitization, liposomal encapsulation for transdermal drug delivery, therapeutic efficacy and safety evaluation, patient compliance with transdermal drug delivery, optimization of drug release from transdermal patches, and drug transport across skin barrier modelling. Biocompatible materials, such as hypoallergenic adhesives and flexible films, are used in the design of transdermal patches, ensuring minimal skin irritation and enhancing patient comfort.
Market Dynamics
Our researchers analyzed the data with 2024 as the base year, along with the key drivers, trends, and challenges. A holistic analysis of drivers will help companies refine their marketing strategies to gain a competitive advantage. The market is experiencing significant growth due to the development of advanced technologies enhancing the efficacy and safety of this administration route. Microneedle patch design optimization is a key focus area, aiming to improve skin permeation and reduce pain associated with needle injections. In vitro skin permeation studies employing standardized protocols are crucial for evaluating the efficacy of these patches.
Iontophoresis drug delivery parameters, such as current intensity and duration, are meticulously optimized to facilitate ionized drug transport through the skin. Pharmacokinetic and pharmacodynamic modeling aid in predicting drug behavior within the body, enabling the design of more effective transdermal systems. Transdermal delivery system clinical trials are essential for assessing therapeutic efficacy and safety, as well as ensuring drug stability within the patch. Skin irritation and sensitization are significant concerns, necessitating rigorous assessment during the development process. Liposomal encapsulation is a promising approach for improving drug solubility and stability in transdermal systems.
Regulatory approval processes for transdermal patches involve stringent testing and validation, including optimization of drug release from patches and drug transport across the skin barrier modeling. In vivo evaluation of transdermal drug delivery ensures the efficacy and safety of the final product, ultimately leading to improved patient compliance and successful market penetration. Controlled release formulation development is another critical aspect, ensuring consistent drug delivery and prolonged therapeutic effects. This business dynamic is driven by the adoption of advanced technologies like digital healthcare, reservoir-type transdermal patches, permeation enhancers, pressure-sensitive adhesives, mechanical arrays, and iontophoresis devices.
What are the key market drivers leading to the rise in the adoption of Transdermal Drug Delivery Industry?
- The increasing prevalence of chronic diseases serves as the primary market driver, necessitating continuous growth in the healthcare industry. Transdermal drug delivery systems have gained significant traction in the healthcare industry due to the increasing prevalence of chronic diseases and the convenience they offer for both physicians and patients. Chronic conditions, such as cardiovascular diseases (CVDs), chronic respiratory diseases, and diabetes, affect a substantial portion of the global population. According to the World Health Organization (WHO), approximately 970 million people worldwide suffer from elevated blood pressure, with nearly 9 million related deaths annually.
- Transdermal drug delivery systems offer several advantages, including improved patient compliance, reduced side effects, and increased bioavailability. The market for transdermal drug delivery systems is expected to grow at a robust rate, with industry experts projecting a growth of around 10% per annum. A notable example of the market's potential can be seen in the successful implementation of a transdermal patch for the treatment of Parkinson's disease, which has resulted in a significant improvement in patient quality of life. The sedentary lifestyle and poor dietary habits contribute to the development of these disorders. The demand for transdermal drug delivery systems is on the rise as they provide a non-invasive, painless, and effective alternative to traditional methods.
What are the market trends shaping the Transdermal Drug Delivery Industry?
- Transdermal medicines are experiencing increasing demand in the market, representing an emerging trend. Transdermal patches represent a significant advancement in drug delivery technology. These patches, which are applied directly to the skin, deliver medication through a diffusion process, bypassing the gastrointestinal tract and releasing the drug into the bloodstream. The benefits of this technology are driving its adoption. Transdermal medicine is non-invasive and more convenient than intravenous or parenteral therapies.
- For instance, a notable example of its success is the use of transdermal fentanyl patches for pain management, which has revolutionized patient care by providing consistent, around-the-clock pain relief. Furthermore, it eliminates the need for oral medications, which can cause gastrointestinal toxicity and resulting side effects like vomiting and nausea. According to market research, the market is expected to expand by over 10% in the coming years, reflecting the growing preference for this technology.
What challenges does the Transdermal Drug Delivery Industry face during its growth?
- The prolonged process of securing government approvals for healthcare devices represents a significant challenge that impedes industry growth. This hurdle, which requires extensive regulatory compliance, adds time and resources to the product development cycle, ultimately impacting market competitiveness. The market is characterized by a lengthy and intricate regulatory approval process for healthcare devices and medicines. This complex procedure, which includes numerous stages and extensive documentation requirements, can take 3-4 years for companies to navigate before earning profits.
- For example, a leading pharmaceutical company successfully launched a new transdermal patch that increased sales by 15% within the first year due to its improved patient compliance and pain relief benefits. Regulatory bodies, such as the US Food and Drug Administration (FDA), play a crucial role in ensuring product safety and efficacy. According to a recent report, The market is projected to grow by over 6% annually in the coming years, driven by increasing demand for non-invasive drug delivery systems and advancements in technology.
Exclusive Customer Landscape
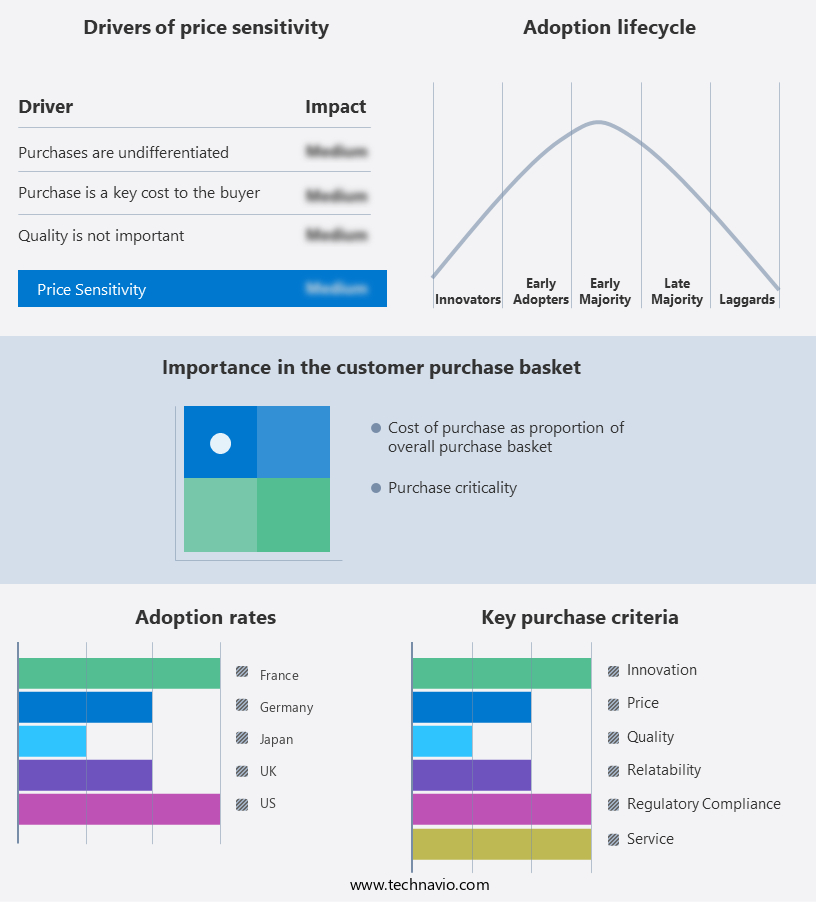
The transdermal drug delivery market forecasting report includes the adoption lifecycle of the market, covering from the innovator's stage to the laggard's stage. It focuses on adoption rates in different regions based on penetration. Furthermore, the transdermal drug delivery market report also includes key purchase criteria and drivers of price sensitivity to help companies evaluate and develop their market growth analysis strategies.
Customer Landscape
Key Companies & Market Insights
Companies are implementing various strategies, such as strategic alliances, transdermal drug delivery market forecast, partnerships, mergers and acquisitions, geographical expansion, and product/service launches, to enhance their presence in the industry.
3M Co. - The company specializes in advanced transdermal drug delivery systems, with a notable offering being 3M Scotchpak white.
The industry research and growth report includes detailed analyses of the competitive landscape of the market and information about key companies, including:
- 3M Co.
- Boehringer Ingelheim International GmbH
- Croda International Plc
- Hisamitsu Pharmaceutical Co. Inc.
- Johnson and Johnson Services Inc.
- Kindeva Drug Delivery L.P.
- Luye Pharma Group Ltd.
- Medherant Ltd.
- Novartis AG
- ProSolus Inc.
- Purdue Pharma LP
- Rusan Pharma Ltd.
- Sparsha Pharma International Pvt. Ltd.
- Teikoku Seiyaku Co. Ltd.
- UCB SA
- Viatris Inc.
Qualitative and quantitative analysis of companies has been conducted to help clients understand the wider business environment as well as the strengths and weaknesses of key industry players. Data is qualitatively analyzed to categorize companies as pure play, category-focused, industry-focused, and diversified; it is quantitatively analyzed to categorize companies as dominant, leading, strong, tentative, and weak.
Recent Development and News in Transdermal Drug Delivery Market
- In January 2024, Merck KGaA, a leading pharmaceutical company, announced the launch of its new transdermal patch, Sympathelan-T, for the treatment of essential tremor. This innovative patch uses Merck's proprietary Transdermal Delivery System, providing a non-invasive alternative to oral medications (Merck KGaA press release).
- In March 2024, Pfizer Inc. And 3M collaborated to develop advanced transdermal drug delivery systems, combining Pfizer's therapeutic expertise with 3M's adhesive technology. This partnership aims to improve patient compliance and expand their product offerings in the market (Pfizer Inc. Press release).
- In May 2024, AptarGroup, a global leader in dispensing, drug delivery, and active packaging solutions, completed the acquisition of CSP Technologies, a specialist in transdermal and topical drug delivery systems. This strategic move strengthens Aptar's position in the market and broadens its capabilities in the development and manufacturing of advanced drug delivery systems (AptarGroup press release).
- In February 2025, the U.S. Food and Drug Administration (FDA) approved the use of a novel transdermal patch, Exelon Patch, for the treatment of mild to moderate Alzheimer's disease. Developed by Noven Pharmaceuticals, the patch delivers the drug, rivastigmine, through the skin, offering a more convenient alternative to existing oral medications (FDA press release).
Research Analyst Overview
- The market continues to evolve, driven by advancements in therapeutic window definition, skin penetration modeling, and process validation methods. Receptor binding affinity and skin irritation potential are critical factors in bioavailability assessment, while dosage form design optimizes membrane transport processes. Clinical trial design focuses on percutaneous absorption and release rate kinetics, ensuring regulatory compliance and drug efficacy parameters. Quality control testing, drug deposition profile, and safety and tolerability are essential considerations. Industry growth is expected to reach 7.5% annually, with innovation in transdermal patch formulation, manufacturing process, and skin barrier integrity driving progress.
- For instance, a recent study demonstrated a 30% increase in drug absorption using a novel transdermal patch formulation. In silico modeling and dermal penetration rate optimization further enhance drug delivery, while shelf life determination, packaging considerations, and stability testing protocols ensure product integrity.
Dive into Technavio's robust research methodology, blending expert interviews, extensive data synthesis, and validated models for unparalleled Transdermal Drug Delivery Market insights. See full methodology.
|
Market Scope |
|
|
Report Coverage |
Details |
|
Page number |
228 |
|
Base year |
2024 |
|
Historic period |
2019-2023 |
|
Forecast period |
2025-2029 |
|
Growth momentum & CAGR |
Accelerate at a CAGR of 5.1% |
|
Market growth 2025-2029 |
USD 2.67 billion |
|
Market structure |
Fragmented |
|
YoY growth 2024-2025(%) |
4.6 |
|
Key countries |
US, Canada, Germany, UK, China, France, Mexico, Italy, India, and Japan |
|
Competitive landscape |
Leading Companies, Market Positioning of Companies, Competitive Strategies, and Industry Risks |
What are the Key Data Covered in this Transdermal Drug Delivery Market Research and Growth Report?
- CAGR of the Transdermal Drug Delivery industry during the forecast period
- Detailed information on factors that will drive the growth and forecasting between 2025 and 2029
- Precise estimation of the size of the market and its contribution of the industry in focus to the parent market
- Accurate predictions about upcoming growth and trends and changes in consumer behaviour
- Growth of the market across North America, Europe, Asia, and Rest of World (ROW)
- Thorough analysis of the market's competitive landscape and detailed information about companies
- Comprehensive analysis of factors that will challenge the transdermal drug delivery market growth of industry companies
We can help! Our analysts can customize this transdermal drug delivery market research report to meet your requirements.
 RIA -
RIA - 
