
Truck Axle Market Size 2025-2029
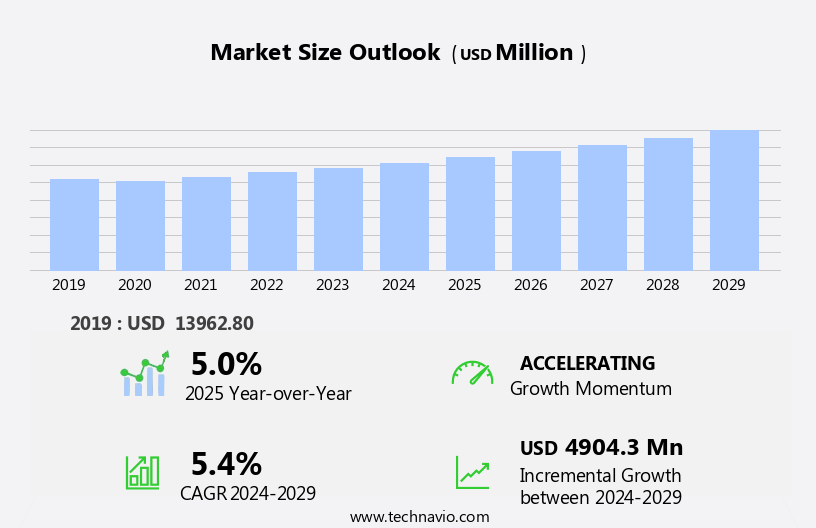
The truck axle market size is forecast to increase by USD 4.9 billion, at a CAGR of 5.4% between 2024 and 2029.
- The market is driven by the reduction in production costs of axles due to advances in manufacturing technology. This cost savings enables truck manufacturers to offer more competitive pricing, thereby increasing demand for medium and heavy-duty trucks. Simultaneously, the development of intelligent truck axles, integrating sensors and advanced materials, enhances vehicle performance and fuel efficiency. However, the high manufacturing cost of medium and heavy-duty trucks poses a significant challenge for market growth.
- To capitalize on opportunities, companies must focus on optimizing production processes and exploring cost-effective manufacturing methods. Additionally, investments in research and development of advanced, yet cost-competitive, axle technologies can differentiate offerings and cater to evolving customer needs.
What will be the Size of the Truck Axle Market during the forecast period?
Explore in-depth regional segment analysis with market size data - historical 2019-2023 and forecasts 2025-2029 - in the full report.
Request Free Sample
The market is a dynamic and evolving landscape, shaped by ongoing advancements in materials science and engineering. The continuous pursuit of improved tensile strength, yield strength, and fatigue strength drives innovation in steel alloys and composite materials. Quality control measures and distribution networks ensure the delivery of reliable axle components for various sectors, including heavy-duty vehicles, mining equipment, agricultural machinery, and off-highway vehicles. Autonomous vehicles and electric vehicles are reshaping the market, necessitating new axle designs for optimal payload capacity and efficiency. Suspension systems, braking systems, and steering geometry are undergoing significant developments to meet the unique demands of these emerging technologies.
The supply chain is adapting to these changes, with a focus on streamlining processes and optimizing logistics. Heat treatment, surface treatment, and testing procedures are essential elements in maintaining the high standards required for axle components. In the realm of off-highway vehicles, axle load and traction control are critical factors, while in the construction industry, safety standards and maintenance schedules are paramount. Aftermarket parts play a vital role in ensuring the longevity and performance of axle components. The ongoing evolution of the market is a testament to the industry's commitment to innovation and excellence. The integration of advanced materials, technologies, and manufacturing processes continues to push the boundaries of what is possible, ensuring that the market remains a dynamic and exciting space for growth and development.
How is this Truck Axle Industry segmented?
The truck axle industry research report provides comprehensive data (region-wise segment analysis), with forecasts and estimates in "USD million" for the period 2025-2029, as well as historical data from 2019-2023 for the following segments.
- Application
- Light-duty trucks
- Heavy-duty trucks
- Medium-duty trucks
- Type
- Rigid axles
- Drive steer axles
- Non-drive steer axles
- Technology
- Mechanical axles
- Electric axles
- Others
- End-user
- OEMs
- Aftermarket
- Geography
- North America
- US
- Canada
- Europe
- France
- Germany
- UK
- APAC
- Australia
- China
- India
- Japan
- South Korea
- Rest of World (ROW)
- North America
By Application Insights
The light-duty trucks segment is estimated to witness significant growth during the forecast period.
The pickup truck market in North America and Europe experiences significant growth due to the popularity of these vehicles, particularly in North America where they represent a substantial portion of regional automobile sales. Light-duty trucks, including light-duty pickup trucks, medium-duty pickup trucks, and super-duty pickup trucks, cater to diverse applications. Light-duty pickup trucks are predominantly used for personal purposes, while medium-duty and super-duty trucks are primarily employed for commercial applications. In the Americas, the US and Canada lead the pickup truck industry in terms of sales volume. Key players in the region's pickup truck market include Ford Motor, GM, and FCA.
Materials science and steel alloys play crucial roles in enhancing tire pressure, axle load, and payload capacity while ensuring safety standards and fuel efficiency. Quality control and testing procedures are essential to maintain the durability and reliability of axle shafts, wheel hubs, and suspension systems. Distribution networks are vital in ensuring the timely delivery of aftermarket parts, which are essential for maintenance schedules. Autonomous vehicles and electric vehicles are transforming the pickup truck market, with mining equipment and construction equipment adopting these technologies for increased productivity and reduced environmental impact. Composite materials and aluminum alloys, along with heat treatment and surface treatment, contribute to the development of lighter and stronger components, such as axle shafts and wheel hubs.
Traction control, steering geometry, and braking systems are essential features for heavy-duty vehicles, ensuring optimal performance and safety. Fuel efficiency, tire wear, and fatigue strength are critical factors in the pickup truck market, with tire alignment and wheel alignment essential for optimal tire performance and longevity. The supply chain's efficiency and the availability of universal joints and maintenance parts are vital for the industry's growth and sustainability. The integration of advanced technologies, such as yield strength testing and safety standards, ensures the continuous improvement of pickup trucks and their components.
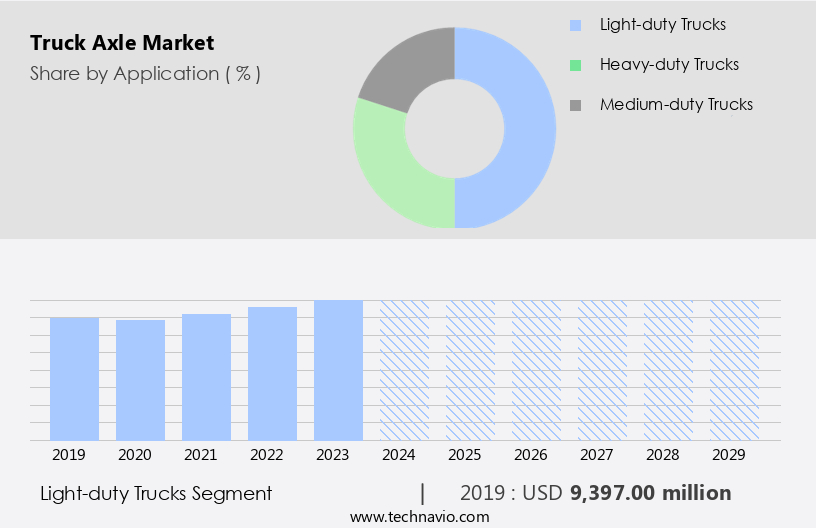
The Light-duty trucks segment was valued at USD 9.4 billion in 2019 and showed a gradual increase during the forecast period.
Regional Analysis
APAC is estimated to contribute 69% to the growth of the global market during the forecast period.Technavio’s analysts have elaborately explained the regional trends and drivers that shape the market during the forecast period.

The market in Asia-Pacific (APAC) experiences significant growth due to the increasing sales of commercial vehicles and associated parts in the region. Countries like China, Japan, South Korea, and India, with substantial commercial vehicle consumption, contribute to this expansion. Developed automotive industries, such as Japan, South Korea, and Australia, as prominent automotive export hubs in APAC, further fuel the market's growth. The region's rapid industrialization and the improving manufacturing and logistics sectors lead to the preference for improved land transport modes, boosting the demand for trucks and their components. Moreover, the emergence of new truck Original Equipment Manufacturers (OEMs) in APAC over the past few years strengthens the region's position in The market.
Materials science advancements, including steel alloys and composite materials, improve axle durability and load capacity. Quality control measures, heat treatment, and surface treatment ensure product reliability and safety. Autonomous vehicles, mining equipment, and off-highway vehicles' integration into the market broadens the application scope. Electric vehicles' increasing popularity drives the demand for lighter yet strong axle components, such as aluminum alloys. The market's supply chain benefits from advanced testing procedures, ensuring fatigue strength, wheel alignment, and tire wear. The braking system, suspension systems, payload capacity, and steering geometry are essential factors in heavy-duty vehicles' design. Maintenance schedules and aftermarket parts cater to the need for continuous operation and cost-effective solutions.
Safety standards and fuel efficiency concerns influence the market's trends. In conclusion, the APAC the market's growth is driven by the region's industrialization, increasing commercial vehicle sales, and the emergence of new truck OEMs. Materials science advancements, quality control measures, and the integration of new vehicle technologies shape the market's evolution.
Market Dynamics
Our researchers analyzed the data with 2024 as the base year, along with the key drivers, trends, and challenges. A holistic analysis of drivers will help companies refine their marketing strategies to gain a competitive advantage.
The market is a significant component of the global automotive industry, encompassing the design, manufacturing, and distribution of axles for heavy-duty vehicles. These essential parts support the vehicle's weight and facilitate smooth movement, ensuring optimal performance and safety. Truck axles undergo rigorous testing to meet industry standards for durability and load capacity. Key players in this market include manufacturers of commercial vehicles, aftermarket parts suppliers, and original equipment manufacturers (OEMs). Axle types include single reduction, double reduction, and tandem axles, each designed for specific applications. The market is driven by factors such as increasing freight transportation, infrastructure development, and government regulations. Innovations like electric and autonomous trucks are also shaping the future of the market.
What are the key market drivers leading to the rise in the adoption of Truck Axle Industry?
- The significant reduction in axle production costs, attributable to advancements in manufacturing technology, serves as the primary market driver.
- The market is driven by advancements in manufacturing technologies that enhance productivity and efficiency. One such innovation is the double-ended axle machine, which utilizes advanced rotary welding technology. This fully automated machine features a twin spindle, enabling the production of an entire axle in one cycle, thereby reducing cycle time by one-eighth. Moreover, the axle machine's precision orientation of approximately plus minus 1 degree ensures improved manufacturing accuracy. The implementation of these advanced manufacturing techniques contributes significantly to reducing production costs while maintaining superior design and quality. Another critical factor influencing the market is the focus on safety standards.
- The braking system and universal joints are essential components that undergo rigorous testing procedures to ensure safety and reliability. The use of high-yield strength materials in axle manufacturing further enhances safety and durability. Fuel efficiency is another essential factor in the trucking industry, and the demand for fuel-efficient axles is increasing. Aftermarket parts play a significant role in maintaining the optimal performance of trucks, and the availability of high-quality aftermarket parts is a crucial consideration for fleet operators. In conclusion, the market is characterized by continuous innovation and a focus on safety, efficiency, and cost-effectiveness. Manufacturing advancements, such as the double-ended axle machine, are transforming the industry by reducing cycle times, improving accuracy, and reducing production costs.
- Safety standards, fuel efficiency, and aftermarket parts continue to be essential factors influencing market growth.
What are the market trends shaping the Truck Axle Industry?
- Intelligent truck axle development is a significant market trend, gaining increasing attention in the transportation industry. This advanced technology enhances vehicle performance and efficiency by optimizing axle functionality and enabling real-time monitoring and adjustments.
- The market is driven by the increasing demand for improved fuel efficiency in heavy-duty vehicles. Daimler's new final drive technology is a prime example, allowing for oil regulation inside the unit, thereby enhancing fuel economy by up to 0.5%. This technology, integrated into the powertrain consisting of the engine, transmission, and axle, not only boosts fuel efficiency but also reduces maintenance costs, thereby decreasing the total cost of ownership.
- The new final drive axle's oil supply is contingent on the speed, torque, and temperature requirements. Furthermore, wheel alignment, steering geometry, traction control, tire wear, surface treatment, and aluminum alloys are essential considerations in the development of advanced truck axles to ensure optimal performance and durability.
What challenges does the Truck Axle Industry face during its growth?
- The escalating manufacturing costs for medium and heavy-duty trucks pose a significant challenge to the industry's growth trajectory.
- The market experiences significant demand from the medium and heavy-duty truck segment due to the prevalence of multi-axle trucks in this category. Advanced technologies integrated into heavy-duty trucks enhance their functionality but increase manufacturing costs. Consequently, the high price point of these trucks may deter sales, impacting the growth of the medium and heavy-duty truck segment. Manufacturing medium- and heavy-duty trucks involves intricate processes for components like braking systems, axles, suspension systems, and hauling and steering cylinders, necessitating a substantial capital investment.
- Moreover, the volatile prices of raw materials, such as stainless steel, hardened steel, cast iron, and metal alloys, pose challenges to market participants. Despite these hurdles, the market continues to evolve, driven by technological advancements and the increasing demand for efficient and durable transportation solutions.
Exclusive Customer Landscape
The truck axle market forecasting report includes the adoption lifecycle of the market, covering from the innovator’s stage to the laggard’s stage. It focuses on adoption rates in different regions based on penetration. Furthermore, the truck axle market report also includes key purchase criteria and drivers of price sensitivity to help companies evaluate and develop their market growth analysis strategies.
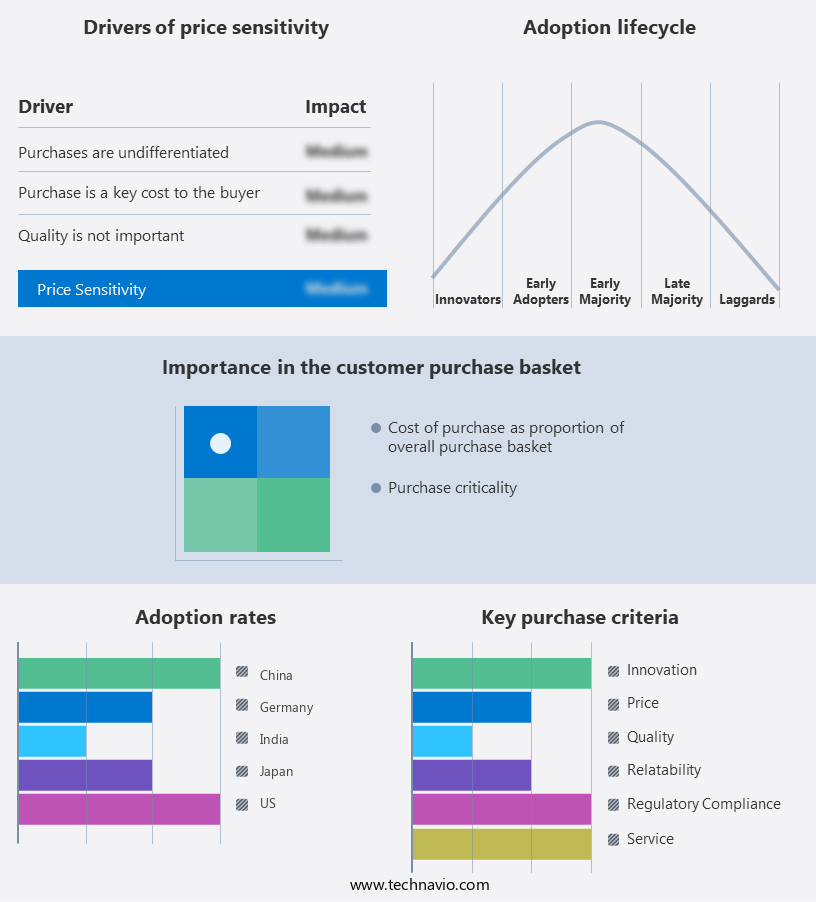
Customer Landscape
Key Companies & Market Insights
Companies are implementing various strategies, such as strategic alliances, truck axle market forecast, partnerships, mergers and acquisitions, geographical expansion, and product/service launches, to enhance their presence in the industry.
All Truck Parts Ltd. - This company specializes in manufacturing and supplying various truck axle types, including front and rear beam axles, enhancing vehicle performance and durability. Our product range caters to diverse industries, ensuring optimal transportation solutions. Axles are engineered for superior strength and reliability, boosting efficiency and reducing maintenance costs.
The industry research and growth report includes detailed analyses of the competitive landscape of the market and information about key companies, including:
- All Truck Parts Ltd.
- American Axle and Manufacturing Inc.
- Automotive Axles Ltd.
- AVL List GmbH
- BRIST Axle Systems Srl LLC
- Cummins Inc.
- Dana Inc.
- Hendrickson Holdings LLC
- Jost Werke AG
- Kross Ltd.
- Magna International Inc.
- Press Kogyo Co. Ltd.
- Qingte Group Co. Ltd.
- Raba Automotive Holding Plc
- SAF HOLLAND SE
- Shandong Heavy Industry Group Co. Ltd.
- Sinotruk Hong Kong Ltd.
- Sisu Axles Inc.
- Vikrant Group
- ZF Friedrichshafen AG
Qualitative and quantitative analysis of companies has been conducted to help clients understand the wider business environment as well as the strengths and weaknesses of key industry players. Data is qualitatively analyzed to categorize companies as pure play, category-focused, industry-focused, and diversified; it is quantitatively analyzed to categorize companies as dominant, leading, strong, tentative, and weak.
Recent Development and News in Truck Axle Market
- In January 2024, Meritor, Inc., a leading global supplier of commercial vehicle and industrial equipment, announced the launch of its new K3 axle series, featuring advanced technologies for improved fuel efficiency and durability (Meritor Press Release, 2024). In March 2024, Dana Incorporated, another major player in the market, entered into a strategic partnership with Volvo Group to supply axles for electric and autonomous heavy-duty trucks (Dana Press Release, 2024).
- In April 2024, American Axle & Manufacturing Holdings, Inc. Completed the acquisition of Powertrain Mfg. Co., expanding its product offerings and capabilities in the medium-duty the market (American Axle & Manufacturing Press Release, 2024). In May 2025, the European Union approved new emission standards for heavy-duty vehicles, driving demand for advanced truck axles with improved fuel efficiency and lower emissions (European Commission Press Release, 2025). These developments underscore the market's ongoing shift towards electric and autonomous vehicles, advanced technologies, and stricter emissions regulations.
Research Analyst Overview
- The market experiences dynamic growth, driven by advancements in material selection and design optimization. Brake pads, a critical component, undergo rigorous testing for thermal stability and emissions control. Manufacturers prioritize the use of high-performance materials for axle housings and steering linkages to enhance durability and creep resistance. Hydraulic suspension and air suspension systems ensure optimal weight distribution, reducing rolling resistance and improving fuel efficiency. Embracing computer-aided manufacturing (CAM) and computer-aided design (CAD) technologies, the industry focuses on product liability reduction and intellectual property protection. Exhaust systems and brake calipers are engineered for noise reduction and fatigue life improvement.
- Corrosion resistance is another essential factor, as axles are subjected to harsh operating conditions. Cost analysis and inventory control are crucial aspects of logistics management, with manufacturers adopting advanced techniques to optimize production and distribution. Shock absorbers and vibration dampening systems contribute to overall vehicle performance and comfort, while leaf springs maintain weight support and ensure proper weight distribution. In the competitive landscape, patent protection and design innovation play significant roles in differentiating offerings. Brake rotors and life cycle assessment are essential considerations in the total cost of ownership analysis. The market continues to evolve, with ongoing research and development in emissions control, weight reduction, and noise reduction technologies.
Dive into Technavio’s robust research methodology, blending expert interviews, extensive data synthesis, and validated models for unparalleled Truck Axle Market insights. See full methodology.
|
Market Scope |
|
|
Report Coverage |
Details |
|
Page number |
238 |
|
Base year |
2024 |
|
Historic period |
2019-2023 |
|
Forecast period |
2025-2029 |
|
Growth momentum & CAGR |
Accelerate at a CAGR of 5.4% |
|
Market growth 2025-2029 |
USD 4904.3 million |
|
Market structure |
Fragmented |
|
YoY growth 2024-2025(%) |
5.0 |
|
Key countries |
China, India, Japan, US, South Korea, Australia, Canada, Germany, UK, and France |
|
Competitive landscape |
Leading Companies, Market Positioning of Companies, Competitive Strategies, and Industry Risks |
What are the Key Data Covered in this Truck Axle Market Research and Growth Report?
- CAGR of the Truck Axle industry during the forecast period
- Detailed information on factors that will drive the growth and forecasting between 2025 and 2029
- Precise estimation of the size of the market and its contribution of the industry in focus to the parent market
- Accurate predictions about upcoming growth and trends and changes in consumer behaviour
- Growth of the market across APAC, North America, Europe, South America, and Middle East and Africa
- Thorough analysis of the market’s competitive landscape and detailed information about companies
- Comprehensive analysis of factors that will challenge the truck axle market growth of industry companies
We can help! Our analysts can customize this truck axle market research report to meet your requirements.
 RIA -
RIA - 
