
Trust And Corporate Service Market Size 2026-2030
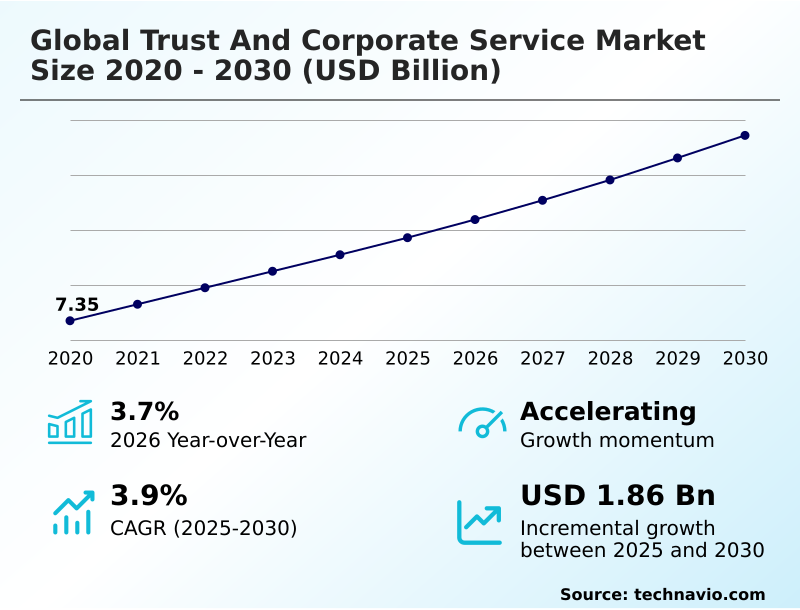
The trust and corporate service market size is valued to increase by USD 1.86 billion, at a CAGR of 3.9% from 2025 to 2030. Institutionalization of RegTech and automated compliance infrastructure will drive the trust and corporate service market.
Major Market Trends & Insights
- Europe dominated the market and accounted for a 37.9% growth during the forecast period.
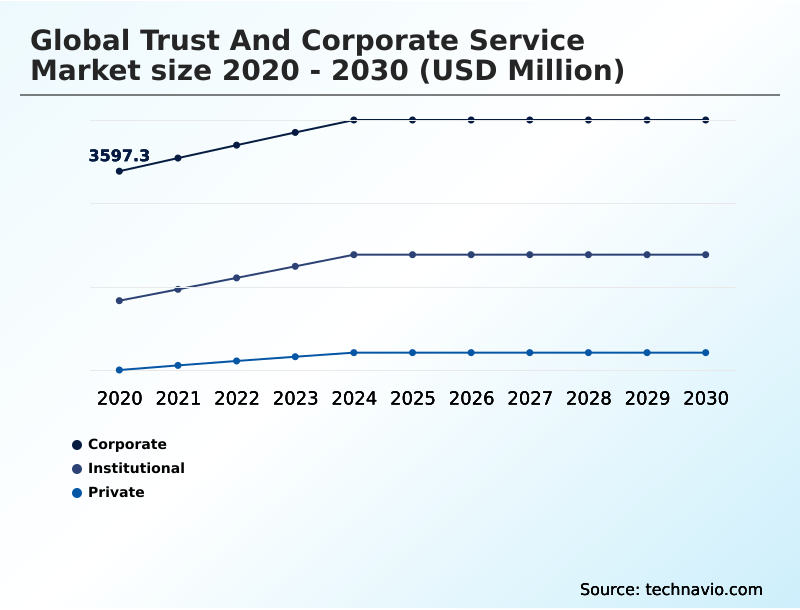
- By End-user - Corporate segment was valued at USD 4.13 billion in 2024
- By Application - Large enterprises segment accounted for the largest market revenue share in 2024
Market Size & Forecast
- Market Opportunities: USD 3.37 billion
- Market Future Opportunities: USD 1.86 billion
- CAGR from 2025 to 2030 : 3.9%
Market Summary
- The trust and corporate service market is undergoing a significant transformation, moving from traditional administrative support to a technologically advanced ecosystem. This evolution is driven by the escalating complexity of global regulations and the critical need for robust corporate governance frameworks.
- Service providers are now essential partners in navigating intricate compliance landscapes, utilizing regulatory technology for automated monitoring of beneficial ownership registers and ensuring tax transparency. A key business scenario involves a multinational corporation executing a cross-border acquisition.
- It relies on a service provider for due diligence automation, multi-jurisdictional compliance, and the swift setup of special purpose vehicles, ensuring the transaction adheres to diverse legal standards. This seamless integration of fiduciary services and digital platforms allows firms to manage corporate structuring and entity lifecycle management with greater efficiency and reduced risk.
- The adoption of sustainable finance principles and ESG advisory is also reshaping service offerings, aligning asset protection and estate planning with broader social impact goals, which is critical for private wealth management and institutional investors alike.
What will be the Size of the Trust And Corporate Service Market during the forecast period?
Get Key Insights on Market Forecast (PDF) Get Free Sample
How is the Trust And Corporate Service Market Segmented?
The trust and corporate service industry research report provides comprehensive data (region-wise segment analysis), with forecasts and estimates in "USD million" for the period 2026-2030, as well as historical data from 2020-2024 for the following segments.
- End-user
- Corporate
- Institutional
- Private
- Application
- Large enterprises
- Small and medium enterprises
- Type
- Outsourced services
- In-house services
- Consultancy
- Geography
- Europe
- UK
- Germany
- France
- North America
- US
- Canada
- Mexico
- APAC
- China
- India
- Japan
- South America
- Brazil
- Argentina
- Middle East and Africa
- UAE
- Saudi Arabia
- South Africa
- Rest of World (ROW)
- Europe
By End-user Insights
The corporate segment is estimated to witness significant growth during the forecast period.
Corporate end-users are central to the trust and corporate service market, leveraging specialized providers for seamless international operations and robust integrity in their organizational frameworks.
These entities depend on comprehensive entity lifecycle management, from incorporation to dissolution, to ensure every subsidiary meets local statutory rules, including minute book maintenance and annual filings.
The core objective is mitigating reputational and legal risk through consistent multi-jurisdictional compliance and robust corporate governance frameworks.
This reliance on external expertise is underscored by a clear trend toward consolidation, with a significant majority of new business coming from existing clients expanding partnerships for global entity management.
This move from fragmented, multi-vendor strategies to single-source providers for geopolitical risk mitigation and compliance-as-a-service streamlines oversight, enabling quicker responses to legal and tax changes in an era of heightened tradecraft and demands for post-quantum readiness.
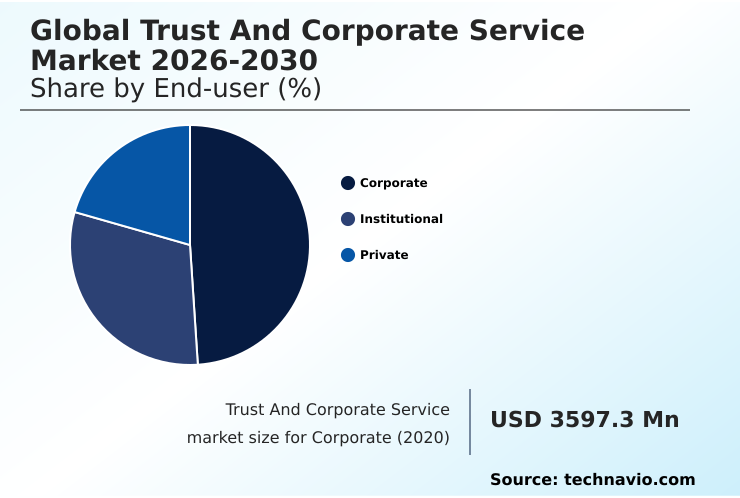
The Corporate segment was valued at USD 4.13 billion in 2024 and showed a gradual increase during the forecast period.
Regional Analysis
Europe is estimated to contribute 37.9% to the growth of the global market during the forecast period.Technavio’s analysts have elaborately explained the regional trends and drivers that shape the market during the forecast period.
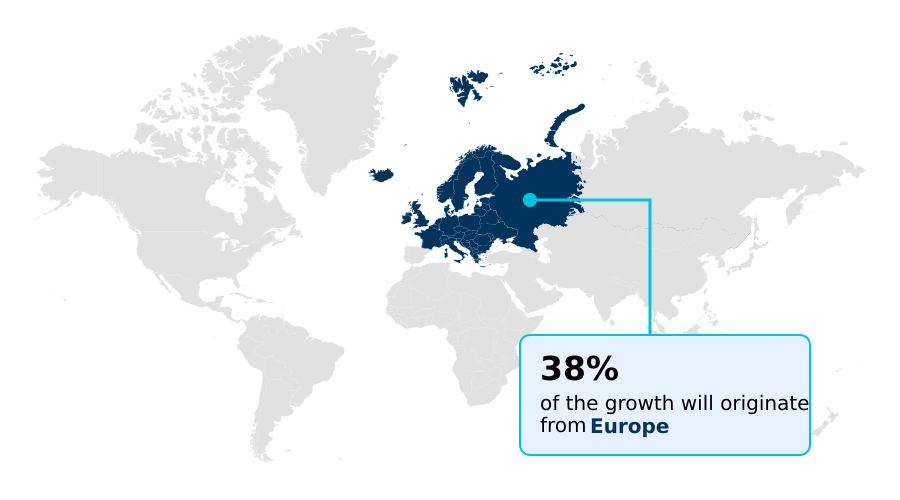
See How Trust And Corporate Service Market Demand is Rising in Europe Get Free Sample
The global geographic landscape is characterized by distinct regional growth dynamics. Europe leads with a 4.7% growth rate, driven by stringent regulatory frameworks that necessitate advanced compliance-as-a-service and digital audit trail solutions.
North America, with 4.0% growth, focuses on technological adoption, with firms implementing zero-trust architecture and post-quantum readiness to manage geopolitical risk and complex KYC protocols. The region’s mature market is a hub for business process outsourcing and remote administrative capabilities.
Meanwhile, the APAC region is expanding at 3.3%, fueled by supply chain compliance demands and the regionalization of multinational operations.
Across all regions, the need for data residency solutions is intensifying, pushing providers to offer localized expertise backed by global digital platforms, enhancing data integrity and client onboarding processes.
Market Dynamics
Our researchers analyzed the data with 2025 as the base year, along with the key drivers, trends, and challenges. A holistic analysis of drivers will help companies refine their marketing strategies to gain a competitive advantage.
- The trust and corporate service market is evolving to meet highly specific client needs, moving beyond generalized offerings. For instance, trust and corporate services for private equity now heavily involve SPV administration for alternative investments and sophisticated ESG reporting in fiduciary services to satisfy investor mandates.
- Simultaneously, managing compliance for multinational corporations requires navigating multi-jurisdictional compliance and intricate data residency requirements, often through compliance-as-a-service models. The threat of sophisticated fraud has pushed firms toward AI for AML risk screening, where automated systems are over 40% more effective at detecting anomalies than manual reviews.
- This technological shift is also evident in digital onboarding for corporate clients, which leverages digital identity verification processes to enhance security. High-net-worth individuals seek specialized private wealth management and succession planning, demanding tax transparency solutions for HNWIs. Furthermore, the rise of purpose-led corporate structures and sustainable finance has made ESG advisory a critical component.
- Fiduciary oversight for family offices now routinely includes navigating these complex non-financial factors. Automating corporate secretarial services and implementing zero-trust architecture in finance are no longer niche advantages but are becoming standard practice for mitigating risk in cross-border transactions and ensuring institutional-grade governance.
What are the key market drivers leading to the rise in the adoption of Trust And Corporate Service Industry?
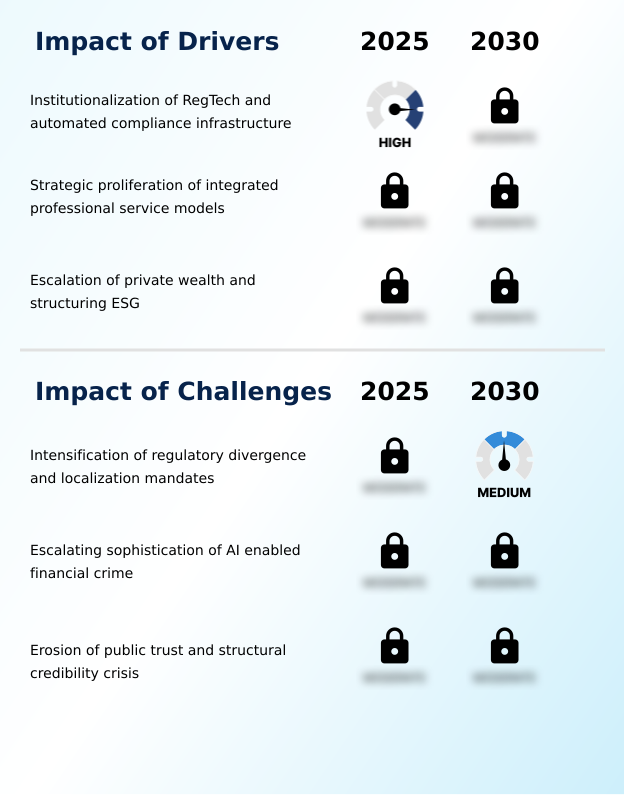
- The institutionalization of regulatory technology and the establishment of automated compliance infrastructures are primary drivers expanding the market.
- Key market drivers include the strategic proliferation of integrated service models and the institutionalization of regulatory technology.
- Clients, particularly institutional investors and those in private equity, are demanding end-to-end solutions that combine corporate secretarial services, ESG advisory, and fund administration under a single provider for simplified global entity management.
- The adoption of automated platforms for due diligence automation and client onboarding has been shown to reduce administrative errors by over 30%.
- Moreover, the construction of automated compliance infrastructures helps manage tax transparency and supports intergenerational wealth transfer and cross-border tax planning.
- This shift toward high-capacity, multi-disciplinary firms is professionalizing corporate governance, enabling providers to act as strategic partners in mergers and acquisitions and complex corporate turnarounds.
What are the market trends shaping the Trust And Corporate Service Industry?
- The industrialization of digital governance and the integration of regulatory technology are emerging as a transformative market trend, signaling a fundamental shift toward automated, data-driven compliance.
- The market is shaped by the industrialization of digital governance through pervasive RegTech adoption and the integration of ESG-aligned trust structures. Service providers are leveraging regulatory technology and automated compliance infrastructure to ensure real-time data integrity and transparency, which is critical for fiduciary services and corporate structuring. This trend addresses the demand for enhanced fiduciary oversight and entity lifecycle management.
- The evolution toward digital fiduciary services is evident as nearly half of all new trust structuring decisions are now influenced by ESG considerations, reflecting a significant shift in investor priorities. Furthermore, the use of AI in compliance monitoring is streamlining the management of beneficial ownership registers, making fund administration for alternative investment funds significantly more efficient.
- This convergence of technology and sustainability is defining the next generation of corporate services.
What challenges does the Trust And Corporate Service Industry face during its growth?
- The intensification of regulatory divergence and the proliferation of localization mandates present a primary challenge affecting industry growth and operational consistency.
- The market faces significant headwinds from escalating regulatory divergence and the rise of sophisticated, AI-enabled financial crime. The fragmentation of rules across jurisdictions creates localization mandates that complicate cross-border transaction support and demand specialized expertise in constantly changing KYC protocols and the common reporting standard. This environment challenges the efficiency of SPV administration and private wealth management.
- Simultaneously, cybercriminals are weaponizing AI to bypass traditional digital identity verification, making tradecraft more advanced. This threat necessitates investment in a zero-trust architecture and enhanced cybersecurity frameworks, yet public trust in global institutions has fallen to near-zero in some studies, compounding the pressure on firms to prove their commitment to data integrity and ethical non-financial reporting.
Exclusive Technavio Analysis on Customer Landscape
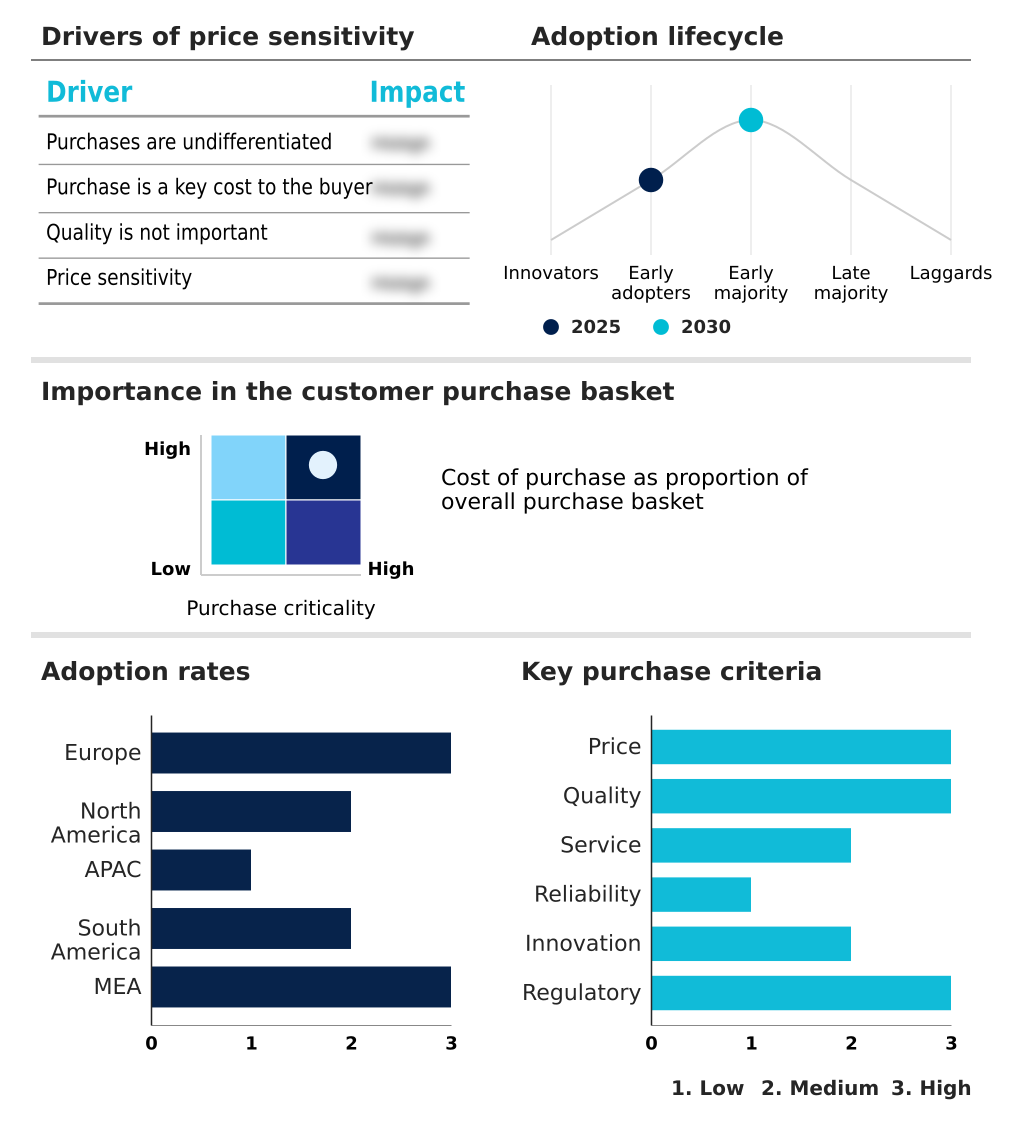
The trust and corporate service market forecasting report includes the adoption lifecycle of the market, covering from the innovator’s stage to the laggard’s stage. It focuses on adoption rates in different regions based on penetration. Furthermore, the trust and corporate service market report also includes key purchase criteria and drivers of price sensitivity to help companies evaluate and develop their market growth analysis strategies.
Customer Landscape of Trust And Corporate Service Industry
Competitive Landscape
Companies are implementing various strategies, such as strategic alliances, trust and corporate service market forecast, partnerships, mergers and acquisitions, geographical expansion, and product/service launches, to enhance their presence in the industry.
Alter Domus Luxembourg S.a r.l. - Delivering entity management, business process outsourcing, and international tax planning, this provider offers integrated solutions for multinational corporations and private clients.
The industry research and growth report includes detailed analyses of the competitive landscape of the market and information about key companies, including:
- Alter Domus Luxembourg S.a r.l.
- Amicorp Group
- Apex Group Ltd.
- Asiaciti Trust
- Bolder Group
- Computershare Ltd.
- Equiom Group
- Hawksford
- IQ EQ Group Holdings S.a r.l
- JTC PLC
- Maples Group
- Northern Trust Corp.
- Ocorian Ltd.
- Sovereign Group
- The Citco Group Ltd.
- The Corporation Service Co.
- TMF Group BV
- Trident Trust Group
- Vistra Group Holdings S.A.
- ZEDRA
Qualitative and quantitative analysis of companies has been conducted to help clients understand the wider business environment as well as the strengths and weaknesses of key industry players. Data is qualitatively analyzed to categorize companies as pure play, category-focused, industry-focused, and diversified; it is quantitatively analyzed to categorize companies as dominant, leading, strong, tentative, and weak.
Recent Development and News in Trust and corporate service market
- In April 2025, The European Union introduced updated corporate governance guidelines under its Anti-Money Laundering Directive, requiring enhanced disclosure of beneficial ownership and reinforcing the role of service providers in ensuring compliance.
- In March 2025, Apex Group announced it joined the BlackRock Aladdin Provider network to launch a private credit outsourcing solution, enabling smaller investment managers to access high-tier operational infrastructure.
- In February 2025, Alter Domus was selected by Bain Capital Credit to provide comprehensive middle and back-office solutions for its global credit portfolios, integrating operations into a single administrative model.
- In January 2025, Apex Fintech Solutions launched its AI Suite, featuring an Agentic Development Kit designed to empower business leaders to build and test financial infrastructure using natural language commands.
Dive into Technavio’s robust research methodology, blending expert interviews, extensive data synthesis, and validated models for unparalleled Trust And Corporate Service Market insights. See full methodology.
| Market Scope | |
|---|---|
| Page number | 289 |
| Base year | 2025 |
| Historic period | 2020-2024 |
| Forecast period | 2026-2030 |
| Growth momentum & CAGR | Accelerate at a CAGR of 3.9% |
| Market growth 2026-2030 | USD 1859.0 million |
| Market structure | Fragmented |
| YoY growth 2025-2026(%) | 3.7% |
| Key countries | UK, Germany, France, The Netherlands, Italy, Spain, US, Canada, Mexico, China, India, Japan, South Korea, Australia, Indonesia, Brazil, Argentina, Chile, UAE, Saudi Arabia, South Africa, Israel and Turkey |
| Competitive landscape | Leading Companies, Market Positioning of Companies, Competitive Strategies, and Industry Risks |
Research Analyst Overview
- The trust and corporate service market is in a state of continuous evolution, driven by the dual pressures of regulatory technology and the need for greater tax transparency. The industry has moved decisively beyond manual processing, with providers now competing on the strength of their digital platforms and their ability to deliver real-time compliance monitoring and fiduciary oversight.
- Boardroom-level strategy is now intrinsically linked to the selection of corporate service partners, as the ability to navigate multi-jurisdictional compliance directly impacts a firm's risk profile and operational agility. The adoption of cloud-based platforms for fund administration and corporate structuring has surpassed 64%, signaling a definitive shift toward digital-first service models.
- Providers are leveraging due diligence automation, digital identity verification, and advanced KYC protocols to streamline client onboarding while enhancing security. This tech-centric approach is critical for managing beneficial ownership registers and supporting complex cross-border transaction support, making ESG advisory and sustainable finance principles integral to modern private wealth management and corporate governance frameworks.
What are the Key Data Covered in this Trust And Corporate Service Market Research and Growth Report?
-
What is the expected growth of the Trust And Corporate Service Market between 2026 and 2030?
-
USD 1.86 billion, at a CAGR of 3.9%
-
-
What segmentation does the market report cover?
-
The report is segmented by End-user (Corporate, Institutional, and Private), Application (Large enterprises, and Small and medium enterprises), Type (Outsourced services, In-house services, and Consultancy) and Geography (Europe, North America, APAC, South America, Middle East and Africa)
-
-
Which regions are analyzed in the report?
-
Europe, North America, APAC, South America and Middle East and Africa
-
-
What are the key growth drivers and market challenges?
-
Institutionalization of RegTech and automated compliance infrastructure, Intensification of regulatory divergence and localization mandates
-
-
Who are the major players in the Trust And Corporate Service Market?
-
Alter Domus Luxembourg S.a r.l., Amicorp Group, Apex Group Ltd., Asiaciti Trust, Bolder Group, Computershare Ltd., Equiom Group, Hawksford, IQ EQ Group Holdings S.a r.l, JTC PLC, Maples Group, Northern Trust Corp., Ocorian Ltd., Sovereign Group, The Citco Group Ltd., The Corporation Service Co., TMF Group BV, Trident Trust Group, Vistra Group Holdings S.A. and ZEDRA
-
Market Research Insights
- Market dynamics are increasingly shaped by the adoption of automated compliance infrastructure and sophisticated data-centric service models. This shift is fueling demand for integrated service models that provide end-to-end solutions for global entity management and regulatory reporting. The implementation of digital fiduciary services has proven to reduce human error by nearly one-third, enhancing accuracy in complex administrative tasks.
- Furthermore, the adoption of cloud-based platforms for alternative investment funds administration has reached 64%, reflecting a profound industry transition toward tech-first operational frameworks. These advancements enable family office services and institutional investors to achieve greater efficiency in cross-border tax planning and geopolitical risk mitigation, solidifying the move toward more resilient and transparent corporate governance.
We can help! Our analysts can customize this trust and corporate service market research report to meet your requirements.
 RIA -
RIA - 
