
Ultra HD Television (UHD TV) Market Size 2025-2029
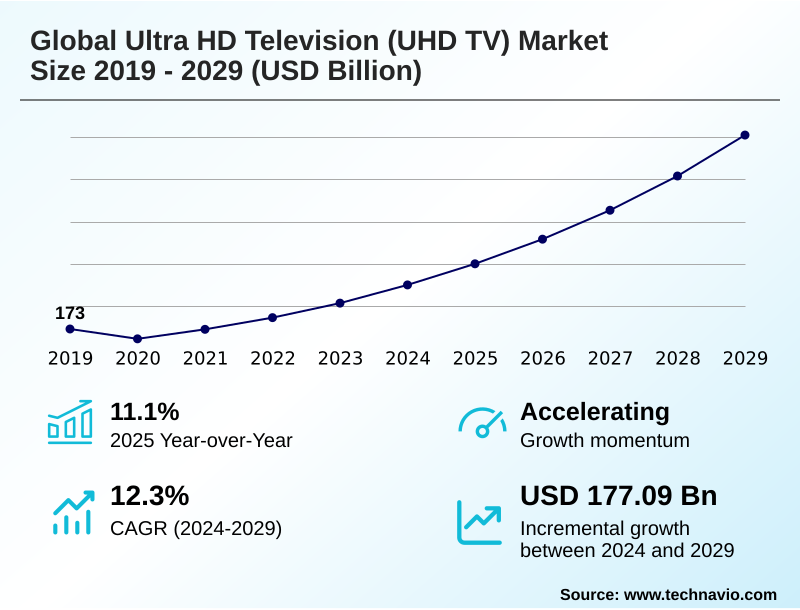
The ultra hd television (uhd tv) market size is valued to increase by USD 177.09 billion, at a CAGR of 12.3% from 2024 to 2029. Demand for UHD TVs will drive the ultra hd television (uhd tv) market.
Major Market Trends & Insights
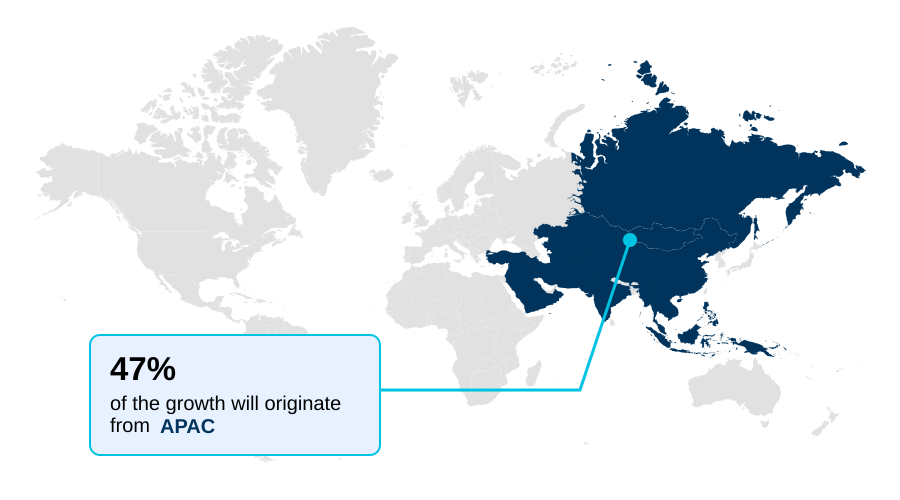
- APAC dominated the market and accounted for a 46.7% growth during the forecast period.
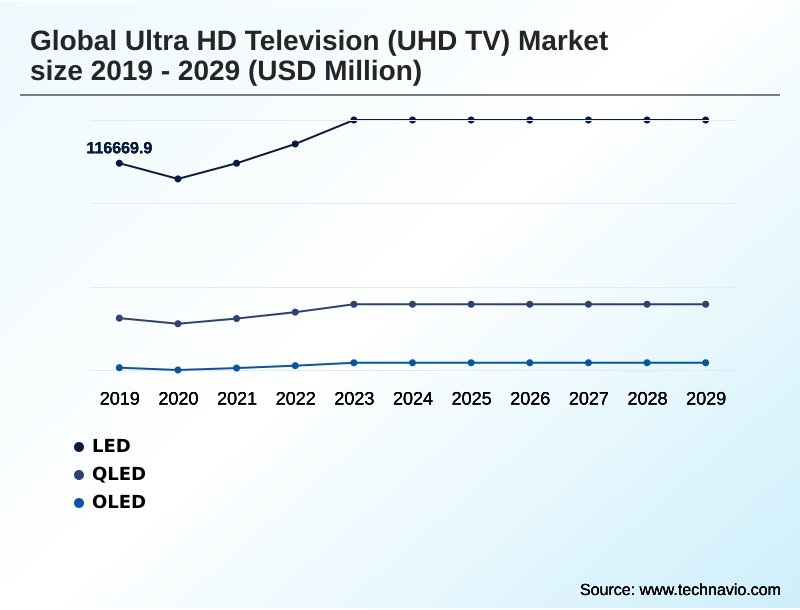
- By Display Type - LED segment was valued at USD 137.97 billion in 2023
- By Screen Size - 50-59 inches segment accounted for the largest market revenue share in 2023
Market Size & Forecast
- Market Opportunities: USD 229.20 billion
- Market Future Opportunities: USD 177.09 billion
- CAGR from 2024 to 2029 : 12.3%
Market Summary
- The Ultra HD Television (UHD TV) market is defined by a rapid technological replacement cycle, pushing beyond standard 4K resolution toward the adoption of 8K resolution. This evolution is propelled by consumer demand for an immersive viewing experience, particularly for home cinema setups and next-generation gaming console compatibility.
- Key display technologies such as OLED technology and QLED technology are at the forefront, offering significant enhancements in picture quality enhancement. The integration of smart TV platforms and sophisticated image processing engines has become standard, enabling seamless streaming service integration and access to a growing library of over-the-top (OTT) content.
- A significant operational consideration for content producers involves strategic investment in their content delivery network (CDN) infrastructure. For example, a major streaming service must balance the high cost of delivering 8K streams against the current household penetration of 8K-capable displays, a decision that directly influences capital expenditure and market positioning.
- This dynamic is further complicated by the variable performance of AI upscaling in bridging the content gap and the ongoing competition in panel manufacturing.
What will be the Size of the Ultra HD Television (UHD TV) Market during the forecast period?
Get Key Insights on Market Forecast (PDF) Get Free Sample
How is the Ultra HD Television (UHD TV) Market Segmented?
The ultra hd television (uhd tv) industry research report provides comprehensive data (region-wise segment analysis), with forecasts and estimates in "USD million" for the period 2025-2029, as well as historical data from 2019-2023 for the following segments.
- Display type
- LED
- QLED
- OLED
- Screen size
- 50-59 inches
- 60-69 inches
- 40-49 inches
- 70 inches and above
- Type
- 4K
- 8K
- Geography
- APAC
- China
- India
- Japan
- North America
- US
- Canada
- Mexico
- Europe
- Germany
- UK
- France
- Middle East and Africa
- Saudi Arabia
- UAE
- South Africa
- South America
- Brazil
- Argentina
- Rest of World (ROW)
- APAC
By Display Type Insights
The led segment is estimated to witness significant growth during the forecast period.
The Ultra HD Television (UHD TV) market segmentation is critically influenced by display type, where foundational LED technology continues to command a significant share due to its cost-effectiveness in panel manufacturing. This affordability drives mass-market adoption, particularly in price-sensitive segments.
While newer QLED and OLED technologies offer superior contrast ratio and color gamut, LED-based sets provide a crucial entry point for consumers.
The evolution of LED backlight technology, including advancements in local dimming, remains a key area of innovation for enhancing picture quality.
However, the operational characteristics of this segment present challenges; for instance, 4K LED models consume approximately 30% more energy than their HD counterparts, a factor impacting energy consumption standards and consumer choice in a market increasingly defined by display driver IC performance.
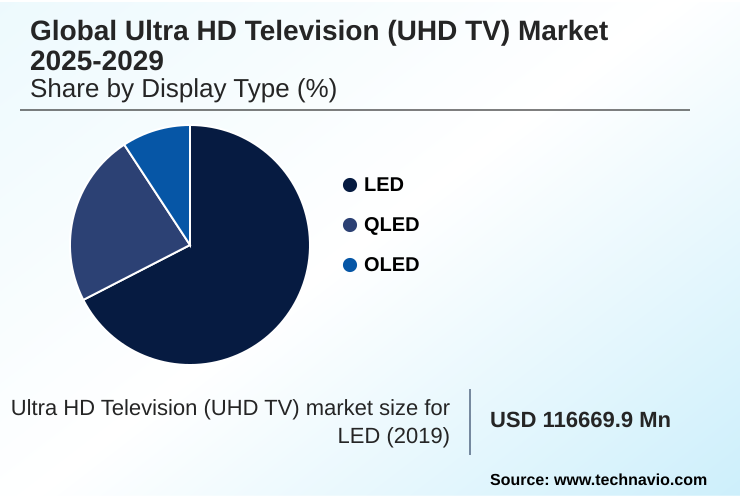
The LED segment was valued at USD 137.97 billion in 2023 and showed a gradual increase during the forecast period.
Regional Analysis
APAC is estimated to contribute 46.7% to the growth of the global market during the forecast period.Technavio’s analysts have elaborately explained the regional trends and drivers that shape the market during the forecast period.
See How Ultra HD Television (UHD TV) Market Demand is Rising in APAC Get Free Sample
The geographic landscape of the Ultra HD Television (UHD TV) market is dominated by the APAC region, which functions as both the primary manufacturing hub and the largest growth market, projected to account for nearly 47% of the incremental growth.
This concentration heavily influences the global display panel supply chain and contributes to a competitive average selling price (ASP), especially for models utilizing established backlight technology.
North America, representing the second-largest market with a nearly 30% growth contribution, is characterized by a mature replacement cycle where consumers prioritize premium features like advanced picture quality enhancement and smart home ecosystem integration.
Europe follows, driven by a similar demand for high-end specifications and brand equity. In these developed regions, the focus is less on initial adoption and more on upgrading to technologies that offer a superior immersive viewing experience.
Market Dynamics
Our researchers analyzed the data with 2024 as the base year, along with the key drivers, trends, and challenges. A holistic analysis of drivers will help companies refine their marketing strategies to gain a competitive advantage.
- Consumer decisions in the Ultra HD Television (UHD TV) market are increasingly nuanced, weighing factors like OLED vs QLED picture quality and identifying the best 4K TV for gaming, which requires low latency and high refresh rates.
- However, significant adoption hurdles remain, including persistent 8K content availability challenges and latency issues in cloud gaming on smart TVs that can disrupt the user experience. The industry is also navigating complex technical and supply-side dynamics. The future of MicroLED display technology promises unparalleled performance but faces obstacles related to the high cost of large screen panel manufacturing.
- On the supply side, managing the supply chain for QD-OLED panels is operationally more complex, with logistical overheads nearly 45% higher than for conventional LCDs, impacting production timelines and costs. From a content perspective, implementing standards like Dolby Vision vs HDR10+ and ensuring the readiness of the content delivery network (CDN) are critical.
- Technical advancements in areas like the audio return channel (eARC) and comparing TV processors for motion handling are key differentiators. Furthermore, the benefits of high refresh rates for sports are a major selling point, even as broadcasters grapple with the challenges of broadcasting 8K content.
- The effectiveness of AI-powered image upscaling performance and the impact of local dimming on contrast continue to be vital for delivering a premium viewing experience, especially for professional video editing and integration with smart home automation.
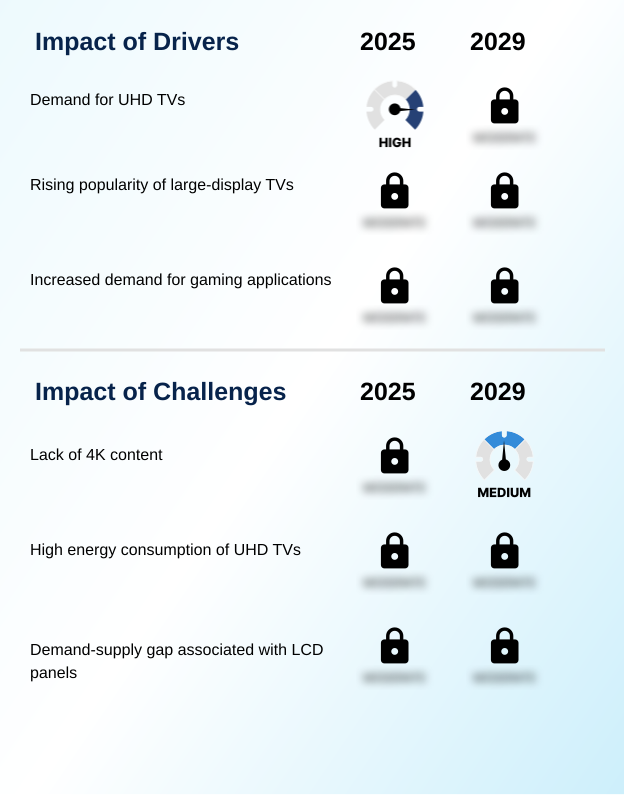
What are the key market drivers leading to the rise in the adoption of Ultra HD Television (UHD TV) Industry?
- The increasing demand for UHD TVs, driven by their superior picture quality and immersive viewing experience, serves as a primary driver for market growth.
- Market growth is significantly fueled by the demand for a more immersive viewing experience, a key factor in the ongoing consumer electronics market replacement cycle.
- This demand is amplified by the proliferation of over-the-top (OTT) content, which provides a steady stream of high-quality media optimized for advanced displays.
- Furthermore, enhanced gaming console compatibility has become a powerful driver, with modern consoles leveraging high refresh rates and resolutions to deliver superior performance.
- These drivers are underpinned by the competitive landscape of OEM manufacturing, which pushes for innovation while managing price sensitivity.
- The result is a positive feedback loop where compelling content and powerful hardware mutually reinforce adoption, with some high-end gaming displays now achieving input lag reductions of over 50% compared to previous generations.
What are the market trends shaping the Ultra HD Television (UHD TV) Industry?
- A key market trend is the advent of 8K UHD TVs, which are gaining popularity due to the increasing demand for high-resolution displays and enhanced content creation.
- Key trends are reshaping the Ultra HD Television (UHD TV) market, driven by innovations that enhance the home cinema setup. The industry is moving beyond 4K resolution, with the advent of 8K resolution display technology promising unparalleled detail, offering four times the pixel density of its predecessor.
- This shift is supported by continuous advancements in the image processing engine and more sophisticated AI upscaling algorithms. Concurrently, the smart TV platform is evolving, with deeper streaming service integration and more intuitive voice control integration becoming standard.
- These developments in broadcast standards and set-top box (STB) compatibility are critical for delivering a seamless user experience, making the television the central hub of the modern smart home ecosystem.
What challenges does the Ultra HD Television (UHD TV) Industry face during its growth?
- A significant challenge affecting industry growth is the persistent lack of native 4K content, which limits the full utilization of UHD TV capabilities.
- The market faces persistent challenges that could temper its growth trajectory, primarily stemming from supply-side and content-related issues. The global display panel supply chain remains vulnerable to disruptions, which can impact panel manufacturing and create volatility in the average selling price (ASP). This directly affects brand equity and profitability.
- Another significant hurdle is the higher energy consumption of next-generation displays, with some advanced panels using up to 35% more power, creating pressure to meet stringent energy consumption standards without compromising on picture quality enhancement.
- Furthermore, the readiness of the existing content delivery network (CDN) infrastructure to support widespread 8K streaming remains a major question, creating a gap between hardware capabilities and content accessibility.
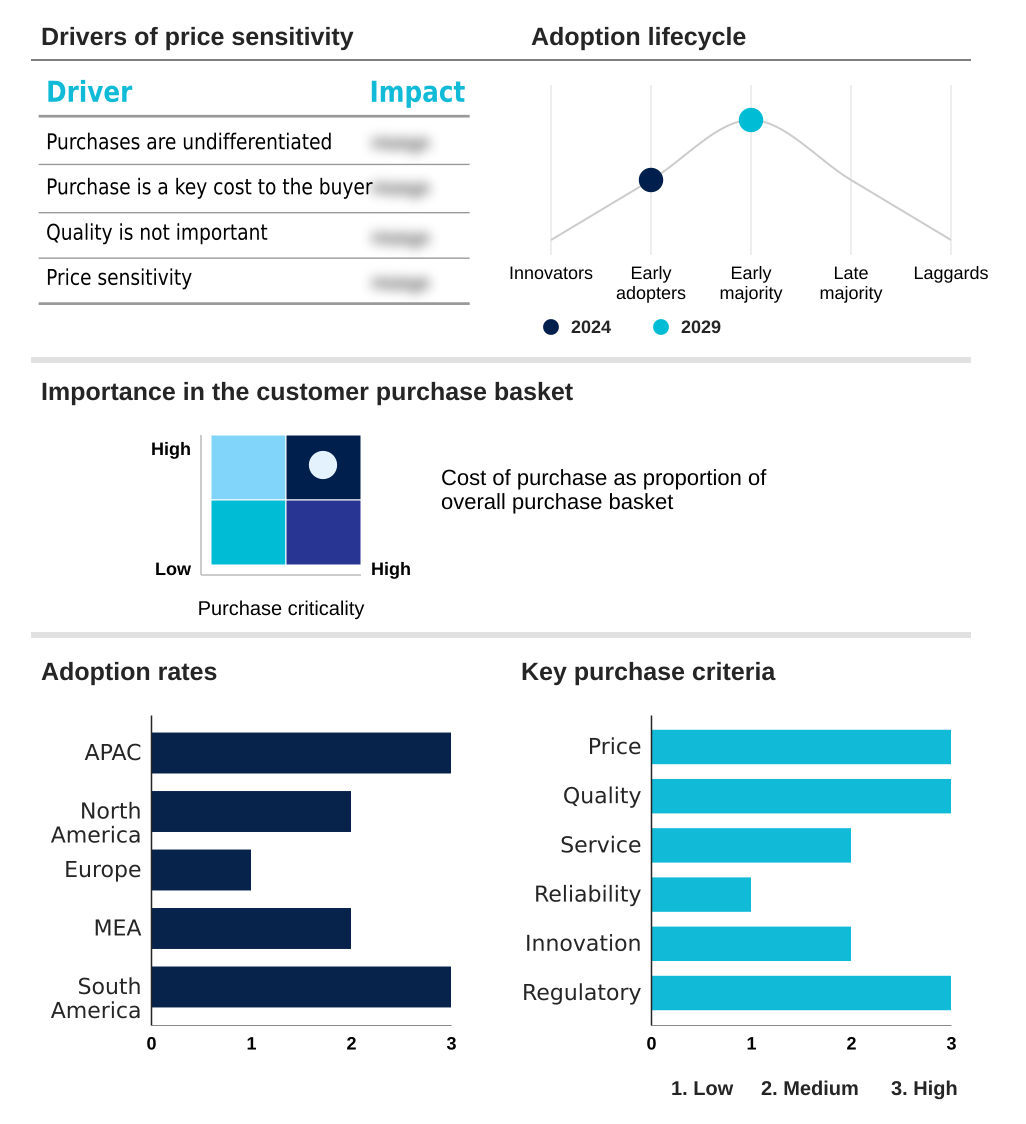
Exclusive Technavio Analysis on Customer Landscape
The ultra hd television (uhd tv) market forecasting report includes the adoption lifecycle of the market, covering from the innovator’s stage to the laggard’s stage. It focuses on adoption rates in different regions based on penetration. Furthermore, the ultra hd television (uhd tv) market report also includes key purchase criteria and drivers of price sensitivity to help companies evaluate and develop their market growth analysis strategies.
Customer Landscape of Ultra HD Television (UHD TV) Industry
Competitive Landscape
Companies are implementing various strategies, such as strategic alliances, ultra hd television (uhd tv) market forecast, partnerships, mergers and acquisitions, geographical expansion, and product/service launches, to enhance their presence in the industry.
Apple Inc. - Key offerings include a diverse portfolio of UHD TVs, leveraging advanced display panel products and integrated systems for both consumer and enterprise digital experiences.
The industry research and growth report includes detailed analyses of the competitive landscape of the market and information about key companies, including:
- Apple Inc.
- Dynavision Ltd.
- Haier Smart Home Co. Ltd.
- Hisense International Co. Ltd.
- Intex Technologies India Ltd.
- Koninklijke Philips NV
- LG Corp.
- Micromax Informatics Ltd.
- MIRC Electronics Ltd.
- Panasonic Holdings Corp.
- Samsung Electronics Co. Ltd.
- Sharp Corp.
- Sony Group Corp.
- TCL Industries Holdings Ltd.
- Toshiba Corp.
- VIZIO Holding Corp.
- Vu Televisions
- Xiaomi Inc.
Qualitative and quantitative analysis of companies has been conducted to help clients understand the wider business environment as well as the strengths and weaknesses of key industry players. Data is qualitatively analyzed to categorize companies as pure play, category-focused, industry-focused, and diversified; it is quantitatively analyzed to categorize companies as dominant, leading, strong, tentative, and weak.
Recent Development and News in Ultra hd television (uhd tv) market
- In January 2025, Sony Group Corp. is expected to launch its next-generation BRAVIA series, featuring a proprietary QD-OLED panel with enhanced AI upscaling capabilities for 8K resolution, targeting the premium home cinema market.
- In November 2024, Samsung Electronics Co. Ltd. announced a strategic partnership with a major cloud gaming provider to integrate a native gaming hub into its 2025 Tizen OS, offering seamless access to AAA titles without a console.
- In March 2025, LG Corp. confirmed a significant investment to expand its Gen 10.5 OLED panel production line, aiming to increase the availability of large-screen OLED TVs and reduce manufacturing costs by over 15%.
- In September 2024, a consortium of major Hollywood studios and streaming platforms, including Netflix and Apple Inc., announced a new standard for 8K content production and distribution, committing to release over 50 native 8K titles by the end of 2025.
Dive into Technavio’s robust research methodology, blending expert interviews, extensive data synthesis, and validated models for unparalleled Ultra HD Television (UHD TV) Market insights. See full methodology.
| Market Scope | |
|---|---|
| Page number | 298 |
| Base year | 2024 |
| Historic period | 2019-2023 |
| Forecast period | 2025-2029 |
| Growth momentum & CAGR | Accelerate at a CAGR of 12.3% |
| Market growth 2025-2029 | USD 177091.5 million |
| Market structure | Fragmented |
| YoY growth 2024-2025(%) | 11.1% |
| Key countries | China, India, Japan, South Korea, Indonesia, Australia, US, Canada, Mexico, Germany, UK, France, Italy, Spain, The Netherlands, Saudi Arabia, UAE, South Africa, Egypt, Nigeria, Brazil, Argentina and Chile |
| Competitive landscape | Leading Companies, Market Positioning of Companies, Competitive Strategies, and Industry Risks |
Research Analyst Overview
- The Ultra HD Television (UHD TV) market is characterized by rapid innovation in core hardware, fundamentally altering the consumer electronics market. At the component level, advancements in panel manufacturing and the development of sophisticated display driver ICs are enabling superior performance across different display technologies, from established LED to emerging MicroLED.
- The distinction between OLED technology and QLED technology is becoming more refined, with quantum dot filters enhancing the color gamut of the latter. Key performance metrics such as contrast ratio, viewing angle, and refresh rate are central to product differentiation.
- A critical development is the role of the image processing engine, where AI upscaling has improved perceived sharpness on non-native content by over 30%. This addresses the content gap as the industry transitions from 4K resolution to 8K resolution.
- For boardroom strategy, the evolution of High Dynamic Range (HDR) standards, including Dolby Vision and HDR10+, directly impacts content licensing agreements and platform exclusivity for streaming services.
- Furthermore, connectivity standards like HDMI 2.1 and eARC (Enhanced Audio Return Channel) are now essential for enabling features like high-frame-rate gaming, while the smart TV platform with voice control integration has become a crucial part of the user experience.
What are the Key Data Covered in this Ultra HD Television (UHD TV) Market Research and Growth Report?
-
What is the expected growth of the Ultra HD Television (UHD TV) Market between 2025 and 2029?
-
USD 177.09 billion, at a CAGR of 12.3%
-
-
What segmentation does the market report cover?
-
The report is segmented by Display Type (LED, QLED, and OLED), Screen Size (50-59 inches, 60-69 inches, 40-49 inches, and 70 inches and above), Type (4K and 8K) and Geography (APAC, North America, Europe, Middle East and Africa, South America)
-
-
Which regions are analyzed in the report?
-
APAC, North America, Europe, Middle East and Africa and South America
-
-
What are the key growth drivers and market challenges?
-
Demand for UHD TVs, Lack of 4K content
-
-
Who are the major players in the Ultra HD Television (UHD TV) Market?
-
Apple Inc., Dynavision Ltd., Haier Smart Home Co. Ltd., Hisense International Co. Ltd., Intex Technologies India Ltd., Koninklijke Philips NV, LG Corp., Micromax Informatics Ltd., MIRC Electronics Ltd., Panasonic Holdings Corp., Samsung Electronics Co. Ltd., Sharp Corp., Sony Group Corp., TCL Industries Holdings Ltd., Toshiba Corp., VIZIO Holding Corp., Vu Televisions and Xiaomi Inc.
-
Market Research Insights
- Market dynamics are shaped by intense competition in OEM manufacturing and a strategic focus on brand equity. The consumer preference for an immersive viewing experience is a primary catalyst, driving the average TV size toward 50 inches in key markets and fueling the replacement cycle. This trend is supported by robust gaming console compatibility and deep streaming service integration.
- From a regional perspective, APAC is set to contribute approximately 47% of the market's growth, underscoring its pivotal role in the display panel supply chain. However, this growth is moderated by technical factors, as newer 4K models demonstrate up to 30% higher energy consumption compared to older HD sets, influencing both product design and regulatory compliance concerning energy consumption standards.
We can help! Our analysts can customize this ultra hd television (uhd tv) market research report to meet your requirements.
 RIA -
RIA - 
