Underground Gas Storage Market Analysis, Size, and Forecast 2026-2030: Europe (Germany, Italy, and The Netherlands), North America (US, Canada, and Mexico), APAC (China, Australia, and Japan), Middle East and Africa (Turkey, Saudi Arabia, and UAE), South America (Argentina and Brazil), and Rest of World (ROW)

Underground Gas Storage Market Analysis, Size, and Forecast 2026-2030:
Europe (Germany, Italy, and The Netherlands), North America (US, Canada, and Mexico), APAC (China, Australia, and Japan), Middle East and Africa (Turkey, Saudi Arabia, and UAE), South America (Argentina and Brazil), and Rest of World (ROW)

Published: May 2026 301 Pages SKU: IRTNTR71858

Market Overview at a Glance

$11.45 B
Market Opportunity
5.4%
CAGR 2025 - 2030
38.2%
Europe Growth
$27.99 B
Depleted fields segment 2024

Underground Gas Storage Market Size 2026-2030

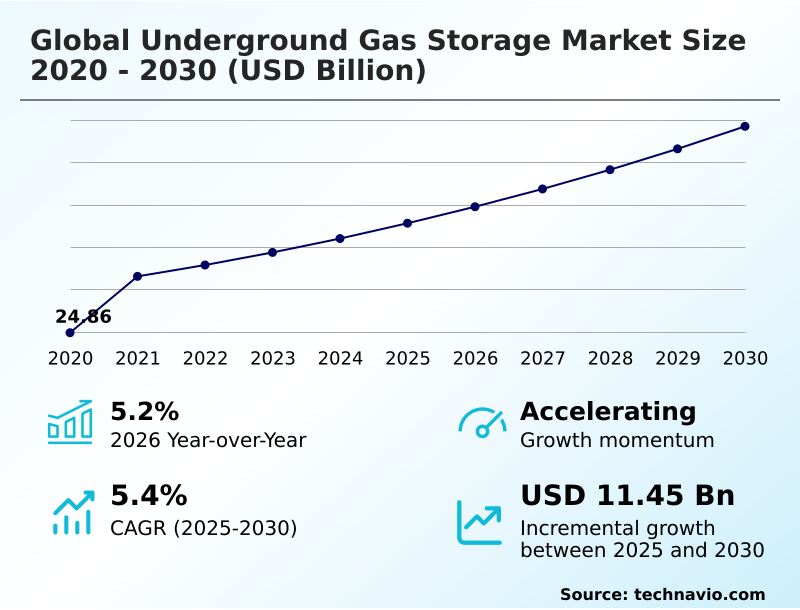
The underground gas storage market size is valued to increase by USD 11.45 billion, at a CAGR of 5.4% from 2025 to 2030. Increasing need for energy security and supply reliability will drive the underground gas storage market.

Major Market Trends & Insights

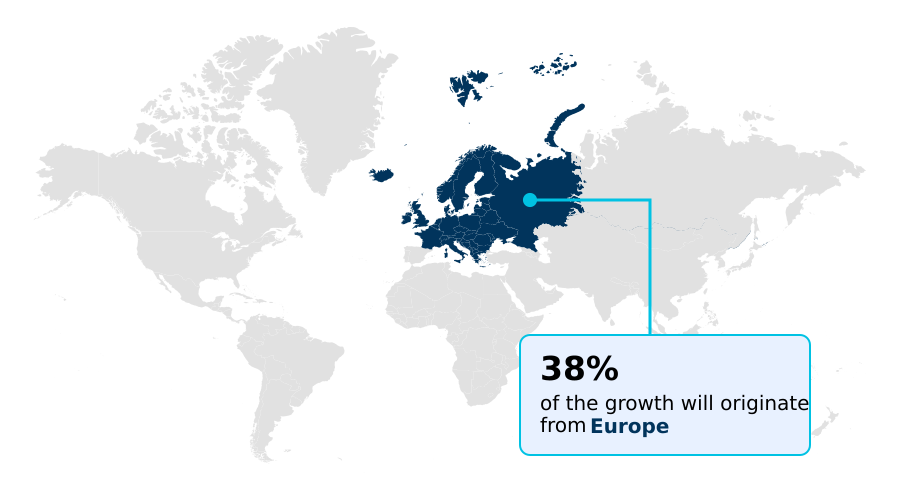
  • Europe dominated the market and accounted for a 38.2% growth during the forecast period.
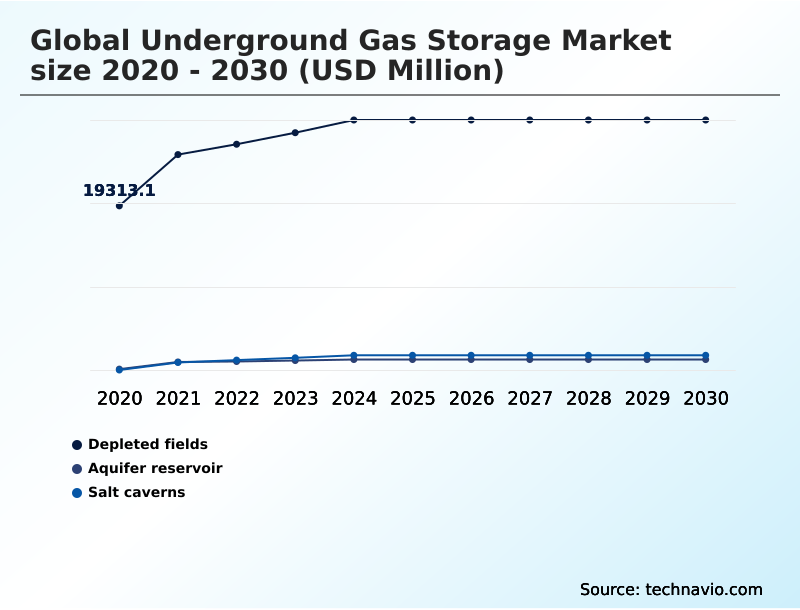
  • By Type - Depleted fields segment was valued at USD 27.99 billion in 2024
  • By Product - Natural gas segment accounted for the largest market revenue share in 2024

Market Size & Forecast

  • Market Opportunities: USD 24.39 billion
  • Market Future Opportunities: USD 11.45 billion
  • CAGR from 2025 to 2030 : 5.4%

Market Summary

  • The underground gas storage market remains a critical component of energy infrastructure, fundamentally enabling the management of supply and demand imbalances. Its importance is magnified by the increasing need for energy security and the global push to integrate intermittent renewable sources into the power grid.
  • Key drivers include the necessity for seasonal demand balancing, particularly for winter heating loads, and the provision of grid stability services to support gas-to-power infrastructure. A prominent trend involves the strategic pivot toward hydrogen readiness validation and multi-gas compatibility, repurposing assets like salt caverns for future energy carriers.
  • For instance, a utility provider leverages its working gas capacity in depleted gas reservoirs not only for seasonal arbitrage but also as a strategic gas reserve to ensure uninterrupted fuel for its power plants during unexpected pipeline disruptions, thereby ensuring operational efficiency optimization.
  • However, the industry faces challenges related to the high capital costs of asset modernization programs and navigating stringent regulatory frameworks for new developments.

What will be the Size of the Underground Gas Storage Market during the forecast period?

Get Key Insights on Market Forecast (PDF) Get Free Sample

How is the Underground Gas Storage Market Segmented?

The underground gas storage industry research report provides comprehensive data (region-wise segment analysis), with forecasts and estimates in "USD million" for the period 2026-2030, as well as historical data from 2020-2024 for the following segments.

  • Type
    • Depleted fields
    • Aquifer reservoir
    • Salt caverns
  • Product
    • Natural gas
    • Hydrogen
    • Others
  • End-user
    • Power generation
    • Residential and commercial
    • Industrial
    • Others
  • Geography
    • Europe
      • Germany
      • Italy
      • The Netherlands
    • North America
      • US
      • Canada
      • Mexico
    • APAC
      • China
      • Australia
      • Japan
    • Middle East and Africa
      • Turkey
      • Saudi Arabia
      • UAE
    • South America
      • Argentina
      • Brazil
    • Rest of World (ROW)

By Type Insights

The depleted fields segment is estimated to witness significant growth during the forecast period.

Depleted fields are the most established form of underground gas storage, leveraging former production reservoirs for new utility. These sites benefit from well-documented geological traits, including proven caprock integrity and known reservoir pressure monitoring parameters, which significantly de-risk development.

Existing infrastructure, from wells to pipelines, can often be repurposed, reducing initial capital outlay.

While their geomechanical stability is understood, they offer lower injection and withdrawal rates compared to other options, making them optimal for seasonal demand balancing rather than high-frequency balancing.

The reuse of assets is a key economic driver, with some operators reporting up to a 20% increase in capital efficiency on conversion projects compared to greenfield developments.

This segment’s maturity provides a reliable foundation for regional energy supply chain resilience.

Get Free Sample

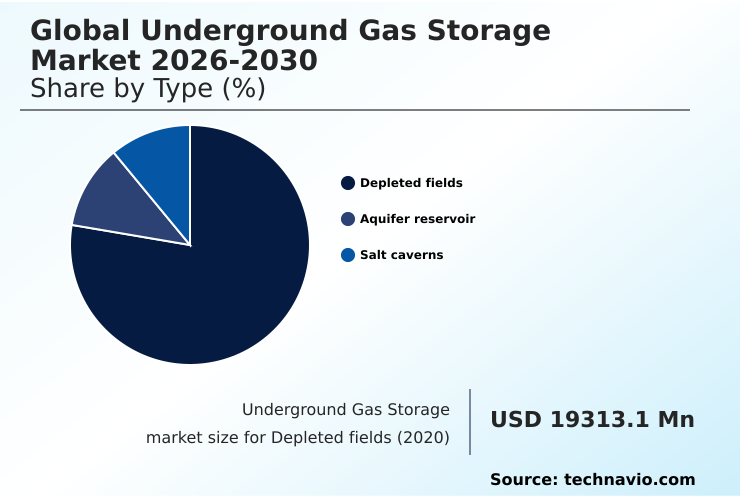
The Depleted fields segment was valued at USD 27.99 billion in 2024 and showed a gradual increase during the forecast period.

Get Free Sample

Regional Analysis

Europe is estimated to contribute 38.2% to the growth of the global market during the forecast period.Technavio’s analysts have elaborately explained the regional trends and drivers that shape the market during the forecast period.

See How Underground Gas Storage Market Demand is Rising in Europe Get Free Sample

The geographic landscape of the underground gas storage market is defined by regional energy priorities and geological potential.

In Europe, the focus is on meeting security of supply mandates through strategic gas reserves, with facilities in Germany and Italy optimizing cushion gas volume to maximize deliverable capacity.

North America leverages its vast depleted gas reservoirs and salt cavern storage to support a dynamic energy market, including growing LNG exports. Here, digital twin modeling has improved forecast accuracy for gas deliverability by over 18%.

Meanwhile, the APAC region, led by China, is rapidly expanding its underground storage to manage seasonal demand, with new projects achieving operational status 20% faster than historical averages due to streamlined construction and commissioning processes.

Each region adapts its use of floating storage regasification units (FSRUs) and pipeline line pack to complement its primary underground storage strategy.

Market Dynamics

Our researchers analyzed the data with 2025 as the base year, along with the key drivers, trends, and challenges. A holistic analysis of drivers will help companies refine their marketing strategies to gain a competitive advantage.

  • The strategic development of the underground gas storage market is increasingly focused on future-proofing assets while managing legacy infrastructure. The economic viability based on seasonal spreads remains a core consideration, but the conversation has expanded. For instance, the role of storage in national energy strategy now includes preparing for a decarbonized future.
  • This involves detailed assessments of repurposing depleted fields for hydrogen and advancing underground hydrogen storage in salt caverns. The latter requires overcoming technical hurdles like hydrogen embrittlement in steel well casings, a key focus of current research. Simultaneously, operators are managing wellbore integrity for aging storage assets, where new methane leakage mitigation technologies have proven critical.
  • These modern systems can reduce fugitive emissions by over 80% compared to older facilities. The planning for new capacity involves complex choices, such as evaluating the cost of cushion gas in aquifer storage versus the high capital investment for the solution mining for salt cavern creation.
  • The goal of balancing the grid with gas-fired peaker plants is driving demand for high deliverability storage for LNG export and domestic peak shaving with high-cycle salt caverns. The entire value chain, from managing seasonal demand with depleted reservoirs to exploring underground storage for synthetic methane, is undergoing a transformation.
  • This shift is supported by advanced tools like a digital twin for reservoir pressure management to ensure the geomechanical stability of storage formations. Furthermore, the push for environmental stewardship has intensified the regulatory permitting for new storage facilities, while also creating opportunities for CCUS in deep saline aquifer formations.

What are the key market drivers leading to the rise in the adoption of Underground Gas Storage Industry?

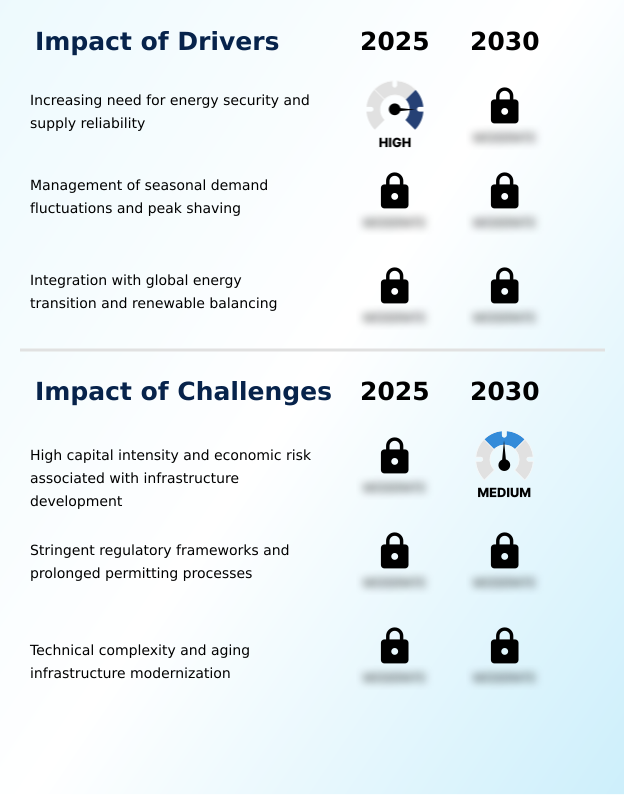
  • The increasing need for energy security and supply reliability is a key driver of market growth.

  • Market growth is fundamentally driven by the need for energy security and grid stability in a shifting energy landscape. The imperative to manage seasonal price spreads and ensure a reliable supply for gas-to-power infrastructure underpins the value of underground storage.
  • As the penetration of intermittent renewables increases, the role of ancillary service provision from high-deliverability storage has become critical; facilities are now able to respond to grid fluctuations up to 40% faster than a decade ago.
  • This capability for intermittent renewable balancing is a significant factor attracting new investment. Furthermore, mandatory inventory levels and national security mandates in key regions are compelling the expansion of working gas capacity.
  • This strategic development ensures that a buffer is available to counter supply disruptions, with some regions now holding strategic gas reserves equivalent to 30 days of peak consumption.

What are the market trends shaping the Underground Gas Storage Industry?

  • The accelerated integration of digitalization and artificial intelligence in asset management is an upcoming market trend. This shift is poised to optimize operational efficiency and enhance predictive maintenance capabilities across the sector.

  • Key trends are reshaping the underground gas storage market, primarily through digitalization and decarbonization initiatives. The adoption of predictive maintenance analytics is improving asset performance, with some operators reporting a 15% reduction in unscheduled downtime. This focus on operational efficiency optimization is critical for managing both legacy assets and new developments.
  • Concurrently, the industry is advancing toward multi-gas compatibility, with significant investment in hydrogen readiness validation. Pilot projects for underground hydrogen storage in salt caverns are demonstrating the technical feasibility of repurposing infrastructure, a key component of long-duration energy storage strategies.
  • This transition is supported by a heightened focus on environmental compliance, where the deployment of satellite-based methane monitoring has enhanced leakage detection accuracy by over 30%, reinforcing the sector's commitment to sustainable operations and meeting stringent security of supply mandates.

What challenges does the Underground Gas Storage Industry face during its growth?

  • The high capital intensity and economic risk associated with infrastructure development pose a key challenge to industry growth.

  • Significant challenges constrain the pace of development in the underground gas storage market, led by high capital intensity and regulatory hurdles. The financial risk of new projects is substantial, as economic viability is often tied to volatile seasonal energy prices.
  • Navigating the stringent regulatory permitting for new storage facilities can add years to project timelines, with approval processes in some jurisdictions now taking up to 50% longer than a decade ago. Modernizing aging infrastructure presents another major hurdle, as ensuring the geomechanical stability of decades-old depleted reservoirs requires significant and ongoing investment.
  • These asset modernization programs can consume over 60% of a facility's annual capital budget. Finally, technical complexities, such as the potential for hydrogen embrittlement in steel infrastructure when considering conversion for hydrogen storage, require new engineering solutions and add to the overall project risk and cost.

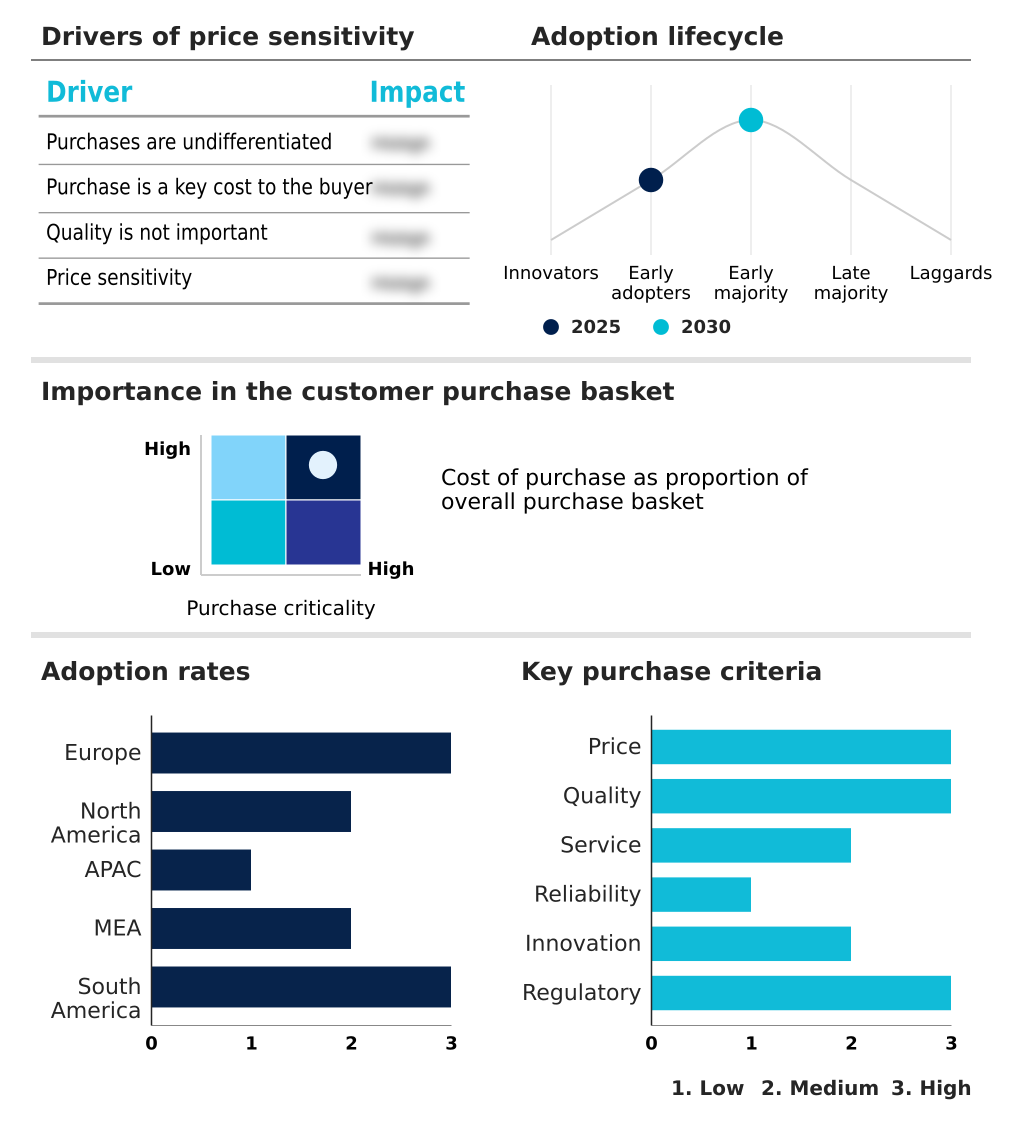
Exclusive Technavio Analysis on Customer Landscape

The underground gas storage market forecasting report includes the adoption lifecycle of the market, covering from the innovator’s stage to the laggard’s stage. It focuses on adoption rates in different regions based on penetration. Furthermore, the underground gas storage market report also includes key purchase criteria and drivers of price sensitivity to help companies evaluate and develop their market growth analysis strategies.

Customer Landscape of Underground Gas Storage Industry

Competitive Landscape

Companies are implementing various strategies, such as strategic alliances, underground gas storage market forecast, partnerships, mergers and acquisitions, geographical expansion, and product/service launches, to enhance their presence in the industry.

Atmos Energy Corp. - Analysis points to specialized offerings in seasonal storage and flexible gas supply services, leveraging underground facilities to ensure market balance and supply reliability.

The industry research and growth report includes detailed analyses of the competitive landscape of the market and information about key companies, including:

  • Atmos Energy Corp.
  • Boardwalk Pipelines LP
  • Centrica Plc
  • Dominion Energy Inc.
  • DTE Energy.
  • Enagas SA
  • Enbridge Inc.
  • Energy Transfer LP
  • Equinor ASA
  • Kinder Morgan Inc.
  • National Fuel Gas Company
  • NiSource Inc
  • OMV AG
  • ONEOK Inc.
  • RWE AG
  • SSE Plc
  • TC Energy Corp.
  • The Williams Co. Inc
  • Uniper SE
  • WEC Energy Group Inc

Qualitative and quantitative analysis of companies has been conducted to help clients understand the wider business environment as well as the strengths and weaknesses of key industry players. Data is qualitatively analyzed to categorize companies as pure play, category-focused, industry-focused, and diversified; it is quantitatively analyzed to categorize companies as dominant, leading, strong, tentative, and weak.

Recent Development and News in Underground gas storage market

  • In September 2024, Enagas SA completed a feasibility study confirming the potential to increase its underground storage capacity by 15% to bolster Spain's role as a European energy hub.
  • In November 2024, The U.S. Department of Energy announced a new funding initiative to support the modernization of aging underground gas storage infrastructure, focusing on methane leak detection and prevention technologies.
  • In January 2025, STORAG Etzel initiated the first commercial-scale hydrogen filling in its salt caverns in Germany, marking a pivotal step in repurposing existing infrastructure for clean energy carriers.
  • In March 2025, Sempra Infrastructure officially commenced construction of its Phase 1 LA Storage facility in Cameron Parish, Louisiana, a project designed to expand salt cavern capacity for the growing Liquefied Natural Gas export market.

Dive into Technavio’s robust research methodology, blending expert interviews, extensive data synthesis, and validated models for unparalleled Underground Gas Storage Market insights. See full methodology.

Market Scope
Page number 301
Base year 2025
Historic period 2020-2024
Forecast period 2026-2030
Growth momentum & CAGR Accelerate at a CAGR of 5.4%
Market growth 2026-2030 USD 11452.5 million
Market structure Fragmented
YoY growth 2025-2026(%) 5.2%
Key countries Germany, Italy, The Netherlands, France, UK, Spain, US, Canada, Mexico, China, Australia, Japan, South Korea, India, Indonesia, Turkey, Saudi Arabia, UAE, Israel, South Africa, Argentina, Brazil and Chile
Competitive landscape Leading Companies, Market Positioning of Companies, Competitive Strategies, and Industry Risks

Request Free Sample

Research Analyst Overview

  • The underground gas storage market is undergoing a strategic transformation, driven by the dual mandates of ensuring current energy security and preparing for a decarbonized future. Boardroom decisions are increasingly centered on long-term capital allocation for asset modernization, weighing the costs of maintaining geomechanical stability in aging depleted gas reservoirs against investing in new salt cavern storage.
  • This is complicated by the push towards hydrogen readiness, where managing the risks of hydrogen embrittlement and ensuring caprock integrity for a different gas composition are paramount. Operators are leveraging advanced technologies like digital twin modeling to optimize injection and withdrawal rates and ensure wellbore integrity.
  • The viability of projects often hinges on managing cushion gas volume to maximize working gas capacity, a critical factor in both seasonal demand balancing and providing high-frequency balancing for grids with intermittent renewables. The integration of LNG regasification and even floating storage regasification units (FSRUs) with underground assets highlights a move toward a more flexible and interconnected system.
  • This strategic pivot is evident in projects focused on CCUS and synthetic methane storage, where facilities implementing new reservoir pressure monitoring technologies have demonstrated a 20% improvement in operational safety compliance.

What are the Key Data Covered in this Underground Gas Storage Market Research and Growth Report?

  • What is the expected growth of the Underground Gas Storage Market between 2026 and 2030?

    • USD 11.45 billion, at a CAGR of 5.4%

  • What segmentation does the market report cover?

    • The report is segmented by Type (Depleted fields, Aquifer reservoir, and Salt caverns), Product (Natural gas, Hydrogen, and Others), End-user (Power generation, Residential and commercial, Industrial, and Others) and Geography (Europe, North America, APAC, Middle East and Africa, South America)

  • Which regions are analyzed in the report?

    • Europe, North America, APAC, Middle East and Africa and South America

  • What are the key growth drivers and market challenges?

    • Increasing need for energy security and supply reliability, High capital intensity and economic risk associated with infrastructure development

  • Who are the major players in the Underground Gas Storage Market?

    • Atmos Energy Corp., Boardwalk Pipelines LP, Centrica Plc, Dominion Energy Inc., DTE Energy., Enagas SA, Enbridge Inc., Energy Transfer LP, Equinor ASA, Kinder Morgan Inc., National Fuel Gas Company, NiSource Inc, OMV AG, ONEOK Inc., RWE AG, SSE Plc, TC Energy Corp., The Williams Co. Inc, Uniper SE and WEC Energy Group Inc

Market Research Insights

  • The dynamics of the underground gas storage market are shaped by the critical need for energy infrastructure resilience. Strategic infrastructure asset management is shifting, with a focus on asset modernization programs that improve performance; facilities adopting predictive maintenance analytics have seen a 15% reduction in unplanned outages.
  • The commercial landscape is heavily influenced by seasonal price spreads, which dictate the profitability of storage operations. In response to stricter security of supply mandates, operators are enhancing capacity, leading to a 10% average increase in deliverable volumes from key facilities over the past two years.
  • This push for reliability is essential for supporting both industrial consumers and providing crucial grid stability services in an evolving energy mix.

We can help! Our analysts can customize this underground gas storage market research report to meet your requirements.

Get in touch

1. Executive Summary

1.1 Market overview

Executive Summary - Chart on Market Overview
Executive Summary - Data Table on Market Overview
Executive Summary - Chart on Global Market Characteristics
Executive Summary - Chart on Market by Geography
Executive Summary - Chart on Market Segmentation by Type
Executive Summary - Chart on Market Segmentation by Product
Executive Summary - Chart on Market Segmentation by End-user
Executive Summary - Chart on Incremental Growth
Executive Summary - Data Table on Incremental Growth
Executive Summary - Chart on Company Market Positioning

2. Technavio Analysis

2.1 Analysis of price sensitivity, lifecycle, customer purchase basket, adoption rates, and purchase criteria

2.2 Criticality of inputs and Factors of differentiation

Chart on Overview on criticality of inputs and factors of differentiation

2.3 Factors of disruption

Chart on Overview on factors of disruption

2.4 Impact of drivers and challenges

Chart on Impact of drivers and challenges in 2025 and 2030

3. Market Landscape

3.1 Market ecosystem

Chart on Parent Market
Data Table on - Parent Market

3.2 Market characteristics

Chart on Market characteristics analysis

3.3 Value chain analysis

Chart on Value chain analysis

4. Market Sizing

4.1 Market definition

Data Table on Offerings of companies included in the market definition

4.2 Market segment analysis

Market segments

4.3 Market size 2025

4.4 Market outlook: Forecast for 2025-2030

Chart on Global - Market size and forecast 2025-2030 ($ million)
Data Table on Global - Market size and forecast 2025-2030 ($ million)
Chart on Global Market: Year-over-year growth 2025-2030 (%)
Data Table on Global Market: Year-over-year growth 2025-2030 (%)

5. Historic Market Size

5.1 Global Underground Gas Storage Market 2020 - 2024

Historic Market Size - Data Table on Global Underground Gas Storage Market 2020 - 2024 ($ million)

5.2 Type segment analysis 2020 - 2024

Historic Market Size - Type Segment 2020 - 2024 ($ million)

5.3 Product segment analysis 2020 - 2024

Historic Market Size - Product Segment 2020 - 2024 ($ million)

5.4 End-user segment analysis 2020 - 2024

Historic Market Size - End-user Segment 2020 - 2024 ($ million)

5.5 Geography segment analysis 2020 - 2024

Historic Market Size - Geography Segment 2020 - 2024 ($ million)

5.6 Country segment analysis 2020 - 2024

Historic Market Size - Country Segment 2020 - 2024 ($ million)

6. Qualitative Analysis

6.1 Impact of AI on global underground gas storage market

6.2 Impact of geopolitical conflicts on global underground gas storage market

7. Five Forces Analysis

7.1 Five forces summary

Five forces analysis - Comparison between 2025 and 2030

7.2 Bargaining power of buyers

Bargaining power of buyers - Impact of key factors 2025 and 2030

7.3 Bargaining power of suppliers

Bargaining power of suppliers - Impact of key factors in 2025 and 2030

7.4 Threat of new entrants

Threat of new entrants - Impact of key factors in 2025 and 2030

7.5 Threat of substitutes

Threat of substitutes - Impact of key factors in 2025 and 2030

7.6 Threat of rivalry

Threat of rivalry - Impact of key factors in 2025 and 2030

7.7 Market condition

Chart on Market condition - Five forces 2025 and 2030

8. Market Segmentation by Type

8.1 Market segments

Chart on Type - Market share 2025-2030 (%)
Data Table on Type - Market share 2025-2030 (%)

8.2 Comparison by Type

Chart on Comparison by Type
Data Table on Comparison by Type

8.3 Depleted fields - Market size and forecast 2025-2030

Chart on Depleted fields - Market size and forecast 2025-2030 ($ million)
Data Table on Depleted fields - Market size and forecast 2025-2030 ($ million)
Chart on Depleted fields - Year-over-year growth 2025-2030 (%)
Data Table on Depleted fields - Year-over-year growth 2025-2030 (%)

8.4 Aquifer reservoir - Market size and forecast 2025-2030

Chart on Aquifer reservoir - Market size and forecast 2025-2030 ($ million)
Data Table on Aquifer reservoir - Market size and forecast 2025-2030 ($ million)
Chart on Aquifer reservoir - Year-over-year growth 2025-2030 (%)
Data Table on Aquifer reservoir - Year-over-year growth 2025-2030 (%)

8.5 Salt caverns - Market size and forecast 2025-2030

Chart on Salt caverns - Market size and forecast 2025-2030 ($ million)
Data Table on Salt caverns - Market size and forecast 2025-2030 ($ million)
Chart on Salt caverns - Year-over-year growth 2025-2030 (%)
Data Table on Salt caverns - Year-over-year growth 2025-2030 (%)

8.6 Market opportunity by Type

Market opportunity by Type ($ million)
Data Table on Market opportunity by Type ($ million)

9. Market Segmentation by Product

9.1 Market segments

Chart on Product - Market share 2025-2030 (%)
Data Table on Product - Market share 2025-2030 (%)

9.2 Comparison by Product

Chart on Comparison by Product
Data Table on Comparison by Product

9.3 Natural gas - Market size and forecast 2025-2030

Chart on Natural gas - Market size and forecast 2025-2030 ($ million)
Data Table on Natural gas - Market size and forecast 2025-2030 ($ million)
Chart on Natural gas - Year-over-year growth 2025-2030 (%)
Data Table on Natural gas - Year-over-year growth 2025-2030 (%)

9.4 Hydrogen - Market size and forecast 2025-2030

Chart on Hydrogen - Market size and forecast 2025-2030 ($ million)
Data Table on Hydrogen - Market size and forecast 2025-2030 ($ million)
Chart on Hydrogen - Year-over-year growth 2025-2030 (%)
Data Table on Hydrogen - Year-over-year growth 2025-2030 (%)

9.5 Others - Market size and forecast 2025-2030

Chart on Others - Market size and forecast 2025-2030 ($ million)
Data Table on Others - Market size and forecast 2025-2030 ($ million)
Chart on Others - Year-over-year growth 2025-2030 (%)
Data Table on Others - Year-over-year growth 2025-2030 (%)

9.6 Market opportunity by Product

Market opportunity by Product ($ million)
Data Table on Market opportunity by Product ($ million)

10. Market Segmentation by End-user

10.1 Market segments

Chart on End-user - Market share 2025-2030 (%)
Data Table on End-user - Market share 2025-2030 (%)

10.2 Comparison by End-user

Chart on Comparison by End-user
Data Table on Comparison by End-user

10.3 Power generation - Market size and forecast 2025-2030

Chart on Power generation - Market size and forecast 2025-2030 ($ million)
Data Table on Power generation - Market size and forecast 2025-2030 ($ million)
Chart on Power generation - Year-over-year growth 2025-2030 (%)
Data Table on Power generation - Year-over-year growth 2025-2030 (%)

10.4 Residential and commercial - Market size and forecast 2025-2030

Chart on Residential and commercial - Market size and forecast 2025-2030 ($ million)
Data Table on Residential and commercial - Market size and forecast 2025-2030 ($ million)
Chart on Residential and commercial - Year-over-year growth 2025-2030 (%)
Data Table on Residential and commercial - Year-over-year growth 2025-2030 (%)

10.5 Industrial - Market size and forecast 2025-2030

Chart on Industrial - Market size and forecast 2025-2030 ($ million)
Data Table on Industrial - Market size and forecast 2025-2030 ($ million)
Chart on Industrial - Year-over-year growth 2025-2030 (%)
Data Table on Industrial - Year-over-year growth 2025-2030 (%)

10.6 Others - Market size and forecast 2025-2030

Chart on Others - Market size and forecast 2025-2030 ($ million)
Data Table on Others - Market size and forecast 2025-2030 ($ million)
Chart on Others - Year-over-year growth 2025-2030 (%)
Data Table on Others - Year-over-year growth 2025-2030 (%)

10.7 Market opportunity by End-user

Market opportunity by End-user ($ million)
Data Table on Market opportunity by End-user ($ million)

11. Customer Landscape

11.1 Customer landscape overview

Analysis of price sensitivity, lifecycle, customer purchase basket, adoption rates, and purchase criteria

12. Geographic Landscape

12.1 Geographic segmentation

Chart on Market share by geography 2025-2030 (%)
Data Table on Market share by geography 2025-2030 (%)

12.2 Geographic comparison

Chart on Geographic comparison
Data Table on Geographic comparison

12.3 Europe - Market size and forecast 2025-2030

Chart on Europe - Market size and forecast 2025-2030 ($ million)
Data Table on Europe - Market size and forecast 2025-2030 ($ million)
Chart on Europe - Year-over-year growth 2025-2030 (%)
Data Table on Europe - Year-over-year growth 2025-2030 (%)
Chart on Regional Comparison - Europe
Data Table on Regional Comparison - Europe

12.3.1 Germany - Market size and forecast 2025-2030

Chart on Germany - Market size and forecast 2025-2030 ($ million)
Data Table on Germany - Market size and forecast 2025-2030 ($ million)
Chart on Germany - Year-over-year growth 2025-2030 (%)
Data Table on Germany - Year-over-year growth 2025-2030 (%)

12.3.2 Italy - Market size and forecast 2025-2030

Chart on Italy - Market size and forecast 2025-2030 ($ million)
Data Table on Italy - Market size and forecast 2025-2030 ($ million)
Chart on Italy - Year-over-year growth 2025-2030 (%)
Data Table on Italy - Year-over-year growth 2025-2030 (%)

12.3.3 The Netherlands - Market size and forecast 2025-2030

Chart on The Netherlands - Market size and forecast 2025-2030 ($ million)
Data Table on The Netherlands - Market size and forecast 2025-2030 ($ million)
Chart on The Netherlands - Year-over-year growth 2025-2030 (%)
Data Table on The Netherlands - Year-over-year growth 2025-2030 (%)

12.3.4 France - Market size and forecast 2025-2030

Chart on France - Market size and forecast 2025-2030 ($ million)
Data Table on France - Market size and forecast 2025-2030 ($ million)
Chart on France - Year-over-year growth 2025-2030 (%)
Data Table on France - Year-over-year growth 2025-2030 (%)

12.3.5 UK - Market size and forecast 2025-2030

Chart on UK - Market size and forecast 2025-2030 ($ million)
Data Table on UK - Market size and forecast 2025-2030 ($ million)
Chart on UK - Year-over-year growth 2025-2030 (%)
Data Table on UK - Year-over-year growth 2025-2030 (%)

12.3.6 Spain - Market size and forecast 2025-2030

Chart on Spain - Market size and forecast 2025-2030 ($ million)
Data Table on Spain - Market size and forecast 2025-2030 ($ million)
Chart on Spain - Year-over-year growth 2025-2030 (%)
Data Table on Spain - Year-over-year growth 2025-2030 (%)

12.4 North America - Market size and forecast 2025-2030

Chart on North America - Market size and forecast 2025-2030 ($ million)
Data Table on North America - Market size and forecast 2025-2030 ($ million)
Chart on North America - Year-over-year growth 2025-2030 (%)
Data Table on North America - Year-over-year growth 2025-2030 (%)
Chart on Regional Comparison - North America
Data Table on Regional Comparison - North America

12.4.1 US - Market size and forecast 2025-2030

Chart on US - Market size and forecast 2025-2030 ($ million)
Data Table on US - Market size and forecast 2025-2030 ($ million)
Chart on US - Year-over-year growth 2025-2030 (%)
Data Table on US - Year-over-year growth 2025-2030 (%)

12.4.2 Canada - Market size and forecast 2025-2030

Chart on Canada - Market size and forecast 2025-2030 ($ million)
Data Table on Canada - Market size and forecast 2025-2030 ($ million)
Chart on Canada - Year-over-year growth 2025-2030 (%)
Data Table on Canada - Year-over-year growth 2025-2030 (%)

12.4.3 Mexico - Market size and forecast 2025-2030

Chart on Mexico - Market size and forecast 2025-2030 ($ million)
Data Table on Mexico - Market size and forecast 2025-2030 ($ million)
Chart on Mexico - Year-over-year growth 2025-2030 (%)
Data Table on Mexico - Year-over-year growth 2025-2030 (%)

12.5 APAC - Market size and forecast 2025-2030

Chart on APAC - Market size and forecast 2025-2030 ($ million)
Data Table on APAC - Market size and forecast 2025-2030 ($ million)
Chart on APAC - Year-over-year growth 2025-2030 (%)
Data Table on APAC - Year-over-year growth 2025-2030 (%)
Chart on Regional Comparison - APAC
Data Table on Regional Comparison - APAC

12.5.1 China - Market size and forecast 2025-2030

Chart on China - Market size and forecast 2025-2030 ($ million)
Data Table on China - Market size and forecast 2025-2030 ($ million)
Chart on China - Year-over-year growth 2025-2030 (%)
Data Table on China - Year-over-year growth 2025-2030 (%)

12.5.2 Australia - Market size and forecast 2025-2030

Chart on Australia - Market size and forecast 2025-2030 ($ million)
Data Table on Australia - Market size and forecast 2025-2030 ($ million)
Chart on Australia - Year-over-year growth 2025-2030 (%)
Data Table on Australia - Year-over-year growth 2025-2030 (%)

12.5.3 Japan - Market size and forecast 2025-2030

Chart on Japan - Market size and forecast 2025-2030 ($ million)
Data Table on Japan - Market size and forecast 2025-2030 ($ million)
Chart on Japan - Year-over-year growth 2025-2030 (%)
Data Table on Japan - Year-over-year growth 2025-2030 (%)

12.5.4 South Korea - Market size and forecast 2025-2030

Chart on South Korea - Market size and forecast 2025-2030 ($ million)
Data Table on South Korea - Market size and forecast 2025-2030 ($ million)
Chart on South Korea - Year-over-year growth 2025-2030 (%)
Data Table on South Korea - Year-over-year growth 2025-2030 (%)

12.5.5 India - Market size and forecast 2025-2030

Chart on India - Market size and forecast 2025-2030 ($ million)
Data Table on India - Market size and forecast 2025-2030 ($ million)
Chart on India - Year-over-year growth 2025-2030 (%)
Data Table on India - Year-over-year growth 2025-2030 (%)

12.5.6 Indonesia - Market size and forecast 2025-2030

Chart on Indonesia - Market size and forecast 2025-2030 ($ million)
Data Table on Indonesia - Market size and forecast 2025-2030 ($ million)
Chart on Indonesia - Year-over-year growth 2025-2030 (%)
Data Table on Indonesia - Year-over-year growth 2025-2030 (%)

12.6 Middle East and Africa - Market size and forecast 2025-2030

Chart on Middle East and Africa - Market size and forecast 2025-2030 ($ million)
Data Table on Middle East and Africa - Market size and forecast 2025-2030 ($ million)
Chart on Middle East and Africa - Year-over-year growth 2025-2030 (%)
Data Table on Middle East and Africa - Year-over-year growth 2025-2030 (%)
Chart on Regional Comparison - Middle East and Africa
Data Table on Regional Comparison - Middle East and Africa

12.6.1 Turkey - Market size and forecast 2025-2030

Chart on Turkey - Market size and forecast 2025-2030 ($ million)
Data Table on Turkey - Market size and forecast 2025-2030 ($ million)
Chart on Turkey - Year-over-year growth 2025-2030 (%)
Data Table on Turkey - Year-over-year growth 2025-2030 (%)

12.6.2 Saudi Arabia - Market size and forecast 2025-2030

Chart on Saudi Arabia - Market size and forecast 2025-2030 ($ million)
Data Table on Saudi Arabia - Market size and forecast 2025-2030 ($ million)
Chart on Saudi Arabia - Year-over-year growth 2025-2030 (%)
Data Table on Saudi Arabia - Year-over-year growth 2025-2030 (%)

12.6.3 UAE - Market size and forecast 2025-2030

Chart on UAE - Market size and forecast 2025-2030 ($ million)
Data Table on UAE - Market size and forecast 2025-2030 ($ million)
Chart on UAE - Year-over-year growth 2025-2030 (%)
Data Table on UAE - Year-over-year growth 2025-2030 (%)

12.6.4 Israel - Market size and forecast 2025-2030

Chart on Israel - Market size and forecast 2025-2030 ($ million)
Data Table on Israel - Market size and forecast 2025-2030 ($ million)
Chart on Israel - Year-over-year growth 2025-2030 (%)
Data Table on Israel - Year-over-year growth 2025-2030 (%)

12.6.5 South Africa - Market size and forecast 2025-2030

Chart on South Africa - Market size and forecast 2025-2030 ($ million)
Data Table on South Africa - Market size and forecast 2025-2030 ($ million)
Chart on South Africa - Year-over-year growth 2025-2030 (%)
Data Table on South Africa - Year-over-year growth 2025-2030 (%)

12.7 South America - Market size and forecast 2025-2030

Chart on South America - Market size and forecast 2025-2030 ($ million)
Data Table on South America - Market size and forecast 2025-2030 ($ million)
Chart on South America - Year-over-year growth 2025-2030 (%)
Data Table on South America - Year-over-year growth 2025-2030 (%)
Chart on Regional Comparison - South America
Data Table on Regional Comparison - South America

12.7.1 Argentina - Market size and forecast 2025-2030

Chart on Argentina - Market size and forecast 2025-2030 ($ million)
Data Table on Argentina - Market size and forecast 2025-2030 ($ million)
Chart on Argentina - Year-over-year growth 2025-2030 (%)
Data Table on Argentina - Year-over-year growth 2025-2030 (%)

12.7.2 Brazil - Market size and forecast 2025-2030

Chart on Brazil - Market size and forecast 2025-2030 ($ million)
Data Table on Brazil - Market size and forecast 2025-2030 ($ million)
Chart on Brazil - Year-over-year growth 2025-2030 (%)
Data Table on Brazil - Year-over-year growth 2025-2030 (%)

12.7.3 Chile - Market size and forecast 2025-2030

Chart on Chile - Market size and forecast 2025-2030 ($ million)
Data Table on Chile - Market size and forecast 2025-2030 ($ million)
Chart on Chile - Year-over-year growth 2025-2030 (%)
Data Table on Chile - Year-over-year growth 2025-2030 (%)

12.8 Market opportunity by geography

Market opportunity by geography ($ million)
Data Tables on Market opportunity by geography ($ million)

13. Drivers, Challenges, and Opportunity

13.1 Market drivers

Increasing need for energy security and supply reliability
Management of seasonal demand fluctuations and peak shaving
Integration with global energy transition and renewable balancing

13.2 Market challenges

High capital intensity and economic risk associated with infrastructure development
Stringent regulatory frameworks and prolonged permitting processes
Technical complexity and aging infrastructure modernization

13.3 Impact of drivers and challenges

Impact of drivers and challenges in 2025 and 2030

13.4 Market opportunities

Accelerated integration of digitalization and artificial intelligence in asset management
Transition toward multi-gas compatibility and hydrogen readiness
Heightened focus on environmental compliance and leakage mitigation

14. Competitive Landscape

14.1 Overview

14.2

Overview on criticality of inputs and factors of differentiation

14.3 Landscape disruption

Overview on factors of disruption

14.4 Industry risks

Impact of key risks on business

15. Competitive Analysis

15.1 Companies profiled

Companies covered

15.2 Company ranking index

15.3 Market positioning of companies

Matrix on companies position and classification

15.4 Centrica Plc

Centrica Plc - Overview
Centrica Plc - Business segments
Centrica Plc - Key offerings
Centrica Plc - Segment focus
SWOT

15.5 Dominion Energy Inc.

Dominion Energy Inc. - Overview
Dominion Energy Inc. - Business segments
Dominion Energy Inc. - Key offerings
Dominion Energy Inc. - Segment focus
SWOT

15.6 DTE Energy.

DTE Energy. - Overview
DTE Energy. - Business segments
DTE Energy. - Key offerings
DTE Energy. - Segment focus
SWOT

15.7 Enagas SA

Enagas SA - Overview
Enagas SA - Business segments
Enagas SA - Key offerings
Enagas SA - Segment focus
SWOT

15.8 Enbridge Inc.

Enbridge Inc. - Overview
Enbridge Inc. - Business segments
Enbridge Inc. - Key offerings
Enbridge Inc. - Segment focus
SWOT

15.9 Energy Transfer LP

Energy Transfer LP - Overview
Energy Transfer LP - Product / Service
Energy Transfer LP - Key offerings
SWOT

15.10 Equinor ASA

Equinor ASA - Overview
Equinor ASA - Business segments
Equinor ASA - Key offerings
Equinor ASA - Segment focus
SWOT

15.11 OMV AG

OMV AG - Overview
OMV AG - Business segments
OMV AG - Key offerings
OMV AG - Segment focus
SWOT

15.12 ONEOK Inc.

ONEOK Inc. - Overview
ONEOK Inc. - Business segments
ONEOK Inc. - Key offerings
ONEOK Inc. - Segment focus
SWOT

15.13 RWE AG

RWE AG - Overview
RWE AG - Business segments
RWE AG - Key offerings
RWE AG - Segment focus
SWOT

15.14 SSE Plc

SSE Plc - Overview
SSE Plc - Product / Service
SSE Plc - Key offerings
SWOT

15.15 TC Energy Corp.

TC Energy Corp. - Overview
TC Energy Corp. - Product / Service
TC Energy Corp. - Key offerings
SWOT

15.16 The Williams Co. Inc

The Williams Co. Inc - Overview
The Williams Co. Inc - Business segments
The Williams Co. Inc - Key offerings
The Williams Co. Inc - Segment focus
SWOT

15.17 Uniper SE

Uniper SE - Overview
Uniper SE - Business segments
Uniper SE - Key offerings
Uniper SE - Segment focus
SWOT

15.18 WEC Energy Group Inc

WEC Energy Group Inc - Overview
WEC Energy Group Inc - Business segments
WEC Energy Group Inc - Key offerings
WEC Energy Group Inc - Segment focus
SWOT

16. Appendix

16.1 Scope of the report

Market definition
Objectives
Notes and caveats

16.2 Inclusions and exclusions checklist

Inclusions checklist
Exclusions checklist

16.3 Currency conversion rates for US$

16.4 Research methodology

16.5 Data procurement

Information sources

16.6 Data validation

16.7 Validation techniques employed for market sizing

16.8 Data synthesis

16.9 360 degree market analysis

16.10 List of abbreviations

Research Methodology

Technavio presents a detailed picture of the market by way of study, synthesis, and summation of data from multiple sources. The analysts have presented the various facets of the market with a particular focus on identifying the key industry influencers. The data thus presented is comprehensive, reliable, and the result of extensive research, both primary and secondary.

INFORMATION SOURCES

Primary sources

  • Manufacturers and suppliers
  • Channel partners
  • Industry experts
  • Strategic decision makers

Secondary sources

  • Industry journals and periodicals
  • Government data
  • Financial reports of key industry players
  • Historical data
  • Press releases

DATA ANALYSIS

Data Synthesis

  • Collation of data
  • Estimation of key figures
  • Analysis of derived insights

Data Validation

  • Triangulation with data models
  • Reference against proprietary databases
  • Corroboration with industry experts

REPORT WRITING

Qualitative

  • Market drivers
  • Market challenges
  • Market trends
  • Five forces analysis

Quantitative

  • Market size and forecast
  • Market segmentation
  • Geographical insights
  • Competitive landscape

Interested in this report?

Get your sample now to see our research methodology and insights!

Download Now

Frequently Asked Questions

Underground Gas Storage market growth will increase by USD 11452.5 million during 2026-2030.

The Underground Gas Storage market is expected to grow at a CAGR of 5.4% during 2026-2030.

Underground Gas Storage market is segmented by Type (Depleted fields, Aquifer reservoir, Salt caverns) Product (Natural gas, Hydrogen, Others) End-user (Power generation, Residential and commercial, Industrial, Others)

Atmos Energy Corp., Boardwalk Pipelines LP, Centrica Plc, Dominion Energy Inc., DTE Energy., Enagas SA, Enbridge Inc., Energy Transfer LP, Equinor ASA, Kinder Morgan Inc., National Fuel Gas Company, NiSource Inc, OMV AG, ONEOK Inc., RWE AG, SSE Plc, TC Energy Corp., The Williams Co. Inc, Uniper SE, WEC Energy Group Inc are a few of the key vendors in the Underground Gas Storage market.

Europe will register the highest growth rate of 38.2% among the other regions. Therefore, the Underground Gas Storage market in Europe is expected to garner significant business opportunities for the vendors during the forecast period.

Germany, Italy, The Netherlands, France, UK, Spain, US, Canada, Mexico, China, Australia, Japan, South Korea, India, Indonesia, Turkey, Saudi Arabia, UAE, Israel, South Africa, Argentina, Brazil, Chile

  • Increasing need for energy security and supply reliability is the driving factor this market.

The Underground Gas Storage market vendors should focus on grabbing business opportunities from the Type segment as it accounted for the largest market share in the base year.
RIA - Research AI Assistant
Ask RIA