
Uranium Market Size 2025-2029
The uranium market size is forecast to increase by USD 2.18 billion at a CAGR of 8.2% between 2024 and 2029.
- The market is characterized by the rising adoption of uranium in nuclear weapons and nuclear reactors, presenting significant growth opportunities. This is due to the escalating reliance on renewable energy, and the rise in uranium mining initiatives. Uranium's role as a primary fuel source in nuclear energy generation continues to expand, driven by the increasing demand for clean energy and the depletion of conventional energy resources. However, the market faces substantial challenges due to the high initial and production costs of uranium. These costs, coupled with the volatility in uranium prices, pose significant challenges for market participants.
- Additionally, investments in research and development of advanced nuclear technologies, such as small modular reactors and nuclear fusion, could offer potential solutions to the high production costs and supply constraints, positioning these companies at the forefront of the evolving market landscape. To capitalize on the growth opportunities and navigate these challenges effectively, companies must focus on optimizing production costs, exploring alternative sources of uranium, and collaborating with industry peers to share best practices and resources. The market is witnessing significant growth due to the increasing adoption of uranium in nuclear weaponry and nuclear reactors.
What will be the Size of the Uranium Market during the forecast period?

Explore in-depth regional segment analysis with market size data - historical 2019-2023 and forecasts 2025-2029 - in the full report.
Request Free Sample
- The market is characterized by a complex interplay of factors, including nuclear emergency response, fusion power research, and nuclear weapons proliferation and disarmament. Small modular reactors and advanced reactors are gaining traction as solutions for nuclear energy security, while radioactive tracer and isotope production are essential in various industries, from agriculture to medical imaging. Nuclear fuel reprocessing and spent fuel management are critical aspects of nuclear arms control and non-proliferation efforts. Breeder reactors and nuclear forensics contribute to nuclear security, while radiation therapy, protection, and nuclear medicine imaging advance healthcare applications.
- Nuclear energy sustainability is a pressing concern, with the need for effective radioactive waste storage and transportation solutions. The Nuclear Security Summit underscores the importance of addressing nuclear terrorism risks. Nuclear magnetic resonance is a versatile technology with applications in various sectors, from materials science to medical research. Additionally, the production cost of uranium and the prices in the market significantly influence the profitability of nuclear power plants.
How is this Uranium Industry segmented?
The uranium industry research report provides comprehensive data (region-wise segment analysis), with forecasts and estimates in "USD million" for the period 2025-2029, as well as historical data from 2019-2023 for the following segments.
- End-user
- Energy
- Military
- Others
- Source
- Primary
- Secondary
- Application
- Industrial counterweights
- Radiation shielding
- Medical isotopes
- Geography
- North America
- US
- Canada
- Mexico
- Europe
- Germany
- Russia
- Ukraine
- APAC
- Australia
- China
- India
- Rest of World (ROW)
- North America
By End-user Insights
The energy segment is estimated to witness significant growth during the forecast period. Uranium plays a crucial role in nuclear power generation, supplying fuel for electricity production in power plants around the world. The global shift towards cleaner energy sources and the rising awareness of carbon footprint reduction have fueled the demand for nuclear power. Nuclear power economics have gained significance, leading to increased investment in uranium production and conversion to uranium hexafluoride for enrichment. Uranium mining continues to be a critical aspect of the industry, with safety, regulation, and sustainability being key considerations. Nuclear power plants require stringent safety measures, including radiation detection and shielding, to ensure reliable operation. Nuclear fuel services provide essential support, from fabrication and licensing to decommissioning and waste management.
Uranium oxide is used in fuel assemblies, while uranium metal is essential for nuclear engineering and innovation. Nuclear power infrastructure development, including construction and technology advancements, continues to drive market growth. Despite the challenges of nuclear power regulation and the presence of nuclear weapons, the industry remains committed to nuclear power safety and security. Uranium enrichment and nuclear power deployment are ongoing areas of research, with potential for significant advancements in nuclear chemistry and power generation. The US nuclear energy industry, which generates approximately 20% of the country's electricity, relies heavily on domestic uranium production.
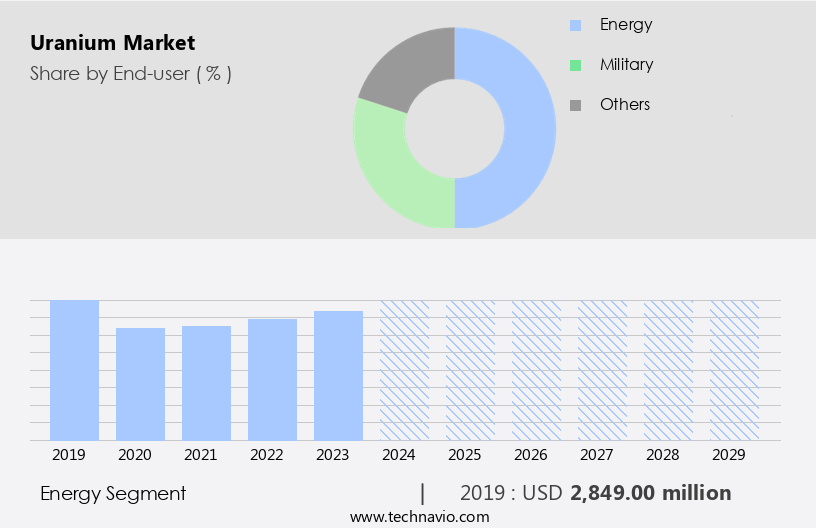
The Energy segment was valued at USD 2.85 billion in 2019 and showed a gradual increase during the forecast period.
The Uranium Market is essential for global energy security, driving advancements in nuclear power investment as nations seek sustainable solutions. Strict nuclear safety regulations ensure the responsible handling of radioactive materials, minimizing risks in extraction, transportation, and usage. Continuous nuclear power research supports technological innovations, improving reactor efficiency and waste management. Governments and private entities navigate complex processes for nuclear power permits, balancing regulatory compliance with energy demands.
The Uranium Market plays a vital role in global energy and security. Safe radioactive waste transportation is essential for handling nuclear byproducts, ensuring environmental and public safety. The Nuclear Nonproliferation Treaty influences uranium trade, promoting responsible usage and preventing unauthorized access. Advances in radiation protection enhance safety for workers and communities involved in uranium extraction and nuclear applications. Increasing demand for radioactive isotope production supports medical, industrial, and scientific research, driving innovation in the sector. Additionally, global efforts in nuclear weapons disarmament impact uranium policies, fostering international collaboration for peace and stability.
Regional Analysis
North America is estimated to contribute 37% to the growth of the global market during the forecast period. Technavio's analysts have elaborately explained the regional trends and drivers that shape the market during the forecast period.

The market in North America is a significant player in the global industry, with the region accounting for over 10% of worldwide production and nearly 25% of consumption. The US and Canada are major uranium producers, with the US being the largest consumer, relying heavily on domestic production to fuel its well-established nuclear energy industry. Generating approximately 20% of its electricity, the country's nuclear plants require a consistent uranium supply. Uranium conversion, fabrication, and enrichment are essential processes in the nuclear fuel cycle, and the US hosts numerous companies specializing in these areas. Uranium hexafluoride is a critical component in the enrichment process, and the US has a strong presence in its production. The nuclear power industry relies on uranium as a primary fuel source for electricity production, while military technology utilizes it for nuclear weapons.
Nuclear power plants in the region utilize fuel assemblies and rely on licensing and safety regulations to ensure reliable operation and sustainability. Uranium oxide is another essential form of uranium used in various applications, including fuel and radiation shielding. Nuclear power infrastructure development and decommissioning also contribute to the market's dynamics. Uranium reserves and mining play a crucial role in the industry's growth, with ongoing research and innovation driving advancements in nuclear power technology and nuclear chemistry. The market's evolution is influenced by nuclear power economics, nuclear energy policy, nuclear power capacity expansion, and nuclear power generation's increasing role in the energy mix.
Additionally, nuclear power's role in nuclear deterrence, nuclear security, and radioactive waste management adds to the market's complexity.
Market Dynamics
Our researchers analyzed the data with 2024 as the base year, along with the key drivers, trends, and challenges. A holistic analysis of drivers will help companies refine their marketing strategies to gain a competitive advantage.
What are the Uranium market drivers leading to the rise in the adoption of Industry?
- The increasing utilization of uranium in the production of nuclear weapons serves as the primary catalyst for market growth in this sector. Uranium, a radioactive material, plays a pivotal role in both nuclear power development and nuclear weapons production. Uranium-235, a rare isotope of uranium, is essential for creating nuclear chain reactions, which can produce significant energy for nuclear power generation or destructive power for nuclear weapons. Nuclear power capacity expansion and the need for nuclear security have driven the demand for uranium. Uranium is used to fabricate fuel assemblies for nuclear power plants, which require licensing and sustainability assessments to ensure safety and efficiency. The mining industry, including major mining companies, plays a crucial role in uranium production, while mineral commodity markets influence its supply and demand dynamics.
- Nuclear energy policy is a critical factor influencing the market, as governments worldwide strive to balance energy security, sustainability, and non-proliferation concerns. Uranium fabrication is a complex process that requires advanced technology and expertise. The market is subject to various market dynamics, including supply and demand, geopolitical factors, and technological advancements. Understanding these factors is crucial for businesses looking to invest in or engage with the market. The market is driven by the strategic importance of uranium in nuclear power and weapons production. Its scarcity and the complex process of extracting and enriching uranium make it a valuable resource. The market's dynamics are influenced by various factors, including nuclear power capacity expansion, nuclear security concerns, and nuclear energy policy.
What are the Uranium market trends shaping the Industry?
- The adoption of nuclear reactors is gaining momentum as a market trend. This increasing trend reflects the growing demand for sustainable and low-carbon energy sources. Nuclear energy is gaining traction as a clean and dependable electricity source in both developed and developing countries. The global nuclear power market is witnessing growth due to various factors, including the need for reliable and economical energy, government incentives, and increasing environmental concerns. For instance, China, with its rapid electricity demand growth, is heavily investing in nuclear energy to reduce carbon emissions. Currently, China operates 50 nuclear reactors, with 17 more under construction.
- Nuclear regulation is stringent to ensure the highest safety standards in nuclear power operation. Nuclear chemistry is another critical area, as it is used in the processing of uranium and the production of nuclear fuel. The decommissioning of nuclear power plants is also a significant aspect of the nuclear power industry, requiring specialized expertise in nuclear engineering and nuclear chemistry. Nuclear engineering plays a crucial role in the nuclear power infrastructure, ensuring the safe and efficient operation of uranium-fueled reactors. Uranium metal and uranium oxide are essential components in nuclear fuel services, which are vital for nuclear power deployment and safety.
How does Uranium market face challenges during its growth?
- The high initial and production costs of uranium pose a significant challenge to the growth of the uranium industry. With substantial investments required for mining, processing, and enrichment, the industry must contend with this financial hurdle in order to expand and meet global energy demands. Uranium, a radioactive element, plays a significant role in nuclear power generation. The nuclear fuel cycle begins with the discovery of uranium deposits through extensive research and permitting processes. This exploration phase can take several years and involves substantial investments. Uranium plays a vital role in the nuclear industry, providing energy and serving as a key component in nuclear weapons.
- The nuclear fuel cycle also encompasses the generation of electricity and the production of nuclear fuel. Despite the high initial and production costs, the benefits of nuclear power, including its low carbon footprint and consistent energy production, make it a valuable energy source for research and development. Once a deposit is identified, mining commences, which includes drilling, blasting, and digging to extract the ore. This process poses risks to workers due to radiation exposure. Uranium enrichment follows mining, which enhances the concentration of uranium-235 for use in nuclear reactors. Nuclear power innovation continues with advancements in nuclear physics and technology, leading to improvements in nuclear power construction, radioactive waste management, and nuclear medicine applications.
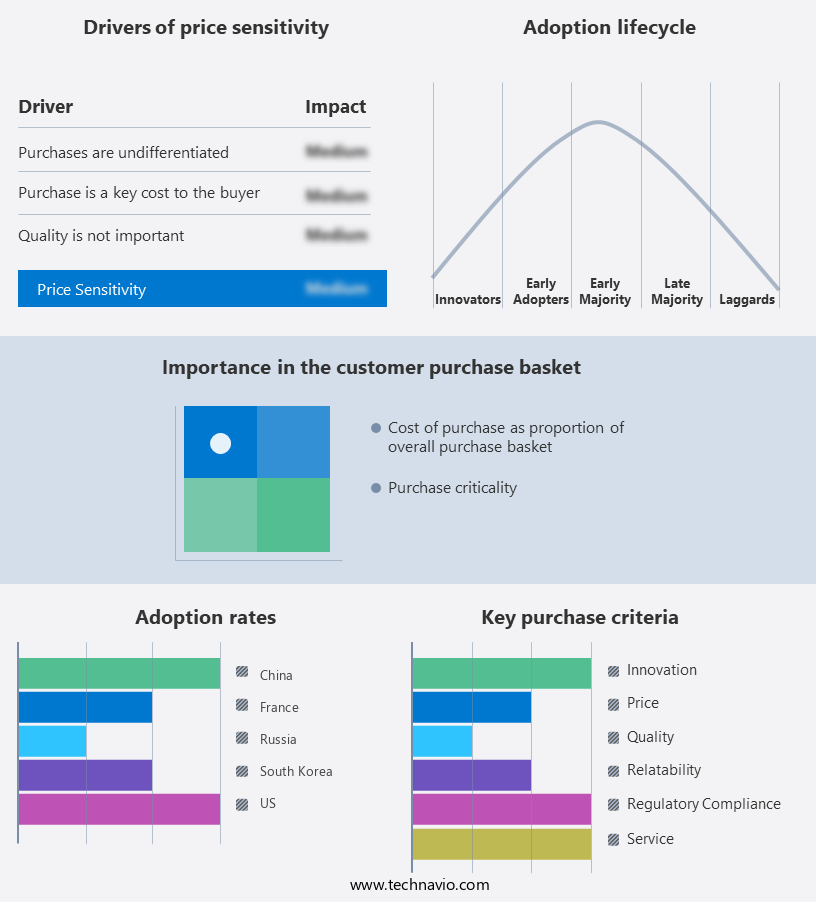
Exclusive Customer Landscape
The uranium market forecasting report includes the adoption lifecycle of the market, covering from the innovator's stage to the laggard's stage. It focuses on adoption rates in different regions based on penetration. Furthermore, the uranium market report also includes key purchase criteria and drivers of price sensitivity to help companies evaluate and develop their market growth analysis strategies.
Customer Landscape
Key Companies & Market Insights
Companies are implementing various strategies, such as strategic alliances, uranium market forecast, partnerships, mergers and acquisitions, geographical expansion, and product/service launches, to enhance their presence in the industry.
A Cap Energy Ltd. - The company specializes in the extraction of uranium, prioritizing sustainable and responsible mining techniques to minimize environmental impact.
The industry research and growth report includes detailed analyses of the competitive landscape of the market and information about key companies, including:
- A Cap Energy Ltd.
- Aurora Energy Metals
- Berkeley Energia Ltd.
- Cameco Corp.
- CGN Mining Co. Ltd.
- China National Nuclear Corp.
- Deep Yellow Ltd.
- Denison Mines Corp.
- Energy Fuels Inc.
- NAC Kazatomprom JSC
- Orano
- Peninsula Energy Ltd.
- Rio Tinto Ltd.
- State Atomic Energy Corp. Rosatom
- State Enterprise Eastern Mining and Processing Plant
- Sumitomo Corp.
- Uranium Energy Corp.
Qualitative and quantitative analysis of companies has been conducted to help clients understand the wider business environment as well as the strengths and weaknesses of key industry players. Data is qualitatively analyzed to categorize companies as pure play, category-focused, industry-focused, and diversified; it is quantitatively analyzed to categorize companies as dominant, leading, strong, tentative, and weak.
Recent Development and News in Uranium Market
- In February 2023, Kazatomprom, the world's largest uranium producer, announced a strategic partnership with Cameco Corporation, the largest uranium producer in Canada. The collaboration aimed to secure long-term uranium supply contracts and strengthen their market positions (Kazatomprom Press Release, 2023).
- In May 2024, Orano, a leading global uranium company, successfully completed the acquisition of Uranium One, a significant uranium producer, from Rosatom State Atomic Energy Corporation. The acquisition expanded Orano's production capacity and market share, making it the second-largest uranium producer worldwide (Orano Press Release, 2024).
- In October 2024, the United States Nuclear Regulatory Commission approved the license extension for the Palo Verde Nuclear Generating Station, the largest nuclear power plant in the U.S. This decision ensured the continued operation of the plant, which consumes a significant portion of the domestic uranium supply (NRC Press Release, 2024).
- In March 2025, Denison Mines Corporation, a uranium exploration and development company, announced the successful demonstration of its innovative in-situ recovery technology, ISR-WAD, at its McClean Lake uranium mine in Canada. This technological advancement could potentially reduce production costs and increase efficiency in the uranium mining industry (Denison Mines Press Release, 2025).
Research Analyst Overview
The market continues to evolve, shaped by intricate dynamics that intertwine nuclear regulation, uranium metal, nuclear engineering, and nuclear power infrastructure. Uranium's role extends beyond nuclear power generation, encompassing nuclear power decommissioning, uranium demand, and nuclear power reliability. Nuclear fuel services and nuclear power safety are integral components, ensuring the continued operation of nuclear power plants and maintaining public trust. Uranium oxide, a crucial element in the nuclear fuel cycle, fuels the deployment of new nuclear power technologies and research in nuclear chemistry.
The ongoing unfolding of market activities reveals evolving patterns, with nuclear power capacity expansion, nuclear power licensing, and nuclear energy policy shaping the landscape. Nuclear power sustainability and innovation drive the construction of new nuclear power plants, while radioactive waste management and nuclear security remain critical concerns. The intricate interplay between these entities underscores the continuous dynamism of the market.
Dive into Technavio's robust research methodology, blending expert interviews, extensive data synthesis, and validated models for unparalleled Uranium Market insights. See full methodology.
|
Market Scope |
|
|
Report Coverage |
Details |
|
Page number |
216 |
|
Base year |
2024 |
|
Historic period |
2019-2023 |
|
Forecast period |
2025-2029 |
|
Growth momentum & CAGR |
Accelerate at a CAGR of 8.2% |
|
Market growth 2025-2029 |
USD 2.18 billion |
|
Market structure |
Fragmented |
|
YoY growth 2024-2025(%) |
7.6 |
|
Key countries |
US, Canada, Kazakhstan, Russia, Ukraine, Australia, China, India, Germany, and Mexico |
|
Competitive landscape |
Leading Companies, Market Positioning of Companies, Competitive Strategies, and Industry Risks |
What are the Key Data Covered in this Uranium Market Research and Growth Report?
- CAGR of the Uranium industry during the forecast period
- Detailed information on factors that will drive the growth and forecasting between 2025 and 2029
- Precise estimation of the size of the market and its contribution of the industry in focus to the parent market
- Accurate predictions about upcoming growth and trends and changes in consumer behaviour
- Growth of the market across North America, Europe, APAC, Middle East and Africa, and South America
- Thorough analysis of the market's competitive landscape and detailed information about companies
- Comprehensive analysis of factors that will challenge the uranium market growth of industry companies
We can help! Our analysts can customize this uranium market research report to meet your requirements.
 RIA -
RIA - 
