Used Trucks Market Analysis North America, Europe, APAC, South America, Middle East and Africa - US, Canada, UK, Germany, France - Size and Forecast 2024-2028

Used Trucks Market Analysis North America, Europe, APAC, South America, Middle East and Africa - US, Canada, UK, Germany, France - Size and Forecast 2024-2028

Published: Feb 2024 172 Pages SKU: IRTNTR44478

Market Overview at a Glance

$13.37 B
Market Opportunity
5.38%
CAGR
4.89
YoY growth 2023-2024(%)

Used Trucks Market Size 2024-2028

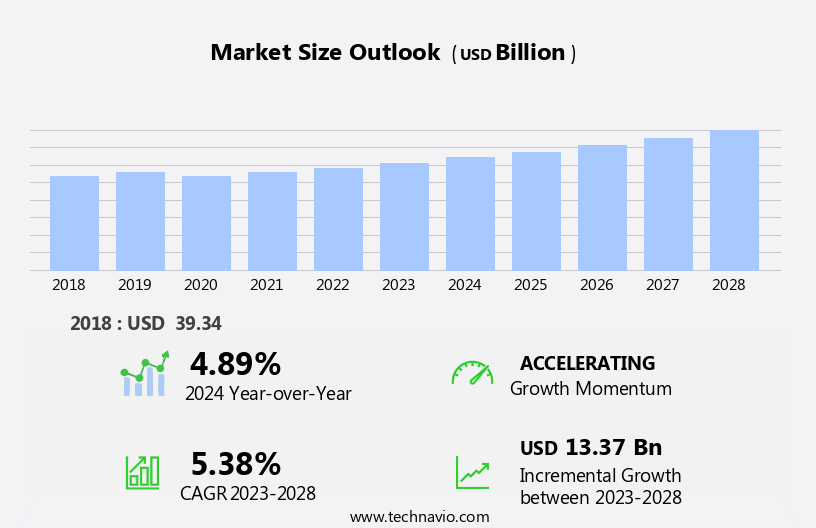
The used trucks market size is forecast to increase by USD 13.37 billion, at a CAGR of 5.38% between 2023 and 2028.

  • The market is driven by the increasing adoption of touchpoint management systems integrated with artificial intelligence. This technology enhances the buying and selling experience for both dealers and customers, streamlining processes and improving operational efficiency. Furthermore, the e-commerce industry's growth is fueling demand for used trucks to transport goods, leading to increased sales. However, the market faces a significant challenge: the lowering resale value of used trucks. This trend is attributed to the increasing availability of newer, more technologically advanced models, which may render older trucks less desirable. To capitalize on market opportunities, used truck dealers must focus on providing exceptional customer service and competitive pricing to differentiate themselves. Additionally, exploring alternative revenue streams, such as offering maintenance and repair services, can help mitigate the impact of declining resale values.
  • In navigating this landscape, strategic partnerships and collaborations with technology providers can enable dealers to stay competitive and offer value-added services to customers. Overall, the market presents both challenges and opportunities for growth, requiring dealers to adapt and innovate to meet evolving customer demands and market trends.

What will be the Size of the Used Trucks Market during the forecast period?

Used Trucks Market Size

Explore in-depth regional segment analysis with market size data - historical 2018-2022 and forecasts 2024-2028 - in the full report.  
Request Free Sample

The market continues to evolve, driven by the dynamic interplay of various factors. Auction pricing data serves as a crucial indicator of market trends, providing insights into shifting demand patterns and price fluctuations. For instance, data from a major auction house reveals a 10% increase in the average sale price of medium-duty trucks over the past year. Effective parts inventory management is another key aspect of the market, with cargo capacity calculations and vehicle history reports playing essential roles. Transmission repair costs and engine performance metrics are critical factors in determining a truck's resale value. Fuel consumption tracking and predictive maintenance models help fleet operators optimize their operational costs, while fuel efficiency ratings and drivetrain component analysis inform purchasing decisions.

Telematics device integration, GPS tracking systems, and tire condition assessment enable real-time monitoring and fleet management. GVWR compliance checks, truck diagnostic tools, and body damage assessment ensure safety and regulatory compliance. Pre-purchase truck inspections, maintenance records review, dealer certifications, and electrical system testing contribute to the overall value assessment. Heavy-duty truck parts, remote diagnostics capabilities, transport logistics optimization, emission control systems, and mileage verification systems are some of the industry's growth drivers, with expectations of a 5% annual expansion in the coming years. The market's continuous dynamism underlines the importance of staying informed and adaptive.

How is this Used Trucks Industry segmented?

The used trucks industry research report provides comprehensive data (region-wise segment analysis), with forecasts and estimates in "USD billion" for the period 2024-2028, as well as historical data from 2018-2022 for the following segments.

  • Type
    • Pickup trucks
    • Other trucks
  • Fuel Type
    • Diesel
    • Gasoline
    • Electric
  • Geography
    • North America
      • US
      • Canada
    • Europe
      • France
      • Germany
      • UK
    • Rest of World (ROW)

By Type Insights

The pickup trucks segment is estimated to witness significant growth during the forecast period.

Used pickup trucks continue to gain popularity in the US market due to their superior engine performance and cargo capacity, making them a preferred choice for buyers looking to upgrade from sedans without committing to the high cost of a new pickup. According to recent data, the average price for a new pickup truck hovers around USD 45,000. Manufacturers' focus on maintaining stringent quality standards has resulted in an increase in the reliability of used pickup trucks, which is a significant factor in their popularity in the passenger car segment. Key entities shaping this market include parts inventory management, cargo capacity calculations, vehicle history reports, transmission repair costs, engine performance metrics, fuel consumption tracking, predictive maintenance models, fuel efficiency ratings, drivetrain component analysis, suspension system inspection, fleet management software, telematics device integration, GVWR compliance checks, truck diagnostic tools, body damage assessment, payload weight limits, repair scheduling software, GPS tracking systems, tire condition assessment, pre-purchase truck inspection, operational cost analysis, brake system evaluation, safety equipment inspection, maintenance records review, dealer certifications, electrical system testing, heavy-duty truck parts, remote diagnostics capabilities, transport logistics optimization, emission control systems, and mileage verification systems.

For instance, a study on used pickup trucks revealed a sales increase of 15% in the last quarter due to the growing demand for these vehicles. Furthermore, the used pickup truck market is expected to grow by 10% annually, as businesses increasingly recognize the benefits of these vehicles for their operational needs. These trends underscore the importance of entities like fleet management software, telematics device integration, and predictive maintenance models in optimizing the performance and lifespan of used pickup trucks. One example of a reliable used pickup truck model is the 2009-2011 Cadillac Escalade EXT, which offers impressive cargo capacity and robust engine performance.

This vehicle's popularity is a testament to the enduring appeal of used pickup trucks in the US market.

Used Trucks Market Size

Request Free Sample

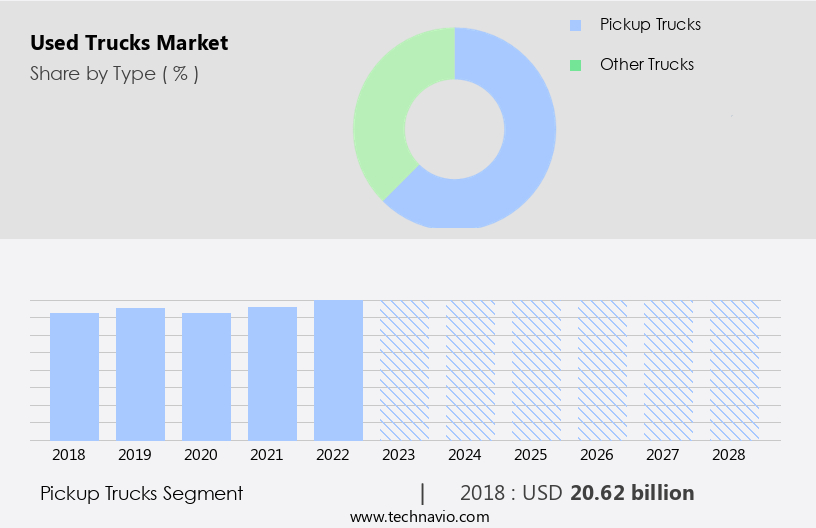
The Pickup trucks segment was valued at USD 20.62 billion in 2018 and showed a gradual increase during the forecast period.

Regional Analysis

North America is estimated to contribute 38% to the growth of the global market during the forecast period. Technavio’s analysts have elaborately explained the regional trends and drivers that shape the market during the forecast period.

Used Trucks Market Share by Geography

 Request Free Sample

The market in North America is experiencing notable activity, with light commercial vehicles and pickup trucks leading the charge. The long operational life of these vehicles is attributed to stringent manufacturing standards and the increasing importance of parts inventory management, cargo capacity calculations, and vehicle history reports. As a result, transmission repair costs and engine performance metrics are crucial factors in the resale value of these trucks. Predictive maintenance models and fuel efficiency ratings are essential for fleet management, with fleet management software and telematics device integration streamlining operations. GVWR compliance checks and truck diagnostic tools ensure safety and regulatory adherence, while body damage assessment and payload weight limits inform potential buyers during pre-purchase inspections.

Operational cost analysis, including fuel consumption tracking and maintenance records review, is vital for fleet operators. Dealership certifications and electrical system testing add to the confidence of buyers. The market for heavy-duty truck parts is growing, with remote diagnostics capabilities and transport logistics optimization enhancing efficiency. Emission control systems and mileage verification systems are becoming increasingly important in the context of industry regulations. According to recent industry reports, the market in North America is projected to grow by 5% annually, driven by the increasing demand for cost-effective transportation solutions. For instance, a major logistics company reported a 15% increase in sales of used trucks for their fleet expansion.

The integration of GPS tracking systems, tire condition assessment, brake system evaluation, and safety equipment inspection further adds value to this market.

Market Dynamics

Our researchers analyzed the data with 2023 as the base year, along with the key drivers, trends, and challenges. A holistic analysis of drivers will help companies refine their marketing strategies to gain a competitive advantage.

The market is a significant sector in the global automotive industry, catering to the demand for economical transportation solutions for businesses and individuals. As the market continues to grow, it is essential to ensure the optimal performance and safety of used trucks. This requires a comprehensive approach to assessing their condition, starting with engine diagnostics procedures and heavy-duty transmission repair techniques. Body damage assessment is another critical aspect, requiring a thorough examination to ensure integrity. Electrical system evaluation is equally important, as is the implementation of a complete pre-purchase inspection. Safety equipment compliance checklists are a must, along with optimizing transport logistics through used truck telematics device integration. Improving fuel efficiency is a key concern for used truck operators, making predictive maintenance an essential tool for fleet managers. Used truck maintenance records analysis provides valuable insights for better decision making, while comparing leasing options and calculating total cost of ownership are crucial considerations. Effective accident prevention strategies are essential for used truck fleets, with tire condition assessment best practices and suspension system inspections and repairs playing a significant role. Used truck frame damage detection methodologies are also important, as is the estimation of resale value through used truck auction pricing data analysis tools. Used truck parts inventory management strategies are vital for efficient operations, ensuring the availability of essential components for maintenance and repair. Overall, the market demands a holistic approach, encompassing all aspects of engine performance, transmission repair, body damage assessment, electrical system integrity, safety equipment compliance, logistics optimization, telematics device integration, fuel efficiency, predictive maintenance, maintenance records analysis, leasing options, total cost of ownership, accident prevention, tire condition assessment, suspension system inspection and repair, frame damage detection, and resale value estimation.

What are the key market drivers leading to the rise in the adoption of Used Trucks Industry?

  • The expanded value proposition of used trucks, which encompasses their affordability, reliability, and flexibility, serves as the primary market driver in the trucking industry. 
  • Used trucks represent an attractive market for businesses seeking cost-effective transportation solutions. The rigorous manufacturing standards and improved build quality in trucks have led to an increase in the supply of high-quality pre-owned vehicles. This trend, coupled with the continuous introduction of newer models and advanced automotive technologies, encourages truck owners to upgrade, thereby fueling the used truck market. Moreover, the resale value of used trucks is a significant consideration for buyers. According to industry reports, the global used commercial vehicle market is projected to grow by over 5% annually, driven by the increasing demand from various sectors, including construction, logistics, and transportation.
  • For instance, a study revealed that the average resale value of a three-year-old medium-duty truck increased by 35% in the last five years. These factors collectively contribute to the steady growth and demand for used trucks.

What are the market trends shaping the Used Trucks Industry?

  • Integrated touchpoint management systems with artificial intelligence are becoming the market trend. Artificial intelligence technology is increasingly being integrated into touchpoint management systems.
  • The market is witnessing a surge in demand due to the robust adoption of touchpoint management techniques. These techniques have transformed the buying process, providing a positive and rewarding experience for customers. Online retailers and electronic stores are utilizing unique touchpoint management systems to understand customer needs, while automotive dealers are enhancing customer satisfaction through improved systems. Feedback collection after the customer's interaction with online used vehicle websites is a common practice. Artificial intelligence (AI) integration with these websites offers customer support whenever required, thereby raising customer satisfaction.
  • The integration of AI programs helps customers efficiently find products, gather information, and compare prices. The market for used trucks is expected to grow significantly in the coming years, with an estimated 25% increase in demand. This growth can be attributed to the continuous integration of advanced touchpoint management techniques and AI technologies.

What challenges does the Used Trucks Industry face during its growth?

  • The used truck industry faces significant challenges in maintaining growth due to the potential for lowered resale values. This issue, which is mandatory for industry professionals to address, can significantly impact the market's overall health and profitability. 
  • The used truck market experiences fluctuating demand due to the rapid advancement of technology in the industry. Trucks manufactured between 2012 and 2015, for instance, have seen a decline in resale value as their features have become obsolete. In contrast, newer models boast advanced driver-assist systems and aerodynamic designs that offer significant operational ease and comfort. Consequently, buyers and transportation companies carefully evaluate the cost-benefit analysis before purchasing used trucks. This consideration is crucial to determine the vehicle's future market value.
  • Investing in a new truck with modern features is often a more attractive proposition, as shown by a 15% increase in sales of new trucks over the past year. The used truck market is projected to grow at a steady pace, with industry analysts anticipating a 7% expansion in the next five years.

Exclusive Customer Landscape

The used trucks market forecasting report includes the adoption lifecycle of the market, covering from the innovator’s stage to the laggard’s stage. It focuses on adoption rates in different regions based on penetration. Furthermore, the used trucks market report also includes key purchase criteria and drivers of price sensitivity to help companies evaluate and develop their market growth analysis strategies.
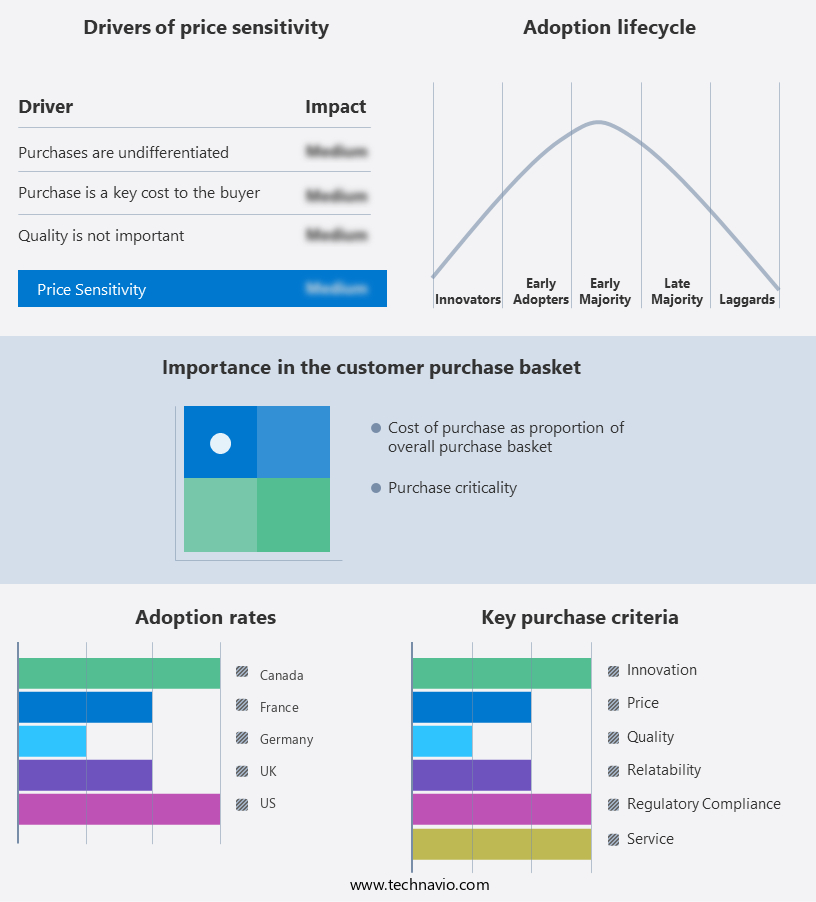
Used Trucks Market Share by Geography

 Customer Landscape

Key Companies & Market Insights

Companies are implementing various strategies, such as strategic alliances, used trucks market forecast, partnerships, mergers and acquisitions, geographical expansion, and product/service launches, to enhance their presence in the industry.

AB Volvo - The company specializes in the sale of pre-owned trucks, featuring prominent brands such as Volvo FH, Mercedes-Benz Arocs, Scania P-series, Volvo FL, Volvo FMX, and MAN TGA, among others.

The industry research and growth report includes detailed analyses of the competitive landscape of the market and information about key companies, including:

  • AB Volvo
  • Corcentric Inc.
  • Daimler Truck AG
  • EAN Services LLC
  • Iveco Group N.V
  • Knight Swift Transportation Holdings Inc.
  • PACCAR Inc.
  • Penske Corp.
  • Renault SAS
  • Ryder System Inc.
  • Scania AB
  • Tesla Inc.
  • Toyota Motor Corp.
  • TrueCar Inc.
  • Volkswagen AG

Qualitative and quantitative analysis of companies has been conducted to help clients understand the wider business environment as well as the strengths and weaknesses of key industry players. Data is qualitatively analyzed to categorize companies as pure play, category-focused, industry-focused, and diversified; it is quantitatively analyzed to categorize companies as dominant, leading, strong, tentative, and weak.

Recent Development and News in Used Trucks Market

  • In January 2024, Volvo Trucks announced the launch of its new certified pre-owned (CPO) program, "Volvo Used Trucks by Mack," expanding its presence in the market (Volvo Trucks Press Release). This initiative aimed to offer high-quality, pre-inspected, and warrantied used trucks to customers.
  • In March 2024, Navistar International Corporation and Volkswagen Truck & Bus GmbH signed a strategic collaboration agreement to develop and manufacture advanced diesel and electric powertrains for the North American market (Navistar Press Release). This partnership aimed to enhance their product offerings and strengthen their positions in the competitive market.
  • In May 2024, Paccar Inc. reported a significant increase in its used truck sales, up by 23% year-over-year, driven by strong demand and the company's focus on expanding its used truck inventory (Paccar Q1 2024 Earnings Report). This growth underscored the market's resilience and the ongoing demand for used trucks.
  • In April 2025, the European Union announced the approval of new emission regulations for used trucks, requiring them to meet Euro 6 standards by 2027 (European Commission Press Release). This policy change created a new opportunity for companies to invest in retrofitting older trucks or replacing them with newer, compliant models, potentially boosting demand in the market.

Research Analyst Overview

  • The market continues to evolve, with various sectors relying on these versatile vehicles for their unique applications. Undercarriage inspection, insurance value assessment, and maintenance contract options are crucial considerations for fleet managers in the transportation sector. In the refrigerated transport industry, refrigeration unit testing, cargo securing systems, hydraulic liftgate maintenance, and electrical wiring harness inspections are essential. Depreciation calculations, truck bed condition, and leasing options analysis are vital for construction companies. Moreover, safety features such as anti-lock braking systems, wheel alignment systems, exhaust system inspection, frame damage detection, and differential gear ratios play a significant role in the decision-making process for buyers in the market.
  • Financing terms comparison, driver behavior monitoring, axle weight distribution, winch operation, cab condition assessment, warranty coverage details, accident prevention strategies, powertrain components, and vehicle tracking technology are other essential factors influencing market dynamics. According to industry reports, the market is expected to grow by over 15% in the next five years, driven by the increasing demand for cost-effective transportation solutions and the growing preference for used trucks in various sectors.

Dive into Technavio’s robust research methodology, blending expert interviews, extensive data synthesis, and validated models for unparalleled Used Trucks Market insights. See full methodology.

Market Scope

Report Coverage

Details

Page number

172

Base year

2023

Historic period

2018-2022

Forecast period

2024-2028

Growth momentum & CAGR

Accelerate at a CAGR of 5.38%

Market growth 2024-2028

USD 13.37 billion

Market structure

Concentrated

YoY growth 2023-2024(%)

4.89

Key countries

US, Canada, UK, Germany, and France

Competitive landscape

Leading Companies, Market Positioning of Companies, Competitive Strategies, and Industry Risks

Request Free Sample

What are the Key Data Covered in this Used Trucks Market Research and Growth Report?

  • CAGR of the Used Trucks industry during the forecast period
  • Detailed information on factors that will drive the growth and forecasting between 2024 and 2028
  • Precise estimation of the size of the market and its contribution of the industry in focus to the parent market
  • Accurate predictions about upcoming growth and trends and changes in consumer behaviour
  • Growth of the market across North America, Europe, APAC, South America, and Middle East and Africa
  • Thorough analysis of the market’s competitive landscape and detailed information about companies
  • Comprehensive analysis of factors that will challenge the used trucks market growth of industry companies

We can help! Our analysts can customize this used trucks market research report to meet your requirements.

Get in touch

1 Executive Summary

  • 1.1 Market overview
    • Exhibit 01: Executive Summary – Chart on Market Overview
    • Exhibit 02: Executive Summary – Data Table on Market Overview
    • Exhibit 03: Executive Summary – Chart on Global Market Characteristics
    • Exhibit 04: Executive Summary – Chart on Market by Geography
    • Exhibit 05: Executive Summary – Chart on Market Segmentation by Type
    • Exhibit 06: Executive Summary – Chart on Market Segmentation by Fuel Type
    • Exhibit 07: Executive Summary – Chart on Incremental Growth
    • Exhibit 08: Executive Summary – Data Table on Incremental Growth
    • Exhibit 09: Executive Summary – Chart on Vendor Market Positioning

2 Market Landscape

  • 2.1 Market ecosystem
    • Exhibit 10: Parent market
    • Exhibit 11: Market Characteristics

3 Market Sizing

  • 3.1 Market definition
    • Exhibit 12: Offerings of vendors included in the market definition
  • 3.2 Market segment analysis
    • Exhibit 13: Market segments
  • 3.3 Market size 2023
    • 3.4 Market outlook: Forecast for 2023-2028
      • Exhibit 14: Chart on Global - Market size and forecast 2023-2028 ($ billion)
      • Exhibit 15: Data Table on Global - Market size and forecast 2023-2028 ($ billion)
      • Exhibit 16: Chart on Global Market: Year-over-year growth 2023-2028 (%)
      • Exhibit 17: Data Table on Global Market: Year-over-year growth 2023-2028 (%)

    4 Historic Market Size

    • 4.1 Global used trucks market 2018 - 2022
      • Exhibit 18: Historic Market Size – Data Table on global used trucks market 2018 - 2022 ($ billion)
    • 4.2 Type Segment Analysis 2018 - 2022
      • Exhibit 19: Historic Market Size – Type Segment 2018 - 2022 ($ billion)
    • 4.3 Fuel type Segment Analysis 2018 - 2022
      • Exhibit 20: Historic Market Size – Fuel type Segment 2018 - 2022 ($ billion)
    • 4.4 Geography Segment Analysis 2018 - 2022
      • Exhibit 21: Historic Market Size – Geography Segment 2018 - 2022 ($ billion)
    • 4.5 Country Segment Analysis 2018 - 2022
      • Exhibit 22: Historic Market Size – Country Segment 2018 - 2022 ($ billion)

    5 Five Forces Analysis

    • 5.1 Five forces summary
      • Exhibit 23: Five forces analysis - Comparison between 2023 and 2028
    • 5.2 Bargaining power of buyers
      • Exhibit 24: Chart on Bargaining power of buyers – Impact of key factors 2023 and 2028
    • 5.3 Bargaining power of suppliers
      • Exhibit 25: Bargaining power of suppliers – Impact of key factors in 2023 and 2028
    • 5.4 Threat of new entrants
      • Exhibit 26: Threat of new entrants – Impact of key factors in 2023 and 2028
    • 5.5 Threat of substitutes
      • Exhibit 27: Threat of substitutes – Impact of key factors in 2023 and 2028
    • 5.6 Threat of rivalry
      • Exhibit 28: Threat of rivalry – Impact of key factors in 2023 and 2028
    • 5.7 Market condition
      • Exhibit 29: Chart on Market condition - Five forces 2023 and 2028

    6 Market Segmentation by Type

    • 6.1 Market segments
      • Exhibit 30: Chart on Type - Market share 2023-2028 (%)
      • Exhibit 31: Data Table on Type - Market share 2023-2028 (%)
    • 6.2 Comparison by Type
      • Exhibit 32: Chart on Comparison by Type
      • Exhibit 33: Data Table on Comparison by Type
    • 6.3 Pickup trucks - Market size and forecast 2023-2028
      • Exhibit 34: Chart on Pickup trucks - Market size and forecast 2023-2028 ($ billion)
      • Exhibit 35: Data Table on Pickup trucks - Market size and forecast 2023-2028 ($ billion)
      • Exhibit 36: Chart on Pickup trucks - Year-over-year growth 2023-2028 (%)
      • Exhibit 37: Data Table on Pickup trucks - Year-over-year growth 2023-2028 (%)
    • 6.4 Other trucks - Market size and forecast 2023-2028
      • Exhibit 38: Chart on Other trucks - Market size and forecast 2023-2028 ($ billion)
      • Exhibit 39: Data Table on Other trucks - Market size and forecast 2023-2028 ($ billion)
      • Exhibit 40: Chart on Other trucks - Year-over-year growth 2023-2028 (%)
      • Exhibit 41: Data Table on Other trucks - Year-over-year growth 2023-2028 (%)
    • 6.5 Market opportunity by Type
      • Exhibit 42: Market opportunity by Type ($ billion)
      • Exhibit 43: Data Table on Market opportunity by Type ($ billion)

    7 Market Segmentation by Fuel Type

    • 7.1 Market segments
      • Exhibit 44: Chart on Fuel Type - Market share 2023-2028 (%)
      • Exhibit 45: Data Table on Fuel Type - Market share 2023-2028 (%)
    • 7.2 Comparison by Fuel Type
      • Exhibit 46: Chart on Comparison by Fuel Type
      • Exhibit 47: Data Table on Comparison by Fuel Type
    • 7.3 Diesel - Market size and forecast 2023-2028
      • Exhibit 48: Chart on Diesel - Market size and forecast 2023-2028 ($ billion)
      • Exhibit 49: Data Table on Diesel - Market size and forecast 2023-2028 ($ billion)
      • Exhibit 50: Chart on Diesel - Year-over-year growth 2023-2028 (%)
      • Exhibit 51: Data Table on Diesel - Year-over-year growth 2023-2028 (%)
    • 7.4 Gasoline - Market size and forecast 2023-2028
      • Exhibit 52: Chart on Gasoline - Market size and forecast 2023-2028 ($ billion)
      • Exhibit 53: Data Table on Gasoline - Market size and forecast 2023-2028 ($ billion)
      • Exhibit 54: Chart on Gasoline - Year-over-year growth 2023-2028 (%)
      • Exhibit 55: Data Table on Gasoline - Year-over-year growth 2023-2028 (%)
    • 7.5 Electric - Market size and forecast 2023-2028
      • Exhibit 56: Chart on Electric - Market size and forecast 2023-2028 ($ billion)
      • Exhibit 57: Data Table on Electric - Market size and forecast 2023-2028 ($ billion)
      • Exhibit 58: Chart on Electric - Year-over-year growth 2023-2028 (%)
      • Exhibit 59: Data Table on Electric - Year-over-year growth 2023-2028 (%)
    • 7.6 Market opportunity by Fuel Type
      • Exhibit 60: Market opportunity by Fuel Type ($ billion)
      • Exhibit 61: Data Table on Market opportunity by Fuel Type ($ billion)

    8 Customer Landscape

    • 8.1 Customer landscape overview
      • Exhibit 62: Analysis of price sensitivity, lifecycle, customer purchase basket, adoption rates, and purchase criteria

    9 Geographic Landscape

    • 9.1 Geographic segmentation
      • Exhibit 63: Chart on Market share by geography 2023-2028 (%)
      • Exhibit 64: Data Table on Market share by geography 2023-2028 (%)
    • 9.2 Geographic comparison
      • Exhibit 65: Chart on Geographic comparison
      • Exhibit 66: Data Table on Geographic comparison
    • 9.3 North America - Market size and forecast 2023-2028
      • Exhibit 67: Chart on North America - Market size and forecast 2023-2028 ($ billion)
      • Exhibit 68: Data Table on North America - Market size and forecast 2023-2028 ($ billion)
      • Exhibit 69: Chart on North America - Year-over-year growth 2023-2028 (%)
      • Exhibit 70: Data Table on North America - Year-over-year growth 2023-2028 (%)
    • 9.4 Europe - Market size and forecast 2023-2028
      • Exhibit 71: Chart on Europe - Market size and forecast 2023-2028 ($ billion)
      • Exhibit 72: Data Table on Europe - Market size and forecast 2023-2028 ($ billion)
      • Exhibit 73: Chart on Europe - Year-over-year growth 2023-2028 (%)
      • Exhibit 74: Data Table on Europe - Year-over-year growth 2023-2028 (%)
    • 9.5 APAC - Market size and forecast 2023-2028
      • Exhibit 75: Chart on APAC - Market size and forecast 2023-2028 ($ billion)
      • Exhibit 76: Data Table on APAC - Market size and forecast 2023-2028 ($ billion)
      • Exhibit 77: Chart on APAC - Year-over-year growth 2023-2028 (%)
      • Exhibit 78: Data Table on APAC - Year-over-year growth 2023-2028 (%)
    • 9.6 South America - Market size and forecast 2023-2028
      • Exhibit 79: Chart on South America - Market size and forecast 2023-2028 ($ billion)
      • Exhibit 80: Data Table on South America - Market size and forecast 2023-2028 ($ billion)
      • Exhibit 81: Chart on South America - Year-over-year growth 2023-2028 (%)
      • Exhibit 82: Data Table on South America - Year-over-year growth 2023-2028 (%)
    • 9.7 Middle East and Africa - Market size and forecast 2023-2028
      • Exhibit 83: Chart on Middle East and Africa - Market size and forecast 2023-2028 ($ billion)
      • Exhibit 84: Data Table on Middle East and Africa - Market size and forecast 2023-2028 ($ billion)
      • Exhibit 85: Chart on Middle East and Africa - Year-over-year growth 2023-2028 (%)
      • Exhibit 86: Data Table on Middle East and Africa - Year-over-year growth 2023-2028 (%)
    • 9.8 US - Market size and forecast 2023-2028
      • Exhibit 87: Chart on US - Market size and forecast 2023-2028 ($ billion)
      • Exhibit 88: Data Table on US - Market size and forecast 2023-2028 ($ billion)
      • Exhibit 89: Chart on US - Year-over-year growth 2023-2028 (%)
      • Exhibit 90: Data Table on US - Year-over-year growth 2023-2028 (%)
    • 9.9 UK - Market size and forecast 2023-2028
      • Exhibit 91: Chart on UK - Market size and forecast 2023-2028 ($ billion)
      • Exhibit 92: Data Table on UK - Market size and forecast 2023-2028 ($ billion)
      • Exhibit 93: Chart on UK - Year-over-year growth 2023-2028 (%)
      • Exhibit 94: Data Table on UK - Year-over-year growth 2023-2028 (%)
    • 9.10 Germany - Market size and forecast 2023-2028
      • Exhibit 95: Chart on Germany - Market size and forecast 2023-2028 ($ billion)
      • Exhibit 96: Data Table on Germany - Market size and forecast 2023-2028 ($ billion)
      • Exhibit 97: Chart on Germany - Year-over-year growth 2023-2028 (%)
      • Exhibit 98: Data Table on Germany - Year-over-year growth 2023-2028 (%)
    • 9.11 Canada - Market size and forecast 2023-2028
      • Exhibit 99: Chart on Canada - Market size and forecast 2023-2028 ($ billion)
      • Exhibit 100: Data Table on Canada - Market size and forecast 2023-2028 ($ billion)
      • Exhibit 101: Chart on Canada - Year-over-year growth 2023-2028 (%)
      • Exhibit 102: Data Table on Canada - Year-over-year growth 2023-2028 (%)
    • 9.12 France - Market size and forecast 2023-2028
      • Exhibit 103: Chart on France - Market size and forecast 2023-2028 ($ billion)
      • Exhibit 104: Data Table on France - Market size and forecast 2023-2028 ($ billion)
      • Exhibit 105: Chart on France - Year-over-year growth 2023-2028 (%)
      • Exhibit 106: Data Table on France - Year-over-year growth 2023-2028 (%)
    • 9.13 Market opportunity by geography
      • Exhibit 107: Market opportunity by geography ($ billion)
      • Exhibit 108: Data Tables on Market opportunity by geography ($ billion)

    10 Drivers, Challenges, and Trends

    • 10.1 Market drivers
      • 10.2 Market challenges
        • 10.3 Impact of drivers and challenges
          • Exhibit 109: Impact of drivers and challenges in 2023 and 2028
        • 10.4 Market trends

          11 Vendor Landscape

          • 11.1 Overview
            • 11.2 Vendor landscape
              • Exhibit 110: Overview on Criticality of inputs and Factors of differentiation
            • 11.3 Landscape disruption
              • Exhibit 111: Overview on factors of disruption
            • 11.4 Industry risks
              • Exhibit 112: Impact of key risks on business

            12 Vendor Analysis

            • 12.1 Vendors covered
              • Exhibit 113: Vendors covered
            • 12.2 Market positioning of vendors
              • Exhibit 114: Matrix on vendor position and classification
            • 12.3 AB Volvo
              • Exhibit 115: AB Volvo - Overview
              • Exhibit 116: AB Volvo - Business segments
              • Exhibit 117: AB Volvo - Key news
              • Exhibit 118: AB Volvo - Key offerings
              • Exhibit 119: AB Volvo - Segment focus
            • 12.4 Corcentric Inc.
              • Exhibit 120: Corcentric Inc. - Overview
              • Exhibit 121: Corcentric Inc. - Product / Service
              • Exhibit 122: Corcentric Inc. - Key offerings
            • 12.5 Daimler Truck AG
              • Exhibit 123: Daimler Truck AG - Overview
              • Exhibit 124: Daimler Truck AG - Business segments
              • Exhibit 125: Daimler Truck AG - Key offerings
              • Exhibit 126: Daimler Truck AG - Segment focus
            • 12.6 EAN Services LLC
              • Exhibit 127: EAN Services LLC - Overview
              • Exhibit 128: EAN Services LLC - Product / Service
              • Exhibit 129: EAN Services LLC - Key offerings
            • 12.7 Iveco Group N.V
              • Exhibit 130: Iveco Group N.V - Overview
              • Exhibit 131: Iveco Group N.V - Business segments
              • Exhibit 132: Iveco Group N.V - Key offerings
              • Exhibit 133: Iveco Group N.V - Segment focus
            • 12.8 Knight Swift Transportation Holdings Inc.
              • Exhibit 134: Knight Swift Transportation Holdings Inc. - Overview
              • Exhibit 135: Knight Swift Transportation Holdings Inc. - Business segments
              • Exhibit 136: Knight Swift Transportation Holdings Inc. - Key offerings
              • Exhibit 137: Knight Swift Transportation Holdings Inc. - Segment focus
            • 12.9 PACCAR Inc.
              • Exhibit 138: PACCAR Inc. - Overview
              • Exhibit 139: PACCAR Inc. - Business segments
              • Exhibit 140: PACCAR Inc. - Key news
              • Exhibit 141: PACCAR Inc. - Key offerings
              • Exhibit 142: PACCAR Inc. - Segment focus
            • 12.10 Penske Corp.
              • Exhibit 143: Penske Corp. - Overview
              • Exhibit 144: Penske Corp. - Product / Service
              • Exhibit 145: Penske Corp. - Key offerings
            • 12.11 Renault SAS
              • Exhibit 146: Renault SAS - Overview
              • Exhibit 147: Renault SAS - Product / Service
              • Exhibit 148: Renault SAS - Key offerings
            • 12.12 Ryder System Inc.
              • Exhibit 149: Ryder System Inc. - Overview
              • Exhibit 150: Ryder System Inc. - Business segments
              • Exhibit 151: Ryder System Inc. - Key news
              • Exhibit 152: Ryder System Inc. - Key offerings
              • Exhibit 153: Ryder System Inc. - Segment focus
            • 12.13 Scania AB
              • Exhibit 154: Scania AB - Overview
              • Exhibit 155: Scania AB - Business segments
              • Exhibit 156: Scania AB - Key offerings
              • Exhibit 157: Scania AB - Segment focus
            • 12.14 Tesla Inc.
              • Exhibit 158: Tesla Inc. - Overview
              • Exhibit 159: Tesla Inc. - Business segments
              • Exhibit 160: Tesla Inc. - Key news
              • Exhibit 161: Tesla Inc. - Key offerings
              • Exhibit 162: Tesla Inc. - Segment focus
            • 12.15 Toyota Motor Corp.
              • Exhibit 163: Toyota Motor Corp. - Overview
              • Exhibit 164: Toyota Motor Corp. - Business segments
              • Exhibit 165: Toyota Motor Corp. - Key offerings
              • Exhibit 166: Toyota Motor Corp. - Segment focus
            • 12.16 TrueCar Inc.
              • Exhibit 167: TrueCar Inc. - Overview
              • Exhibit 168: TrueCar Inc. - Product / Service
              • Exhibit 169: TrueCar Inc. - Key news
              • Exhibit 170: TrueCar Inc. - Key offerings
            • 12.17 Volkswagen AG
              • Exhibit 171: Volkswagen AG - Overview
              • Exhibit 172: Volkswagen AG - Business segments
              • Exhibit 173: Volkswagen AG - Key offerings
              • Exhibit 174: Volkswagen AG - Segment focus

            13 Appendix

            • 13.1 Scope of the report
              • 13.2 Inclusions and exclusions checklist
                • Exhibit 175: Inclusions checklist
                • Exhibit 176: Exclusions checklist
              • 13.3 Currency conversion rates for US$
                • Exhibit 177: Currency conversion rates for US$
              • 13.4 Research methodology
                • Exhibit 178: Research methodology
                • Exhibit 179: Validation techniques employed for market sizing
                • Exhibit 180: Information sources
              • 13.5 List of abbreviations
                • Exhibit 181: List of abbreviations

              Research Methodology

              Technavio presents a detailed picture of the market by way of study, synthesis, and summation of data from multiple sources. The analysts have presented the various facets of the market with a particular focus on identifying the key industry influencers. The data thus presented is comprehensive, reliable, and the result of extensive research, both primary and secondary.

              INFORMATION SOURCES

              Primary sources

              • Manufacturers and suppliers
              • Channel partners
              • Industry experts
              • Strategic decision makers

              Secondary sources

              • Industry journals and periodicals
              • Government data
              • Financial reports of key industry players
              • Historical data
              • Press releases

              DATA ANALYSIS

              Data Synthesis

              • Collation of data
              • Estimation of key figures
              • Analysis of derived insights

              Data Validation

              • Triangulation with data models
              • Reference against proprietary databases
              • Corroboration with industry experts

              REPORT WRITING

              Qualitative

              • Market drivers
              • Market challenges
              • Market trends
              • Five forces analysis

              Quantitative

              • Market size and forecast
              • Market segmentation
              • Geographical insights
              • Competitive landscape

              Interested in this report?

              Get your sample now to see our research methodology and insights!

              Download Now

              Frequently Asked Questions

              Used Trucks market growth will increase by $ 13.37 bn during 2024-2028.

              The Used Trucks market is expected to grow at a CAGR of 5.38% during 2024-2028.

              Used Trucks market is segmented by Type( Pickup trucks, Other trucks) Fuel Type( Diesel, Gasoline, Electric, South America, MEA)

              AB Volvo, Corcentric Inc., Daimler Truck AG, EAN Services LLC, Iveco Group N.V, Knight Swift Transportation Holdings Inc., PACCAR Inc., Penske Corp., Renault SAS, Ryder System Inc., Scania AB, Tesla Inc., Toyota Motor Corp., TrueCar Inc., Volkswagen AG are a few of the key vendors in the Used Trucks market.

              North America will register the highest growth rate of 38% among the other regions. Therefore, the Used Trucks market in North America is expected to garner significant business opportunities for the vendors during the forecast period.

              US, Canada, UK, Germany, France

              • Expanded value proposition of used trucksBuying a used truck involves significantly lower investments than purchasing a new vehicle. Adherence to stringent manufacturing regulations and quality standards has ensured enhanced build quality in trucks. The influx of newer models and automotive technology advancements is driving truck owners to sell existing vehicles and buy upgraded models. This buying cycle among consumers has led to a steady increase in the supply of used trucks. Reduced prices of used trucks and their increased operational quality are expected to boost the demand from various customer segments during the forecast period.  Truck buyers take a keen interest in the scope of the resale value of their vehicles. This prompts them to install various aftermarket fitments to raise the intrinsic value of vehicles. For instance is the driving factor this market.
              • owners are known to retrofit their vehicles with air deflectors and side extenders to ramp up resale values. Thus is the driving factor this market.
              • the expanded value proposition of used trucks will drive the growth of the global used trucks market during the forecast period. is the driving factor this market.

              The Used Trucks market vendors should focus on grabbing business opportunities from the Pickup trucks segment as it accounted for the largest market share in the base year.
              RIA - Research AI Assistant
              Ask RIA