Uterine Fibroid (UF) Treatment Device Market Size 2025-2029
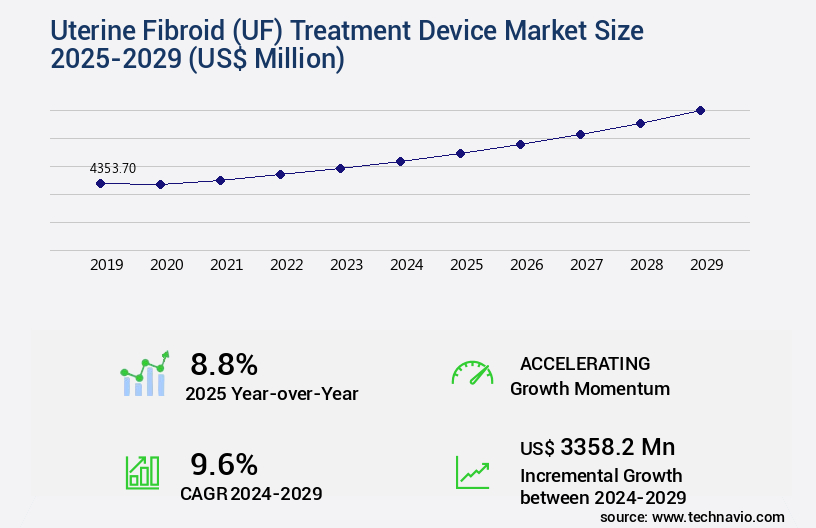
The uterine fibroid (uf) treatment device market size is valued to increase USD 3.36 billion, at a CAGR of 9.6% from 2024 to 2029. Increasing prevalence of uterine fibroids will drive the uterine fibroid (uf) treatment device market.
Major Market Trends & Insights
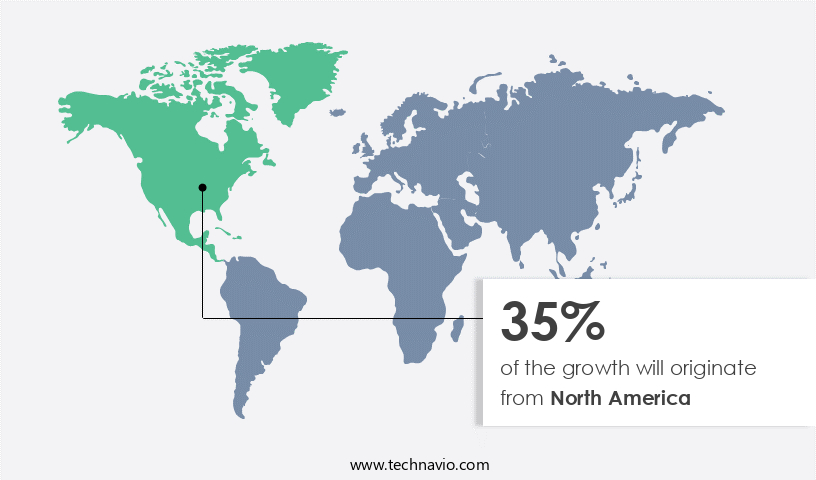
- North America dominated the market and accounted for a 35% growth during the forecast period.
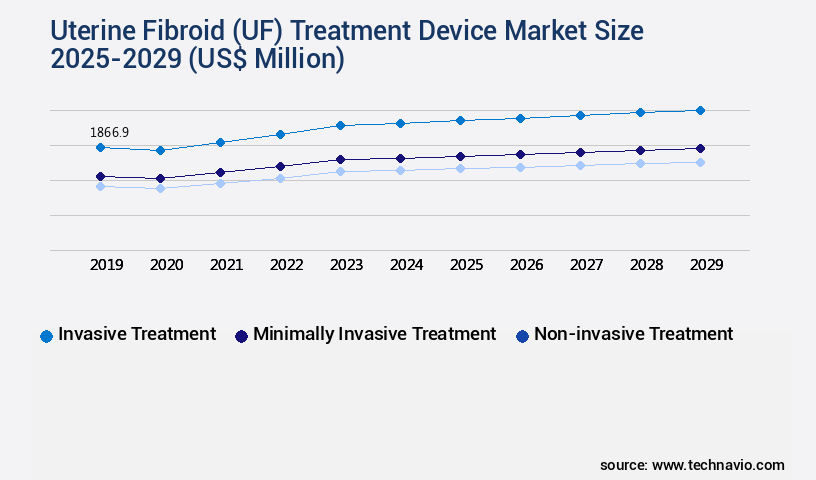
- By Therapeutic Area - Invasive treatment segment was valued at USD 1.87 billion in 2023
- By Technology - Surgical techniques segment accounted for the largest market revenue share in 2023
Market Size & Forecast
- Market Opportunities: USD 109.59 million
- Market Future Opportunities: USD 3358.20 million
- CAGR : 9.6%
- North America: Largest market in 2023
Market Summary
- The market encompasses a range of technologies and applications aimed at addressing the growing prevalence of uterine fibroids. With an estimated 70-80% of women experiencing fibroids by the age of 50, the demand for effective treatment solutions continues to escalate. The market is marked by ongoing innovation, as core technologies such as magnetic resonance-guided focused ultrasound and uterine artery embolization gain traction. Service types, including minimally invasive surgeries and medical therapies, are increasingly preferred due to their lower risk profiles and faster recovery times. However, the high cost of treatment remains a significant challenge, particularly in emerging economies where healthcare systems are still developing.
- Despite these hurdles, the market is poised for continued growth, driven by advancements in technology and increasing awareness of available treatment options. For instance, according to a study published in the Journal of Minimally Invasive Gynecology, the adoption rate of minimally invasive hysterectomy for fibroid removal increased from 17% in 2007 to 54% in 2014.
What will be the Size of the Uterine Fibroid (UF) Treatment Device Market during the forecast period?
Get Key Insights on Market Forecast (PDF) Request Free Sample
How is the Uterine Fibroid (UF) Treatment Device Market Segmented and what are the key trends of market segmentation?
The uterine fibroid (uf) treatment device industry research report provides comprehensive data (region-wise segment analysis), with forecasts and estimates in "USD million" for the period 2025-2029, as well as historical data from 2019-2023 for the following segments.
- Therapeutic Area
- Invasive treatment
- Minimally invasive treatment
- Non-invasive treatment
- Technology
- Surgical techniques
- Laparoscopic techniques
- Ablation techniques
- Embolization techniques
- End-user
- Hospitals
- Ambulatory surgical centers
- Specialized clinics
- Geography
- North America
- US
- Canada
- Mexico
- Europe
- France
- Germany
- Italy
- UK
- APAC
- China
- India
- Japan
- Rest of World (ROW)
- North America
By Therapeutic Area Insights
The invasive treatment segment is estimated to witness significant growth during the forecast period.
The global market for Uterine Fibroid (UF) treatment devices encompasses various invasive and non-invasive methods to address fibroid-related symptoms. The invasive treatment segment dominates the market due to its proven efficacy and long-term outcomes. Hysterectomy and myomectomy are popular invasive procedures, with hysterectomy being the most common choice for women seeking fibroid removal. Myomectomy, another invasive procedure, involves the surgical removal of fibroids while preserving the uterus. This method is increasingly preferred due to its lower risk of complications compared to hysterectomy. Uterine fibroid embolization, a minimally invasive procedure, is another alternative, which involves blocking the blood supply to the fibroids, leading to their shrinkage and eventual death.
Fibroid recurrence rates vary depending on the treatment method. For instance, hysterectomy offers a permanent solution, while fibroid recurrence is a possibility with myomectomy and uterine fibroid embolization. Energy delivery systems, such as ultrasound and radiofrequency ablation, are used in minimally invasive procedures to reduce fibroid size. Surgical morcellation, a technique used in laparoscopic myomectomy, has faced controversy due to potential risks of spreading cancerous tissue. Device safety profiles and complication risk factors are crucial considerations for patients and healthcare providers when selecting UF treatment methods. Robotic surgery systems and myomectomy techniques have gained popularity due to their precision and minimally invasive nature.
Surgical planning tools and treatment planning software assist healthcare providers in assessing fibroid characterization, lesion visualization, and procedure duration times. Uterine artery occlusion and thermal ablation methods are used in fibroid detection and treatment. High-intensity focused ultrasound, magnetic resonance imaging, and image-guided surgery are essential diagnostic tools in UF treatment. Patient recovery time, preoperative assessment, and patient selection criteria are critical factors influencing the choice of UF treatment methods. Cryoablation technology, a relatively new addition to the UF treatment landscape, offers potential advantages in terms of efficacy and minimal invasiveness. Symptom improvement rates and postoperative complications are essential indicators of treatment outcome prediction.
In the future, the UF treatment device market is expected to grow significantly, with increasing awareness and advancements in minimally invasive procedures. The adoption of focused ultrasound surgery, a non-invasive treatment method, is expected to increase due to its potential advantages in terms of safety, efficacy, and patient convenience. The market's continuous evolution reflects the ongoing efforts to improve treatment outcomes and patient experiences.
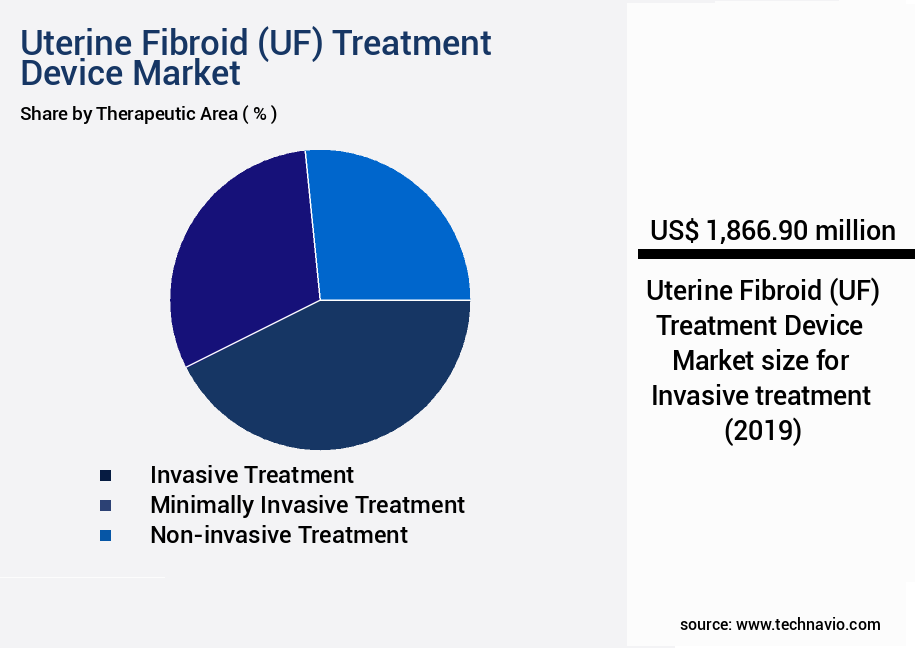
The Invasive treatment segment was valued at USD 1.87 billion in 2019 and showed a gradual increase during the forecast period.
Regional Analysis
North America is estimated to contribute 35% to the growth of the global market during the forecast period.Technavio's analysts have elaborately explained the regional trends and drivers that shape the market during the forecast period.
See How Uterine Fibroid (UF) Treatment Device Market Demand is Rising in North America Request Free Sample
The market in North America has experienced consistent expansion in recent years. Major contributors to this growth include Canada, Mexico, and the US. Factors driving this development include the high prevalence of UFs among women in the region. Approximately 80% of American women will develop UFs during their lifetime. Additionally, the increasing adoption of minimally invasive and non-invasive treatment methods is propelling market growth.
These advancements offer several benefits, such as reduced recovery time and fewer complications compared to traditional surgical procedures. As a result, the UF treatment device market in North America is poised for continued expansion, providing significant opportunities for industry players.
Market Dynamics
Our researchers analyzed the data with 2024 as the base year, along with the key drivers, trends, and challenges. A holistic analysis of drivers will help companies refine their marketing strategies to gain a competitive advantage.
Advancements in uterine fibroid treatment technology have significantly improved patient outcomes, with procedures like uterine fibroid embolization success rates showing promising results. High intensity focused ultrasound safety profile and focused ultrasound ablation complications are continuously evaluated to enhance procedural safety. Radiofrequency ablation for uterine fibroids side effects and cryoablation uterine fibroids effectiveness data help guide treatment decisions. Careful patient selection criteria and preoperative risk stratification for myomectomy are essential for optimal results, while postoperative pain management protocols improve recovery. Fibroid surgery outcomes are now assessed using uterine fibroid ablation treatment response assessment parameters, ensuring better monitoring. These developments position fibroids for Uterine Fibroid (UF) Treatment Device Market as a key area of growth and innovation.
The market is witnessing significant advancements due to the increasing prevalence of uterine fibroids and the growing demand for minimally invasive procedures. Uterine fibroids, which affect approximately 70-80% of women during their reproductive years, can lead to various symptoms such as heavy menstrual bleeding, pelvic pressure, and pain. Several treatment options are available for UFs, including uterine fibroid embolization (UFE), focused ultrasound ablation, minimally invasive myomectomy, laparoscopic uterine fibroid removal, MRI-guided focused ultrasound fibroid treatment, robotic assisted myomectomy, high intensity focused ultrasound, radiofrequency ablation for uterine fibroids, and cryoablation. Each method presents unique advantages and challenges.
For instance, UFE boasts high success rates, with over 90% of patients experiencing significant symptom relief. However, complications such as pain, infection, and allergic reactions can occur. Focused ultrasound ablation, on the other hand, offers a non-invasive approach with fewer complications but may require multiple sessions for optimal results. Minimally invasive myomectomy recovery time is typically shorter than traditional open surgery, while laparoscopic uterine fibroid removal techniques allow for precise excision of fibroids. MRI-guided focused ultrasound fibroid treatment and high intensity focused ultrasound offer targeted, non-invasive alternatives, although safety profiles and efficacy data vary. Robotic assisted myomectomy advantages include enhanced precision and reduced blood loss, making it a popular choice among surgeons.
However, the procedure's high cost and longer operative time are significant considerations. Comparatively, the adoption rates of MRI-guided focused ultrasound fibroid treatment are significantly lower than those of UFE and laparoscopic myomectomy. This disparity can be attributed to the former's higher cost and limited availability. In conclusion, the UF treatment device market is characterized by ongoing technological advancements, evolving patient selection criteria, and a growing emphasis on preoperative risk stratification, postoperative pain management protocols, and surgical morcellation risk mitigation strategies. As treatment options expand, understanding the unique benefits and challenges of each method becomes increasingly important for both patients and healthcare providers.
What are the key market drivers leading to the rise in the adoption of Uterine Fibroid (UF) Treatment Device Industry?
- The rising incidence of uterine fibroids serves as the primary market driver. (Within the context of this discussion, the increasing prevalence of uterine fibroids is the major factor fueling market growth.)
- The utilization of Ultra-Fine (UF) treatment devices is experiencing substantial influence on the global UF treatment device market. UFs, or leiomyomas, are the most prevalent benign tumors among women of reproductive age, affecting approximately 68.6% of the global female population. The incidence and prevalence of UFs have experienced a significant increase, with a 67.07% rise in cases and a 78.82% increase in prevalence from 1990 to 2023. This upward trend in cases is fueling the demand for efficient treatment methods, as an increasing number of women opt for medical intervention to alleviate symptoms such as excessive menstrual bleeding, pelvic pain, and reproductive concerns.
- The market for UF treatment devices is undergoing rapid expansion, with a projected growth rate of approximately 9%. This expansion is driven by the continuous rise in UF cases, the development of advanced treatment technologies, and the increasing awareness and acceptance of medical interventions for UF management.
What are the market trends shaping the Uterine Fibroid (UF) Treatment Device Industry?
- In emerging economies, there is a growing trend towards enhancing healthcare systems. This is a significant market development.
- In the dynamic landscape of healthcare, emerging markets exhibit significant shifts. Factors such as population expansion, an aging population, and a burgeoning middle class, coupled with rising disposable income and enhanced healthcare infrastructure, are driving transformative change. Countries like Brazil, Russia, India, China, and Mexico represent substantial opportunities for healthcare products and services, including medical devices. These economies, accounting for over half of the global GDP, represent significant underserved markets.
- The BRICS nations, as some of the world's fastest-growing economies, will experience population growth, leading to increased demand for medical devices, including UF treatment devices, throughout the forecast period.
What challenges does the Uterine Fibroid (UF) Treatment Device Industry face during its growth?
- The escalating costs associated with the treatment of uterine fibroids poses a significant challenge to the growth of the industry.
- The global ultrafiltration (UF) treatment device market faces a challenge due to the high cost associated with these devices and their procedures. This financial burden can hinder demand, particularly for patients without insurance coverage. For instance, the cost of hysterectomy ranges between USD9,661 and USD22,534, while laparoscopic myomectomy costs from USD8,062 to USD11,432 in the US. The substantial investment required for these devices can limit their availability and adoption, restricting healthcare providers and hospitals from incorporating these technologies into their offerings.
- Despite these challenges, the UF treatment device market continues to evolve, with advancements in technology driving innovation and potential cost savings. For example, the development of reusable UF devices and the integration of automation in UF treatment processes may help reduce costs and increase accessibility.
Exclusive Technavio Analysis on Customer Landscape
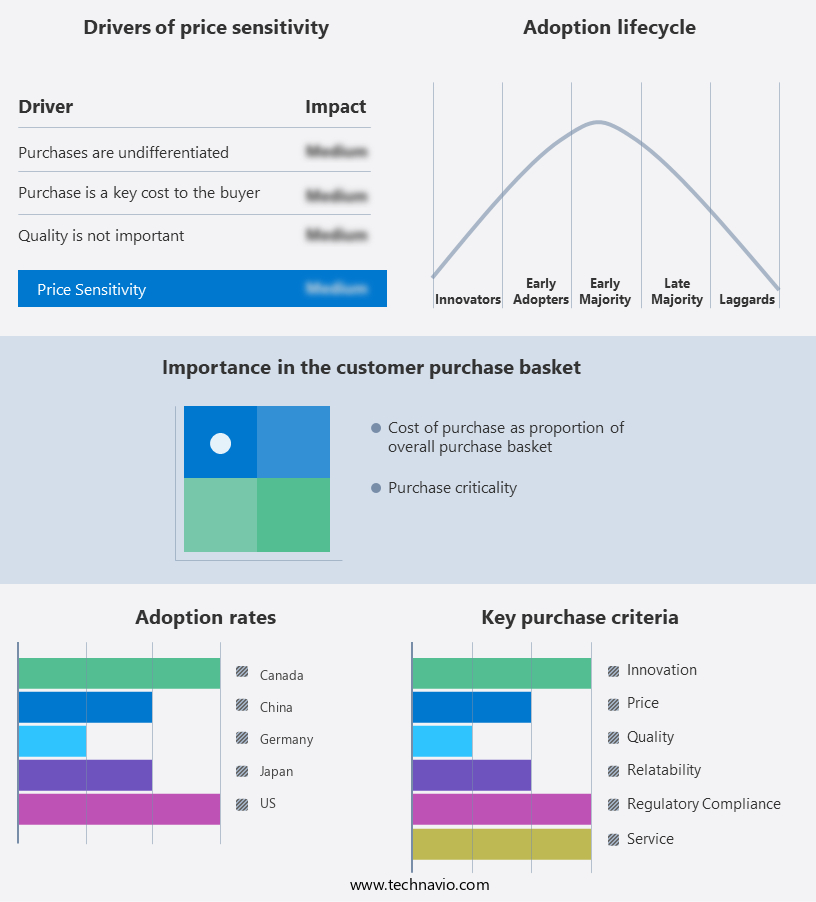
The uterine fibroid (uf) treatment device market forecasting report includes the adoption lifecycle of the market, covering from the innovator's stage to the laggard's stage. It focuses on adoption rates in different regions based on penetration. Furthermore, the uterine fibroid (uf) treatment device market report also includes key purchase criteria and drivers of price sensitivity to help companies evaluate and develop their market growth analysis strategies.
Customer Landscape of Uterine Fibroid (UF) Treatment Device Industry
Competitive Landscape
Companies are implementing various strategies, such as strategic alliances, uterine fibroid (uf) treatment device market forecast, partnerships, mergers and acquisitions, geographical expansion, and product/service launches, to enhance their presence in the industry.
AbbVie Inc. - The company provides FDA-approved oral medication, ORIAHNN (elagolix, estradiol, and norethindrone acetate capsules,) for managing heavy menstrual bleeding in pre-menopausal women with uterine fibroids. This non-surgical treatment consists of a combination of hormones to effectively address symptoms.
The industry research and growth report includes detailed analyses of the competitive landscape of the market and information about key companies, including:
- AbbVie Inc.
- Boston Scientific Corp.
- Chongqing Haifu Medical Technology Co. Ltd.
- Conmed Corp.
- CooperSurgical Inc.
- Hologic Inc.
- INSIGHTEC Ltd.
- KARL STORZ SE and Co. KG
- Lumenis Be Ltd.
- Medtronic Plc
- Merit Medical Systems Inc.
- Minerva Surgical Inc.
- Olympus Corp.
- Profound Medical Corp.
- Stryker Corp.
Qualitative and quantitative analysis of companies has been conducted to help clients understand the wider business environment as well as the strengths and weaknesses of key industry players. Data is qualitatively analyzed to categorize companies as pure play, category-focused, industry-focused, and diversified; it is quantitatively analyzed to categorize companies as dominant, leading, strong, tentative, and weak.
Recent Development and News in Uterine Fibroid (UF) Treatment Device Market
- In January 2024, Merit Medical Systems, a leading healthcare solutions provider, announced the FDA approval of its new Uterine Fibroid Embolization (UFE) system, the NovaStar 1470, which enhances the accuracy and efficiency of fibroid embolization procedures (Merit Medical Systems Press Release, 2024).
- In March 2024, Medtronic and Ethicon, part of the Johnson & Johnson family of companies, entered into a strategic partnership to combine their respective fibroid treatment offerings, aiming to expand their reach and provide more comprehensive solutions to patients (Medtronic Press Release, 2024).
- In April 2025, Acessa Health, a pioneer in minimally invasive fibroid treatments, secured a USD20 million Series C funding round, led by new investor OrbiMed, to accelerate the commercialization of its radiofrequency ablation technology (Acessa Health Press Release, 2025).
- In May 2025, Hologic, a global medical technology company, received CE Mark approval for its new MyoSure Synergy System, an innovative, single-use, handheld device designed for the removal of fibroids and other intrauterine tissue (Hologic Press Release, 2025).
Dive into Technavio's robust research methodology, blending expert interviews, extensive data synthesis, and validated models for unparalleled Uterine Fibroid (UF) Treatment Device Market insights. See full methodology.
|
Market Scope |
|
|
Report Coverage |
Details |
|
Page number |
213 |
|
Base year |
2024 |
|
Historic period |
2019-2023 |
|
Forecast period |
2025-2029 |
|
Growth momentum & CAGR |
Accelerate at a CAGR of 9.6% |
|
Market growth 2025-2029 |
USD 3358.2 million |
|
Market structure |
Fragmented |
|
YoY growth 2024-2025(%) |
8.8 |
|
Key countries |
US, Canada, Germany, UK, China, Mexico, France, Japan, Italy, and India |
|
Competitive landscape |
Leading Companies, Market Positioning of Companies, Competitive Strategies, and Industry Risks |
Research Analyst Overview
- Uterine fibroids, non-cancerous growths in the uterus, affect a significant portion of women worldwide. Various treatment options have emerged to address the symptoms and size of these fibroids, each with distinct advantages and considerations. Hysterectomy procedures, the most invasive approach, involve surgical removal of the uterus. In contrast, laparoscopic myomectomy and uterine fibroid embolization preserve the uterus by removing fibroids or cutting off their blood supply, respectively. Fibroid size reduction techniques, such as energy delivery systems and surgical morcellation, aim to minimize fibroid size while maintaining minimal invasiveness. Device safety profiles and complication risk factors vary among these methods, with robotic surgery systems and myomectomy techniques offering enhanced precision and reduced complications.
- Surgical planning tools and treatment planning software facilitate more effective fibroid characterization, enabling better patient selection and improved treatment efficacy. Uterine artery occlusion and thermal ablation methods are non-surgical alternatives that utilize tissue ablation technology to destroy fibroids. Uterine fibroid detection methods, including high-intensity focused ultrasound and magnetic resonance imaging, enable accurate diagnosis and preoperative assessment. Procedure duration times, patient recovery time, and fibroid recurrence rates differ among treatment modalities. Preoperative assessment and patient selection criteria are crucial factors in determining the most suitable treatment for individual patients. Postoperative complications and treatment outcome prediction are essential considerations in the ongoing evolution of uterine fibroid treatment devices.
- Focused ultrasound surgery, cryoablation technology, and symptom improvement rates continue to be areas of active research and development in the uterine fibroid treatment device market. Lesion visualization and minimally invasive surgery techniques are increasingly popular, offering shorter recovery times and reduced risk of complications.
What are the Key Data Covered in this Uterine Fibroid (UF) Treatment Device Market Research and Growth Report?
-
What is the expected growth of the Uterine Fibroid (UF) Treatment Device Market between 2025 and 2029?
-
USD 3.36 billion, at a CAGR of 9.6%
-
-
What segmentation does the market report cover?
-
The report segmented by Therapeutic Area (Invasive treatment, Minimally invasive treatment, and Non-invasive treatment), Technology (Surgical techniques, Laparoscopic techniques, Ablation techniques, and Embolization techniques), End-user (Hospitals, Ambulatory surgical centers, and Specialized clinics), and Geography (North America, Europe, Asia, and Rest of World (ROW))
-
-
Which regions are analyzed in the report?
-
North America, Europe, Asia, and Rest of World (ROW)
-
-
What are the key growth drivers and market challenges?
-
Increasing prevalence of uterine fibroids, High cost of treatment of uterine fibroid
-
-
Who are the major players in the Uterine Fibroid (UF) Treatment Device Market?
-
Key Companies AbbVie Inc., Boston Scientific Corp., Chongqing Haifu Medical Technology Co. Ltd., Conmed Corp., CooperSurgical Inc., Hologic Inc., INSIGHTEC Ltd., KARL STORZ SE and Co. KG, Lumenis Be Ltd., Medtronic Plc, Merit Medical Systems Inc., Minerva Surgical Inc., Olympus Corp., Profound Medical Corp., and Stryker Corp.
-
Market Research Insights
- The market encompasses a range of technologies designed to address the structural and functional challenges posed by fibroids. According to industry estimates, the global UF treatment device market is expected to reach USD5.3 billion by 2026, growing at a CAGR of 6.5% from 2021. This growth is driven by the increasing prevalence of fibroids, which affects approximately 70% of women aged 50 and above, and the demand for minimally invasive, effective, and patient-centric treatment options. Device performance metrics, such as tissue volume reduction and imaging modality selection, play a crucial role in the success of UF treatment devices.
- For instance, MRI-guided ablation systems offer superior lesion targeting accuracy and treatment planning algorithms, resulting in reduced hospital stay duration and faster recovery times. In contrast, ultrasound-guided surgery and thermal energy delivery systems require extensive operator training programs and strict adherence to clinical guidelines to ensure system accuracy rates and minimize procedural complications. Regulatory compliance, patient satisfaction scores, and blood loss reduction are other critical factors shaping the UF treatment device market. Quality assurance metrics, scarring minimization, and rehabilitation protocols are essential considerations for manufacturers to differentiate their offerings and meet evolving patient needs. Clinical trial data and treatment response assessment are also vital in assessing the safety and efficacy of various UF treatment devices, ensuring that they deliver optimal outcomes for patients.
We can help! Our analysts can customize this uterine fibroid (uf) treatment device market research report to meet your requirements.
 RIA -
RIA - 
