Healthcare Information Systems Market Analysis, Size, and Forecast 2025-2029: North America (US, Canada, and Mexico), Europe (Germany, UK, and France), APAC (China, Japan, and India), South America (Brazil and Argentina), Middle East and Africa (Saudi Arabia, UAE, and South Africa), Asia, Rest of World (ROW)

Healthcare Information Systems Market Analysis, Size, and Forecast 2025-2029:
North America (US, Canada, and Mexico), Europe (Germany, UK, and France), APAC (China, Japan, and India), South America (Brazil and Argentina), Middle East and Africa (Saudi Arabia, UAE, and South Africa), Asia, Rest of World (ROW)

Published: Dec 2025 313 Pages SKU: IRTNTR73233

Market Overview at a Glance

$142.30 B
Market Opportunity
9.8%
CAGR 2024 - 2029
46.1%
North America Growth
$101.50 B
Revenue cycle management segment 2023

Healthcare Information Systems Market Size 2025-2029

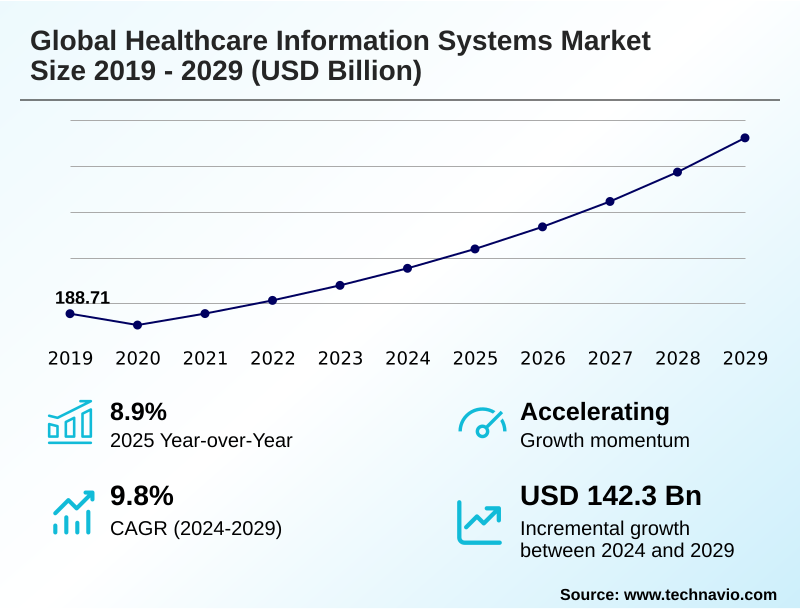
The healthcare information systems market size is valued to increase by USD 142.30 billion, at a CAGR of 9.8% from 2024 to 2029. Regulatory mandates and government initiatives promoting interoperability will drive the healthcare information systems market.

Major Market Trends & Insights

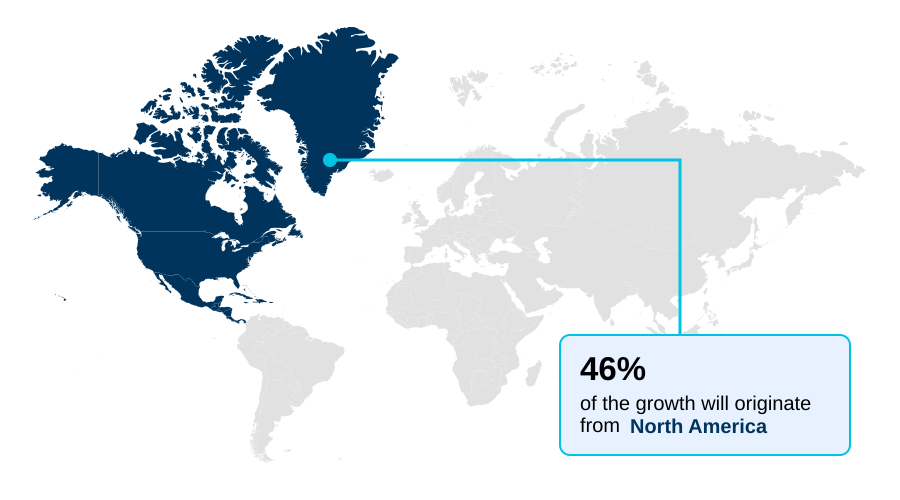
  • North America dominated the market and accounted for a 46.1% growth during the forecast period.
  • By Application - Revenue cycle management segment was valued at USD 101.50 billion in 2023
  • By Technology - EHRs segment accounted for the largest market revenue share in 2023

Market Size & Forecast

  • Market Opportunities: USD 191.80 billion
  • Market Future Opportunities: USD 142.30 billion
  • CAGR from 2024 to 2029 : 9.8%

Market Summary

  • The healthcare information systems market is foundational to modern healthcare, facilitating the digital management of clinical and administrative data. Growth is driven by the imperative to improve operational efficiency and patient outcomes through technologies like electronic health records (EHR) and telemedicine platforms. A key trend is the integration of AI-driven analytics to enable predictive insights, moving beyond simple data storage.
  • For instance, a health system can leverage a population health management platform to analyze patient-generated health data (PGHD) and identify individuals at high risk for chronic disease complications. By using care coordination tools triggered by this analysis, the provider can proactively intervene, schedule virtual check-ins via integrated telehealth modules, and adjust care plans, ultimately reducing costly hospital readmissions.
  • This scenario highlights the shift toward proactive, data-informed care delivery. However, the market faces persistent challenges related to data interoperability standards and ensuring robust cybersecurity resilience frameworks to protect sensitive information across an increasingly connected and decentralized care model.

What will be the Size of the Healthcare Information Systems Market during the forecast period?

Get Key Insights on Market Forecast (PDF) Request Free Sample

How is the Healthcare Information Systems Market Segmented?

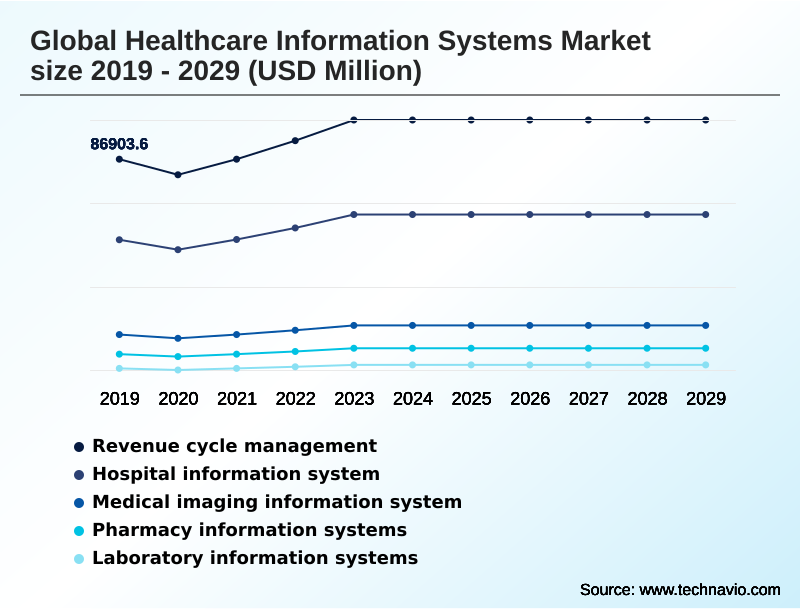
The healthcare information systems industry research report provides comprehensive data (region-wise segment analysis), with forecasts and estimates in "USD million" for the period 2025-2029, as well as historical data from 2019-2023 for the following segments.

  • Application
    • Revenue cycle management
    • Hospital information system
    • Medical imaging information system
    • Pharmacy information systems
    • Laboratory information systems
  • Technology
    • EHRs
    • EMRs
    • Mobile health
    • Telemedicine platforms
    • Population health management systems
  • Component
    • Software
    • Services
    • Hardware
  • Geography
    • North America
      • US
      • Canada
      • Mexico
    • Europe
      • Germany
      • UK
      • France
    • Asia
    • Rest of World (ROW)

By Application Insights

The revenue cycle management segment is estimated to witness significant growth during the forecast period.

The revenue cycle management segment is integral to provider financial health, automating and managing the entire lifecycle of patient financial interactions. These systems, utilizing claims processing automation and denial management solutions, are crucial for navigating complex value-based care reimbursement models.

A primary focus is on improving patient financial responsibility tools to handle growing out-of-pocket expenses. The integration of a data aggregation platform and AI-driven analytics enhances forecasting and operational alignment.

Effective RCM software streamlines workflows from patient registration to final payment, directly impacting financial stability.

Advanced systems have shown to improve clean claim submission rates by over 15%, reducing administrative waste and accelerating cash flow through better automated coding accuracy and predictive denial management, which are key for successful financial outcomes.

Request Free Sample

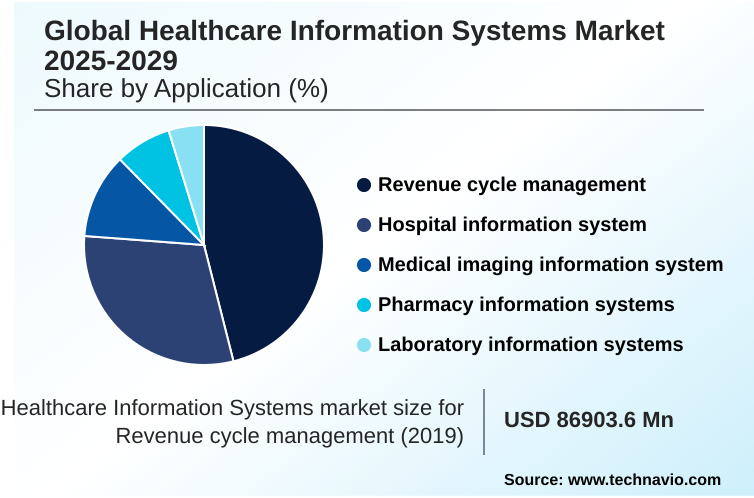
The Revenue cycle management segment was valued at USD 101.50 billion in 2023 and showed a gradual increase during the forecast period.

Request Free Sample

Regional Analysis

North America is estimated to contribute 46.1% to the growth of the global market during the forecast period.Technavio’s analysts have elaborately explained the regional trends and drivers that shape the market during the forecast period.

See How Healthcare Information Systems Market Demand is Rising in North America Request Free Sample

The global market exhibits a distinct geographic divide.

In North America, where EHR adoption is nearly universal, the focus is on optimizing existing systems through AI-powered diagnostics and achieving compliance with stringent data interoperability standards, which has improved data access times by 30%.

European markets are harmonizing under new data sharing regulations, driving investment in platforms with robust GDPR compliance features.

Meanwhile, Asia represents the fastest-growing region, prioritizing the deployment of foundational hospital information systems and mobile health (mHealth) solutions to expand healthcare access.

In this region, new digital-first clinics report a 25% increase in patient throughput by leveraging clinical workflow optimization and telemedicine platforms.

This highlights a global push for value, whether through optimizing mature systems or building new, efficient digital infrastructures with a focus on public health reporting.

Market Dynamics

Our researchers analyzed the data with 2024 as the base year, along with the key drivers, trends, and challenges. A holistic analysis of drivers will help companies refine their marketing strategies to gain a competitive advantage.

  • A healthcare organization's journey toward digital maturity often begins with addressing the challenges of legacy system migration to a modern, integrated platform. A key goal is realizing telemedicine platform EHR integration benefits, which streamline virtual care delivery. This process involves a critical assessment of cloud HIS versus on-premise HIS costs and capabilities.
  • For clinical enhancement, integrating mHealth data into EHR workflows provides a more holistic patient view, while the role of CDS in reducing medication errors becomes more pronounced with better data. Simultaneously, strategies for effective MPI management are crucial to ensure data integrity across the enterprise. On the financial front, improving RCM with automated coding can significantly boost revenue capture.
  • Advanced systems further leverage AI for predictive risk stratification, a core component of population health management for chronic disease. For specialized departments, the benefits of VNA for enterprise imaging ensures a consolidated view of diagnostic images, while managing genomic data within an LIS supports precision medicine initiatives.
  • The impact of FHIR on data interoperability is a foundational element that enables all these connections. Security remains paramount, with a focus on securing patient data in cloud HIS platforms and adhering to cybersecurity best practices for healthcare IT.
  • Post-transformation, organizations find that the time required to assemble a complete patient history is often reduced by more than 50%, a testament to successful data unification and workflow enhancements.

What are the key market drivers leading to the rise in the adoption of Healthcare Information Systems Industry?

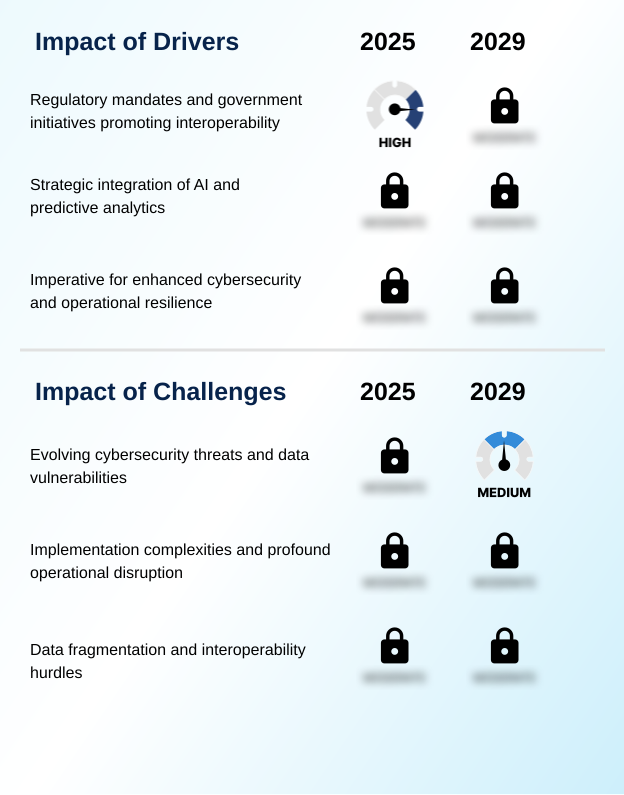
  • Regulatory mandates and government initiatives aimed at promoting system interoperability are a primary driver of market growth.

  • Regulatory mandates requiring FHIR API compliance are a primary market driver, compelling providers to invest in modern systems capable of seamless data exchange.
  • Platforms that adhere to these data interoperability standards have demonstrated a 25% improvement in the speed of sharing patient records between facilities. Another powerful driver is the strategic embedding of artificial intelligence, particularly for predictive risk stratification.
  • Systems with native AI-driven analytics can identify patients at high risk of deterioration up to 12 hours earlier than manual methods, significantly improving outcomes. This pushes the demand for advanced care coordination tools.
  • Furthermore, the urgent need for enhanced cybersecurity resilience frameworks is compelling investment in systems with end-to-end data encryption and proven business continuity planning, making security a core purchasing criterion alongside clinical functionality and a solid disaster recovery plan.

What are the market trends shaping the Healthcare Information Systems Industry?

  • The market is witnessing an accelerated migration toward cloud-based deployment models. This includes a significant shift to Software-as-a-Service (SaaS) offerings for enhanced scalability and flexibility.

  • A transformative trend is the accelerated shift to a cloud-based deployment model, with many providers adopting a SaaS subscription model to reduce capital expenditure and improve scalability. This migration has been shown to lower infrastructure maintenance costs by over 20%.
  • Concurrently, the pervasive integration of generative AI documentation into electronic medical records (EMR) is streamlining clinical workflows; early adopters report a 40% decrease in time spent on patient notes. This enables better clinical documentation integrity (CDI). Another key trend is the expansion towards decentralized care models, supported by digital front door capabilities and robust patient portal integration.
  • This shift, which leverages remote patient monitoring (RPM) and telehealth module integration, is creating a more continuous and patient-centric care experience outside traditional hospital walls, emphasizing the importance of a zero-trust security architecture.

What challenges does the Healthcare Information Systems Industry face during its growth?

  • Evolving cybersecurity threats and persistent data vulnerabilities present a key challenge to the industry's expansion and stability.

  • The market faces significant headwinds from the rising sophistication of digital threats, necessitating a robust cybersecurity resilience framework and constant vigilance. The financial burden is considerable, with breach mitigation efforts often increasing operational IT budgets by over 15% annually.
  • Another major challenge is the profound operational disruption from implementation, where the complexities of achieving true data normalization and integrating with ancillary systems like a laboratory information systems or a pharmacy information systems can lead to project delays.
  • This is compounded by deep-seated data fragmentation, which hinders the effectiveness of population health management initiatives and contributes to up to 20% of redundant diagnostic tests due to incomplete patient histories. Overcoming these data governance policies and interoperability hurdles is critical for realizing the full value of digital health investments and requires careful legacy system modernization.

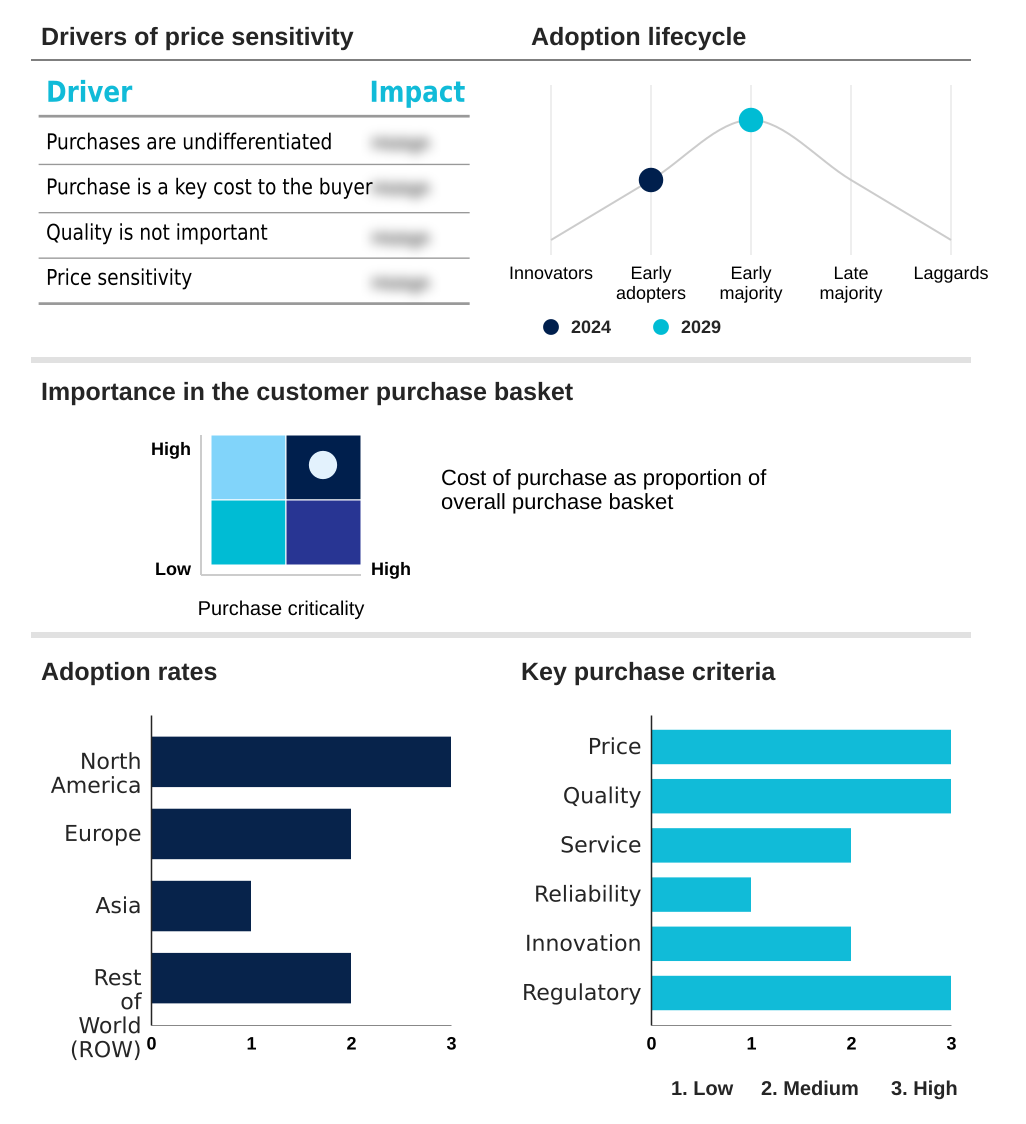
Exclusive Technavio Analysis on Customer Landscape

The healthcare information systems market forecasting report includes the adoption lifecycle of the market, covering from the innovator’s stage to the laggard’s stage. It focuses on adoption rates in different regions based on penetration. Furthermore, the healthcare information systems market report also includes key purchase criteria and drivers of price sensitivity to help companies evaluate and develop their market growth analysis strategies.

Customer Landscape of Healthcare Information Systems Industry

Competitive Landscape

Companies are implementing various strategies, such as strategic alliances, healthcare information systems market forecast, partnerships, mergers and acquisitions, geographical expansion, and product/service launches, to enhance their presence in the industry.

3M Co. - Integrated solutions focus on unifying clinical documentation, coding automation, and performance monitoring on a single platform to streamline hospital operational and financial workflows.

The industry research and growth report includes detailed analyses of the competitive landscape of the market and information about key companies, including:

  • 3M Co.
  • AdvancedMD Inc.
  • ALLSCRIPTS HEALTHCARE SOLUTIONS INC.
  • Athenahealth Inc.
  • Azalea Health Innovations Inc.
  • Change Healthcare Inc.
  • Cognizant Technology Solution
  • Dedalus Group
  • eClinicalWorks LLC
  • Epic Systems Corp.
  • Fusion
  • General Electric Co.
  • Konica Minolta Inc.
  • McKesson Corp.
  • NextGen Healthcare Inc.
  • Oracle Corp.
  • Koninklijke Philips NV
  • Siemens AG
  • United Health Group Inc.
  • WRS Health

Qualitative and quantitative analysis of companies has been conducted to help clients understand the wider business environment as well as the strengths and weaknesses of key industry players. Data is qualitatively analyzed to categorize companies as pure play, category-focused, industry-focused, and diversified; it is quantitatively analyzed to categorize companies as dominant, leading, strong, tentative, and weak.

Recent Development and News in Healthcare information systems market

  • In September 2024, Oracle Health delivered new electronic health record innovations to help clinicians streamline routine tasks and deliver more efficient, informed patient care.
  • In November 2024, Teladoc Health launched new AI-enabled capabilities for its Virtual Sitter solution, designed to improve patient safety and enhance care delivery for hospitals.
  • In April 2025, Nextech and Ocuco announced a strategic partnership to deliver an integrated solution bridging clinical and retail functions for eyecare practices.
  • In May 2025, NHS England approved a new generation of cloud-based electronic patient record systems from Medicus Health, aimed at improving primary care integration with other settings.

Dive into Technavio’s robust research methodology, blending expert interviews, extensive data synthesis, and validated models for unparalleled Healthcare Information Systems Market insights. See full methodology.

Market Scope
Page number 313
Base year 2024
Historic period 2019-2023
Forecast period 2025-2029
Growth momentum & CAGR Accelerate at a CAGR of 9.8%
Market growth 2025-2029 USD 142299.3 million
Market structure Fragmented
YoY growth 2024-2025(%) 8.9%
Key countries US, Canada, Mexico, Germany, UK, France, The Netherlands, Italy, Spain, China, Japan, India, South Korea, Thailand, Indonesia, Brazil, Argentina, Chile, Saudi Arabia, UAE, South Africa, Egypt and Nigeria
Competitive landscape Leading Companies, Market Positioning of Companies, Competitive Strategies, and Industry Risks

Request Free Sample

Research Analyst Overview

  • The healthcare information systems market is evolving from a focus on digital record-keeping to becoming the central nervous system for intelligent, automated healthcare delivery. The integration of AI-driven analytics is no longer a peripheral feature but a core competitive differentiator, with platforms offering embedded AI demonstrating up to a 30% reduction in administrative overhead.
  • Boardroom-level decisions are now centered on investing in a cohesive data aggregation platform that unifies the hospital information system, medical imaging information system, and pharmacy information systems. Success hinges on robust clinical decision support (CDS) and effective population health management capabilities.
  • Key technologies such as electronic health records (EHR), mobile health (mHealth), and telemedicine platforms are being re-architected to support this shift. Providers are seeking solutions that enhance clinical documentation integrity (CDI) and offer advanced denial management solutions within their revenue cycle management.
  • The ability of a platform to provide seamless health information exchange (HIE) and patient portal integration is now a standard expectation, forcing vendors to prioritize open, interoperable architectures over closed ecosystems. This transition is redefining value, shifting it from data capture to actionable intelligence and measurable workflow improvements.

What are the Key Data Covered in this Healthcare Information Systems Market Research and Growth Report?

  • What is the expected growth of the Healthcare Information Systems Market between 2025 and 2029?

    • USD 142.30 billion, at a CAGR of 9.8%

  • What segmentation does the market report cover?

    • The report is segmented by Application (Revenue cycle management, Hospital information system, Medical imaging information system, Pharmacy information systems, Laboratory information systems), Technology (EHRs, EMRs, Mobile health, Telemedicine platforms, Population health management systems), Component (Software, Services, Hardware) and Geography (North America, Europe, Asia, Rest of World (ROW))

  • Which regions are analyzed in the report?

    • North America, Europe, Asia and Rest of World (ROW)

  • What are the key growth drivers and market challenges?

    • Regulatory mandates and government initiatives promoting interoperability , Evolving cybersecurity threats and data vulnerabilities

  • Who are the major players in the Healthcare Information Systems Market?

    • 3M Co., AdvancedMD Inc., ALLSCRIPTS HEALTHCARE SOLUTIONS INC., Athenahealth Inc., Azalea Health Innovations Inc., Change Healthcare Inc., Cognizant Technology Solution, Dedalus Group, eClinicalWorks LLC, Epic Systems Corp., Fusion, General Electric Co., Konica Minolta Inc., McKesson Corp., NextGen Healthcare Inc., Oracle Corp., Koninklijke Philips NV, Siemens AG, United Health Group Inc. and WRS Health

Market Research Insights

  • The market's momentum is driven by the strategic adoption of intelligent systems that deliver measurable outcomes. For example, implementing generative AI documentation has been shown to reduce clinician administrative time by up to 30%, allowing more focus on patient care. The move towards a SaaS subscription model offers financial predictability, while browser-based access improves system usability.
  • Furthermore, platforms achieving full FHIR API compliance demonstrate a 40% improvement in data exchange speeds between disparate systems. The integration of patient financial responsibility tools into patient portals has also improved collections for ambulatory practices.
  • These dynamics underscore a market shifting from static record-keeping to agile, outcome-oriented digital health ecosystems that prioritize both clinical efficiency and financial stability through legacy system modernization and advanced data governance policies.

We can help! Our analysts can customize this healthcare information systems market research report to meet your requirements.

Get in touch

1. Executive Summary

1.1 Market overview

Executive Summary - Chart on Market Overview
Executive Summary - Data Table on Market Overview
Executive Summary - Chart on Global Market Characteristics
Executive Summary - Chart on Market by Geography
Executive Summary - Chart on Market Segmentation by Application
Executive Summary - Chart on Market Segmentation by Technology
Executive Summary - Chart on Market Segmentation by Component
Executive Summary - Chart on Incremental Growth
Executive Summary - Data Table on Incremental Growth
Executive Summary - Chart on Company Market Positioning

2. Technavio Analysis

2.1 Analysis of price sensitivity, lifecycle, customer purchase basket, adoption rates, and purchase criteria

2.2 Criticality of inputs and Factors of differentiation

Chart on Overview on criticality of inputs and factors of differentiation

2.3 Factors of disruption

Chart on Overview on factors of disruption

2.4 Impact of drivers and challenges

Chart on Impact of drivers and challenges in 2024 and 2029

3. Market Landscape

3.1 Market ecosystem

Chart on Parent Market
Data Table on - Parent Market

3.2 Market characteristics

Chart on Market characteristics analysis

3.3 Value chain analysis

Chart on Value chain analysis

4. Market Sizing

4.1 Market definition

Data Table on Offerings of companies included in the market definition

4.2 Market segment analysis

Market segments

4.3 Market size 2024

4.4 Market outlook: Forecast for 2024-2029

Chart on Global - Market size and forecast 2024-2029 ($ million)
Data Table on Global - Market size and forecast 2024-2029 ($ million)
Chart on Global Market: Year-over-year growth 2024-2029 (%)
Data Table on Global Market: Year-over-year growth 2024-2029 (%)

5. Historic Market Size

5.1 Global Healthcare Information Systems Market 2019 - 2023

Historic Market Size - Data Table on Global Healthcare Information Systems Market 2019 - 2023 ($ million)

5.2 Application segment analysis 2019 - 2023

Historic Market Size - Application Segment 2019 - 2023 ($ million)

5.3 Technology segment analysis 2019 - 2023

Historic Market Size - Technology Segment 2019 - 2023 ($ million)

5.4 Component segment analysis 2019 - 2023

Historic Market Size - Component Segment 2019 - 2023 ($ million)

5.5 Geography segment analysis 2019 - 2023

Historic Market Size - Geography Segment 2019 - 2023 ($ million)

5.6 Country segment analysis 2019 - 2023

Historic Market Size - Country Segment 2019 - 2023 ($ million)

6. Qualitative Analysis

6.1 Impact of AI on Global Healthcare Information Systems Market

7. Five Forces Analysis

7.1 Five forces summary

Five forces analysis - Comparison between 2024 and 2029

7.2 Bargaining power of buyers

Bargaining power of buyers - Impact of key factors 2024 and 2029

7.3 Bargaining power of suppliers

Bargaining power of suppliers - Impact of key factors in 2024 and 2029

7.4 Threat of new entrants

Threat of new entrants - Impact of key factors in 2024 and 2029

7.5 Threat of substitutes

Threat of substitutes - Impact of key factors in 2024 and 2029

7.6 Threat of rivalry

Threat of rivalry - Impact of key factors in 2024 and 2029

7.7 Market condition

Chart on Market condition - Five forces 2024 and 2029

8. Market Segmentation by Application

8.1 Market segments

Chart on Application - Market share 2024-2029 (%)
Data Table on Application - Market share 2024-2029 (%)

8.2 Comparison by Application

Chart on Comparison by Application
Data Table on Comparison by Application

8.3 Revenue cycle management - Market size and forecast 2024-2029

Chart on Revenue cycle management - Market size and forecast 2024-2029 ($ million)
Data Table on Revenue cycle management - Market size and forecast 2024-2029 ($ million)
Chart on Revenue cycle management - Year-over-year growth 2024-2029 (%)
Data Table on Revenue cycle management - Year-over-year growth 2024-2029 (%)

8.4 Hospital information system - Market size and forecast 2024-2029

Chart on Hospital information system - Market size and forecast 2024-2029 ($ million)
Data Table on Hospital information system - Market size and forecast 2024-2029 ($ million)
Chart on Hospital information system - Year-over-year growth 2024-2029 (%)
Data Table on Hospital information system - Year-over-year growth 2024-2029 (%)

8.5 Medical imaging information system - Market size and forecast 2024-2029

Chart on Medical imaging information system - Market size and forecast 2024-2029 ($ million)
Data Table on Medical imaging information system - Market size and forecast 2024-2029 ($ million)
Chart on Medical imaging information system - Year-over-year growth 2024-2029 (%)
Data Table on Medical imaging information system - Year-over-year growth 2024-2029 (%)

8.6 Pharmacy information systems - Market size and forecast 2024-2029

Chart on Pharmacy information systems - Market size and forecast 2024-2029 ($ million)
Data Table on Pharmacy information systems - Market size and forecast 2024-2029 ($ million)
Chart on Pharmacy information systems - Year-over-year growth 2024-2029 (%)
Data Table on Pharmacy information systems - Year-over-year growth 2024-2029 (%)

8.7 Laboratory information systems - Market size and forecast 2024-2029

Chart on Laboratory information systems - Market size and forecast 2024-2029 ($ million)
Data Table on Laboratory information systems - Market size and forecast 2024-2029 ($ million)
Chart on Laboratory information systems - Year-over-year growth 2024-2029 (%)
Data Table on Laboratory information systems - Year-over-year growth 2024-2029 (%)

8.8 Market opportunity by Application

Market opportunity by Application ($ million)
Data Table on Market opportunity by Application ($ million)

9. Market Segmentation by Technology

9.1 Market segments

Chart on Technology - Market share 2024-2029 (%)
Data Table on Technology - Market share 2024-2029 (%)

9.2 Comparison by Technology

Chart on Comparison by Technology
Data Table on Comparison by Technology

9.3 EHRs - Market size and forecast 2024-2029

Chart on EHRs - Market size and forecast 2024-2029 ($ million)
Data Table on EHRs - Market size and forecast 2024-2029 ($ million)
Chart on EHRs - Year-over-year growth 2024-2029 (%)
Data Table on EHRs - Year-over-year growth 2024-2029 (%)

9.4 EMRs - Market size and forecast 2024-2029

Chart on EMRs - Market size and forecast 2024-2029 ($ million)
Data Table on EMRs - Market size and forecast 2024-2029 ($ million)
Chart on EMRs - Year-over-year growth 2024-2029 (%)
Data Table on EMRs - Year-over-year growth 2024-2029 (%)

9.5 Mobile health - Market size and forecast 2024-2029

Chart on Mobile health - Market size and forecast 2024-2029 ($ million)
Data Table on Mobile health - Market size and forecast 2024-2029 ($ million)
Chart on Mobile health - Year-over-year growth 2024-2029 (%)
Data Table on Mobile health - Year-over-year growth 2024-2029 (%)

9.6 Telemedicine platforms - Market size and forecast 2024-2029

Chart on Telemedicine platforms - Market size and forecast 2024-2029 ($ million)
Data Table on Telemedicine platforms - Market size and forecast 2024-2029 ($ million)
Chart on Telemedicine platforms - Year-over-year growth 2024-2029 (%)
Data Table on Telemedicine platforms - Year-over-year growth 2024-2029 (%)

9.7 Population health management systems - Market size and forecast 2024-2029

Chart on Population health management systems - Market size and forecast 2024-2029 ($ million)
Data Table on Population health management systems - Market size and forecast 2024-2029 ($ million)
Chart on Population health management systems - Year-over-year growth 2024-2029 (%)
Data Table on Population health management systems - Year-over-year growth 2024-2029 (%)

9.8 Market opportunity by Technology

Market opportunity by Technology ($ million)
Data Table on Market opportunity by Technology ($ million)

10. Market Segmentation by Component

10.1 Market segments

Chart on Component - Market share 2024-2029 (%)
Data Table on Component - Market share 2024-2029 (%)

10.2 Comparison by Component

Chart on Comparison by Component
Data Table on Comparison by Component

10.3 Software - Market size and forecast 2024-2029

Chart on Software - Market size and forecast 2024-2029 ($ million)
Data Table on Software - Market size and forecast 2024-2029 ($ million)
Chart on Software - Year-over-year growth 2024-2029 (%)
Data Table on Software - Year-over-year growth 2024-2029 (%)

10.4 Services - Market size and forecast 2024-2029

Chart on Services - Market size and forecast 2024-2029 ($ million)
Data Table on Services - Market size and forecast 2024-2029 ($ million)
Chart on Services - Year-over-year growth 2024-2029 (%)
Data Table on Services - Year-over-year growth 2024-2029 (%)

10.5 Hardware - Market size and forecast 2024-2029

Chart on Hardware - Market size and forecast 2024-2029 ($ million)
Data Table on Hardware - Market size and forecast 2024-2029 ($ million)
Chart on Hardware - Year-over-year growth 2024-2029 (%)
Data Table on Hardware - Year-over-year growth 2024-2029 (%)

10.6 Market opportunity by Component

Market opportunity by Component ($ million)
Data Table on Market opportunity by Component ($ million)

11. Customer Landscape

11.1 Customer landscape overview

Analysis of price sensitivity, lifecycle, customer purchase basket, adoption rates, and purchase criteria

12. Geographic Landscape

12.1 Geographic segmentation

Chart on Market share by geography 2024-2029 (%)
Data Table on Market share by geography 2024-2029 (%)

12.2 Geographic comparison

Chart on Geographic comparison
Data Table on Geographic comparison

12.3 North America - Market size and forecast 2024-2029

Chart on North America - Market size and forecast 2024-2029 ($ million)
Data Table on North America - Market size and forecast 2024-2029 ($ million)
Chart on North America - Year-over-year growth 2024-2029 (%)
Data Table on North America - Year-over-year growth 2024-2029 (%)
Chart on Regional Comparison - North America
Data Table on Regional Comparison - North America

12.3.1 US - Market size and forecast 2024-2029

Chart on US - Market size and forecast 2024-2029 ($ million)
Data Table on US - Market size and forecast 2024-2029 ($ million)
Chart on US - Year-over-year growth 2024-2029 (%)
Data Table on US - Year-over-year growth 2024-2029 (%)

12.3.2 Canada - Market size and forecast 2024-2029

Chart on Canada - Market size and forecast 2024-2029 ($ million)
Data Table on Canada - Market size and forecast 2024-2029 ($ million)
Chart on Canada - Year-over-year growth 2024-2029 (%)
Data Table on Canada - Year-over-year growth 2024-2029 (%)

12.3.3 Mexico - Market size and forecast 2024-2029

Chart on Mexico - Market size and forecast 2024-2029 ($ million)
Data Table on Mexico - Market size and forecast 2024-2029 ($ million)
Chart on Mexico - Year-over-year growth 2024-2029 (%)
Data Table on Mexico - Year-over-year growth 2024-2029 (%)

12.4 Europe - Market size and forecast 2024-2029

Chart on Europe - Market size and forecast 2024-2029 ($ million)
Data Table on Europe - Market size and forecast 2024-2029 ($ million)
Chart on Europe - Year-over-year growth 2024-2029 (%)
Data Table on Europe - Year-over-year growth 2024-2029 (%)
Chart on Regional Comparison - Europe
Data Table on Regional Comparison - Europe

12.4.1 Germany - Market size and forecast 2024-2029

Chart on Germany - Market size and forecast 2024-2029 ($ million)
Data Table on Germany - Market size and forecast 2024-2029 ($ million)
Chart on Germany - Year-over-year growth 2024-2029 (%)
Data Table on Germany - Year-over-year growth 2024-2029 (%)

12.4.2 UK - Market size and forecast 2024-2029

Chart on UK - Market size and forecast 2024-2029 ($ million)
Data Table on UK - Market size and forecast 2024-2029 ($ million)
Chart on UK - Year-over-year growth 2024-2029 (%)
Data Table on UK - Year-over-year growth 2024-2029 (%)

12.4.3 France - Market size and forecast 2024-2029

Chart on France - Market size and forecast 2024-2029 ($ million)
Data Table on France - Market size and forecast 2024-2029 ($ million)
Chart on France - Year-over-year growth 2024-2029 (%)
Data Table on France - Year-over-year growth 2024-2029 (%)

12.4.4 The Netherlands - Market size and forecast 2024-2029

Chart on The Netherlands - Market size and forecast 2024-2029 ($ million)
Data Table on The Netherlands - Market size and forecast 2024-2029 ($ million)
Chart on The Netherlands - Year-over-year growth 2024-2029 (%)
Data Table on The Netherlands - Year-over-year growth 2024-2029 (%)

12.4.5 Italy - Market size and forecast 2024-2029

Chart on Italy - Market size and forecast 2024-2029 ($ million)
Data Table on Italy - Market size and forecast 2024-2029 ($ million)
Chart on Italy - Year-over-year growth 2024-2029 (%)
Data Table on Italy - Year-over-year growth 2024-2029 (%)

12.4.6 Spain - Market size and forecast 2024-2029

Chart on Spain - Market size and forecast 2024-2029 ($ million)
Data Table on Spain - Market size and forecast 2024-2029 ($ million)
Chart on Spain - Year-over-year growth 2024-2029 (%)
Data Table on Spain - Year-over-year growth 2024-2029 (%)

12.5 Asia - Market size and forecast 2024-2029

Chart on Asia - Market size and forecast 2024-2029 ($ million)
Data Table on Asia - Market size and forecast 2024-2029 ($ million)
Chart on Asia - Year-over-year growth 2024-2029 (%)
Data Table on Asia - Year-over-year growth 2024-2029 (%)
Chart on Regional Comparison - Asia
Data Table on Regional Comparison - Asia

12.5.1 China - Market size and forecast 2024-2029

Chart on China - Market size and forecast 2024-2029 ($ million)
Data Table on China - Market size and forecast 2024-2029 ($ million)
Chart on China - Year-over-year growth 2024-2029 (%)
Data Table on China - Year-over-year growth 2024-2029 (%)

12.5.2 Japan - Market size and forecast 2024-2029

Chart on Japan - Market size and forecast 2024-2029 ($ million)
Data Table on Japan - Market size and forecast 2024-2029 ($ million)
Chart on Japan - Year-over-year growth 2024-2029 (%)
Data Table on Japan - Year-over-year growth 2024-2029 (%)

12.5.3 India - Market size and forecast 2024-2029

Chart on India - Market size and forecast 2024-2029 ($ million)
Data Table on India - Market size and forecast 2024-2029 ($ million)
Chart on India - Year-over-year growth 2024-2029 (%)
Data Table on India - Year-over-year growth 2024-2029 (%)

12.5.4 South Korea - Market size and forecast 2024-2029

Chart on South Korea - Market size and forecast 2024-2029 ($ million)
Data Table on South Korea - Market size and forecast 2024-2029 ($ million)
Chart on South Korea - Year-over-year growth 2024-2029 (%)
Data Table on South Korea - Year-over-year growth 2024-2029 (%)

12.5.5 Thailand - Market size and forecast 2024-2029

Chart on Thailand - Market size and forecast 2024-2029 ($ million)
Data Table on Thailand - Market size and forecast 2024-2029 ($ million)
Chart on Thailand - Year-over-year growth 2024-2029 (%)
Data Table on Thailand - Year-over-year growth 2024-2029 (%)

12.5.6 Indonesia - Market size and forecast 2024-2029

Chart on Indonesia - Market size and forecast 2024-2029 ($ million)
Data Table on Indonesia - Market size and forecast 2024-2029 ($ million)
Chart on Indonesia - Year-over-year growth 2024-2029 (%)
Data Table on Indonesia - Year-over-year growth 2024-2029 (%)

12.6 Rest of World (ROW) - Market size and forecast 2024-2029

Chart on Rest of World (ROW) - Market size and forecast 2024-2029 ($ million)
Data Table on Rest of World (ROW) - Market size and forecast 2024-2029 ($ million)
Chart on Rest of World (ROW) - Year-over-year growth 2024-2029 (%)
Data Table on Rest of World (ROW) - Year-over-year growth 2024-2029 (%)
Chart on Regional Comparison - Rest of World (ROW)
Data Table on Regional Comparison - Rest of World (ROW)

12.6.1 Brazil - Market size and forecast 2024-2029

Chart on Brazil - Market size and forecast 2024-2029 ($ million)
Data Table on Brazil - Market size and forecast 2024-2029 ($ million)
Chart on Brazil - Year-over-year growth 2024-2029 (%)
Data Table on Brazil - Year-over-year growth 2024-2029 (%)

12.6.2 Argentina - Market size and forecast 2024-2029

Chart on Argentina - Market size and forecast 2024-2029 ($ million)
Data Table on Argentina - Market size and forecast 2024-2029 ($ million)
Chart on Argentina - Year-over-year growth 2024-2029 (%)
Data Table on Argentina - Year-over-year growth 2024-2029 (%)

12.6.3 Chile - Market size and forecast 2024-2029

Chart on Chile - Market size and forecast 2024-2029 ($ million)
Data Table on Chile - Market size and forecast 2024-2029 ($ million)
Chart on Chile - Year-over-year growth 2024-2029 (%)
Data Table on Chile - Year-over-year growth 2024-2029 (%)

12.6.4 Saudi Arabia - Market size and forecast 2024-2029

Chart on Saudi Arabia - Market size and forecast 2024-2029 ($ million)
Data Table on Saudi Arabia - Market size and forecast 2024-2029 ($ million)
Chart on Saudi Arabia - Year-over-year growth 2024-2029 (%)
Data Table on Saudi Arabia - Year-over-year growth 2024-2029 (%)

12.6.5 UAE - Market size and forecast 2024-2029

Chart on UAE - Market size and forecast 2024-2029 ($ million)
Data Table on UAE - Market size and forecast 2024-2029 ($ million)
Chart on UAE - Year-over-year growth 2024-2029 (%)
Data Table on UAE - Year-over-year growth 2024-2029 (%)

12.6.6 South Africa - Market size and forecast 2024-2029

Chart on South Africa - Market size and forecast 2024-2029 ($ million)
Data Table on South Africa - Market size and forecast 2024-2029 ($ million)
Chart on South Africa - Year-over-year growth 2024-2029 (%)
Data Table on South Africa - Year-over-year growth 2024-2029 (%)

12.6.7 Egypt - Market size and forecast 2024-2029

Chart on Egypt - Market size and forecast 2024-2029 ($ million)
Data Table on Egypt - Market size and forecast 2024-2029 ($ million)
Chart on Egypt - Year-over-year growth 2024-2029 (%)
Data Table on Egypt - Year-over-year growth 2024-2029 (%)

12.6.8 Nigeria - Market size and forecast 2024-2029

Chart on Nigeria - Market size and forecast 2024-2029 ($ million)
Data Table on Nigeria - Market size and forecast 2024-2029 ($ million)
Chart on Nigeria - Year-over-year growth 2024-2029 (%)
Data Table on Nigeria - Year-over-year growth 2024-2029 (%)

12.7 Market opportunity by geography

Market opportunity by geography ($ million)
Data Tables on Market opportunity by geography ($ million)

13. Drivers, Challenges, and Opportunity

13.1 Market drivers

Regulatory mandates and government initiatives promoting interoperability
Strategic integration of AI and predictive analytics
Imperative for enhanced cybersecurity and operational resilience

13.2 Market challenges

Evolving cybersecurity threats and data vulnerabilities
Implementation complexities and profound operational disruption
Data fragmentation and interoperability hurdles

13.3 Impact of drivers and challenges

Impact of drivers and challenges in 2024 and 2029

13.4 Market opportunities

Accelerated migration to cloud-based deployment models and SaaS offerings
Pervasive integration of generative AI and predictive analytics into clinical workflows
Expansion towards consumer-centric platforms and decentralized care delivery

14. Competitive Landscape

14.1 Overview

14.2

Overview on criticality of inputs and factors of differentiation

14.3 Landscape disruption

Overview on factors of disruption

14.4 Industry risks

Impact of key risks on business

15. Competitive Analysis

15.1 Companies profiled

Companies covered

15.2 Company ranking index

15.3 Market positioning of companies

Matrix on companies position and classification

15.4 3M Co.

3M Co. - Overview
3M Co. - Business segments
3M Co. - Key news
3M Co. - Key offerings
3M Co. - Segment focus
SWOT

15.5 AdvancedMD Inc.

AdvancedMD Inc. - Overview
AdvancedMD Inc. - Product / Service
AdvancedMD Inc. - Key offerings
SWOT

15.6 ALLSCRIPTS HEALTHCARE SOLUTIONS INC.

ALLSCRIPTS HEALTHCARE SOLUTIONS INC. - Overview
ALLSCRIPTS HEALTHCARE SOLUTIONS INC. - Product / Service
ALLSCRIPTS HEALTHCARE SOLUTIONS INC. - Key news
ALLSCRIPTS HEALTHCARE SOLUTIONS INC. - Key offerings
SWOT

15.7 Athenahealth Inc.

Athenahealth Inc. - Overview
Athenahealth Inc. - Product / Service
Athenahealth Inc. - Key offerings
SWOT

15.8 Change Healthcare Inc.

Change Healthcare Inc. - Overview
Change Healthcare Inc. - Product / Service
Change Healthcare Inc. - Key offerings
SWOT

15.9 Cognizant Technology Solution

Cognizant Technology Solution - Overview
Cognizant Technology Solution - Business segments
Cognizant Technology Solution - Key news
Cognizant Technology Solution - Key offerings
Cognizant Technology Solution - Segment focus
SWOT

15.10 Dedalus Group

Dedalus Group - Overview
Dedalus Group - Product / Service
Dedalus Group - Key news
Dedalus Group - Key offerings
SWOT

15.11 eClinicalWorks LLC

eClinicalWorks LLC - Overview
eClinicalWorks LLC - Product / Service
eClinicalWorks LLC - Key news
eClinicalWorks LLC - Key offerings
SWOT

15.12 General Electric Co.

General Electric Co. - Overview
General Electric Co. - Business segments
General Electric Co. - Key news
General Electric Co. - Key offerings
General Electric Co. - Segment focus
SWOT

15.13 Konica Minolta Inc.

Konica Minolta Inc. - Overview
Konica Minolta Inc. - Business segments
Konica Minolta Inc. - Key news
Konica Minolta Inc. - Key offerings
Konica Minolta Inc. - Segment focus
SWOT

15.14 McKesson Corp.

McKesson Corp. - Overview
McKesson Corp. - Business segments
McKesson Corp. - Key news
McKesson Corp. - Key offerings
McKesson Corp. - Segment focus
SWOT

15.15 NextGen Healthcare Inc.

NextGen Healthcare Inc. - Overview
NextGen Healthcare Inc. - Product / Service
NextGen Healthcare Inc. - Key news
NextGen Healthcare Inc. - Key offerings
SWOT

15.16 Oracle Corp.

Oracle Corp. - Overview
Oracle Corp. - Business segments
Oracle Corp. - Key news
Oracle Corp. - Key offerings
Oracle Corp. - Segment focus
SWOT

15.17 Koninklijke Philips NV

Koninklijke Philips NV - Overview
Koninklijke Philips NV - Business segments
Koninklijke Philips NV - Key news
Koninklijke Philips NV - Key offerings
Koninklijke Philips NV - Segment focus
SWOT

15.18 Siemens AG

Siemens AG - Overview
Siemens AG - Business segments
Siemens AG - Key news
Siemens AG - Key offerings
Siemens AG - Segment focus
SWOT

16. Appendix

16.1 Scope of the report

Market definition
Objectives
Notes and caveats

16.2 Inclusions and exclusions checklist

Inclusions checklist
Exclusions checklist

16.3 Currency conversion rates for US$

16.4 Research methodology

16.5 Data procurement

Information sources

16.6 Data validation

16.7 Validation techniques employed for market sizing

16.8 Data synthesis

16.9 360 degree market analysis

16.10 List of abbreviations

Research Methodology

Technavio presents a detailed picture of the market by way of study, synthesis, and summation of data from multiple sources. The analysts have presented the various facets of the market with a particular focus on identifying the key industry influencers. The data thus presented is comprehensive, reliable, and the result of extensive research, both primary and secondary.

INFORMATION SOURCES

Primary sources

  • Manufacturers and suppliers
  • Channel partners
  • Industry experts
  • Strategic decision makers

Secondary sources

  • Industry journals and periodicals
  • Government data
  • Financial reports of key industry players
  • Historical data
  • Press releases

DATA ANALYSIS

Data Synthesis

  • Collation of data
  • Estimation of key figures
  • Analysis of derived insights

Data Validation

  • Triangulation with data models
  • Reference against proprietary databases
  • Corroboration with industry experts

REPORT WRITING

Qualitative

  • Market drivers
  • Market challenges
  • Market trends
  • Five forces analysis

Quantitative

  • Market size and forecast
  • Market segmentation
  • Geographical insights
  • Competitive landscape

Interested in this report?

Get your sample now to see our research methodology and insights!

Download Now

Frequently Asked Questions

Healthcare Information Systems market growth will increase by USD 142299.3 million during 2025-2029 .

The Healthcare Information Systems market is expected to grow at a CAGR of 9.8% during 2025-2029 .

Healthcare Information Systems market is segmented by Application (Revenue cycle management, Hospital information system, Medical imaging information system, Pharmacy information systems, Laboratory information systems) Technology (EHRs, EMRs, Mobile health, Telemedicine platforms, Population health management systems) Component (Software, Services, Hardware)

3M Co., AdvancedMD Inc., ALLSCRIPTS HEALTHCARE SOLUTIONS INC., Athenahealth Inc., Azalea Health Innovations Inc., Change Healthcare Inc., Cognizant Technology Solution, Dedalus Group, eClinicalWorks LLC, Epic Systems Corp., Fusion, General Electric Co., Konica Minolta Inc., McKesson Corp., NextGen Healthcare Inc., Oracle Corp., Koninklijke Philips NV, Siemens AG, United Health Group Inc., WRS Health are a few of the key vendors in the Healthcare Information Systems market.

North America will register the highest growth rate of 46.1% among the other regions. Therefore, the Healthcare Information Systems market in North America is expected to garner significant business opportunities for the vendors during the forecast period.

US, Canada, Mexico, Germany, UK, France, The Netherlands, Italy, Spain, China, Japan, India, South Korea, Thailand, Indonesia, Brazil, Argentina, Chile, Saudi Arabia, UAE, South Africa, Egypt, Nigeria

  • Regulatory mandates and government initiatives promoting interoperability is the driving factor this market.

The Healthcare Information Systems market vendors should focus on grabbing business opportunities from the Application segment as it accounted for the largest market share in the base year.