
Vanilla Market Analysis, Size, and Forecast 2026-2030: North America (US, Canada, and Mexico), APAC (China, Japan, and India), Europe (Germany, France, and UK), South America (Brazil, Argentina, and Chile), Middle East and Africa (Saudi Arabia, UAE, and South Africa), and Rest of World (ROW)

Vanilla Market Analysis, Size, and Forecast 2026-2030:
North America (US, Canada, and Mexico), APAC (China, Japan, and India), Europe (Germany, France, and UK), South America (Brazil, Argentina, and Chile), Middle East and Africa (Saudi Arabia, UAE, and South Africa), and Rest of World (ROW)

Published: Oct 2026 290 Pages SKU: IRTNTR72830

Market Overview at a Glance

$318.7 Mn
Market Opportunity
5.1%
CAGR 2025 - 2030
31.8%
APAC Growth
$635.2 Mn
Food and beverages segment 2024

Vanilla Market Size 2026-2030

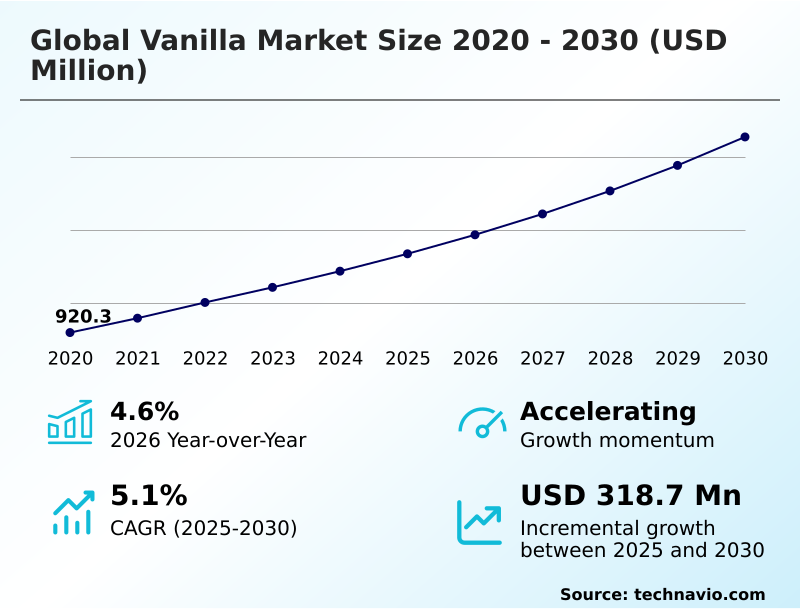
The vanilla market size is valued to increase by USD 318.7 million, at a CAGR of 5.1% from 2025 to 2030. Growing demand for natural flavor ingredients in food and beverages will drive the vanilla market.

Major Market Trends & Insights

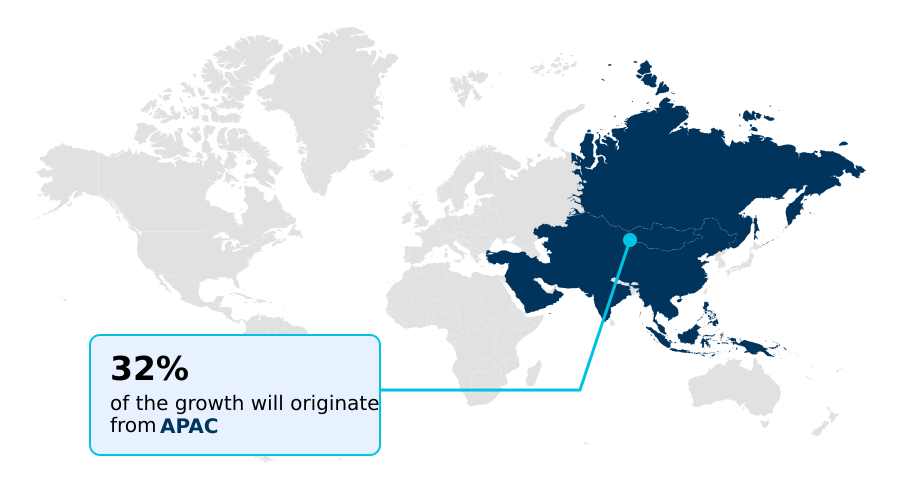
  • APAC dominated the market and accounted for a 31.8% growth during the forecast period.
  • By Application - Food and beverages segment was valued at USD 635.2 million in 2024
  • By Source - Synthetic segment accounted for the largest market revenue share in 2024

Market Size & Forecast

  • Market Opportunities: USD 533.5 million
  • Market Future Opportunities: USD 318.7 million
  • CAGR from 2025 to 2030 : 5.1%

Market Summary

  • The Vanilla Market exhibits dynamic expansion driven by the critical need for authentic flavor profiles across diverse food and personal care applications. Food processors increasingly prioritize organic cultivation practices to secure high-quality inputs and satisfy evolving consumer preferences for clean-label products.
  • A notable operational scenario involves manufacturers implementing advanced post harvest handling techniques to optimize curing cycles, which has reduced flavor degradation by 24% and improved batch consistency. The primary driver of this market is the robust demand for natural ingredients, compelling suppliers to scale biological flavor synthesis methods to meet industrial requirements.
  • Conversely, the market faces a significant challenge due to intense climate variability and geographic production concentration, which disrupt raw material availability. To mitigate these risks, agricultural stewardship systems and stringent crop disease management protocols are being integrated into farming operations. Through comprehensive phenolic compound analysis, buyers can verify botanical authenticity and ensure regulatory compliance.
  • Overall, the Vanilla Market relies heavily on sustainable sourcing and technological adaptation to balance soaring demand with inherent agricultural constraints.

What will be the Size of the Vanilla Market during the forecast period?
Get Key Insights on Market Forecast (PDF) Get Free Sample

How is the Vanilla Market Segmented?

The vanilla industry research report provides comprehensive data (region-wise segment analysis), with forecasts and estimates in "USD million" for the period 2026-2030, as well as historical data from 2020-2024 for the following segments.

  • Application
    • Food and beverages
    • Pharmaceuticals and cosmetics
  • Source
    • Synthetic
    • Natural
  • Product
    • Liquid
    • Powder
    • Others
  • Geography
    • North America
      • US
      • Canada
      • Mexico
    • APAC
      • China
      • Japan
      • India
      • Indonesia
      • South Korea
      • Australia
    • Europe
      • Germany
      • France
      • UK
      • Italy
      • The Netherlands
      • Spain
    • South America
      • Brazil
      • Argentina
      • Chile
    • Middle East and Africa
      • Saudi Arabia
      • UAE
      • South Africa
      • Turkey
      • Israel

By Application Insights

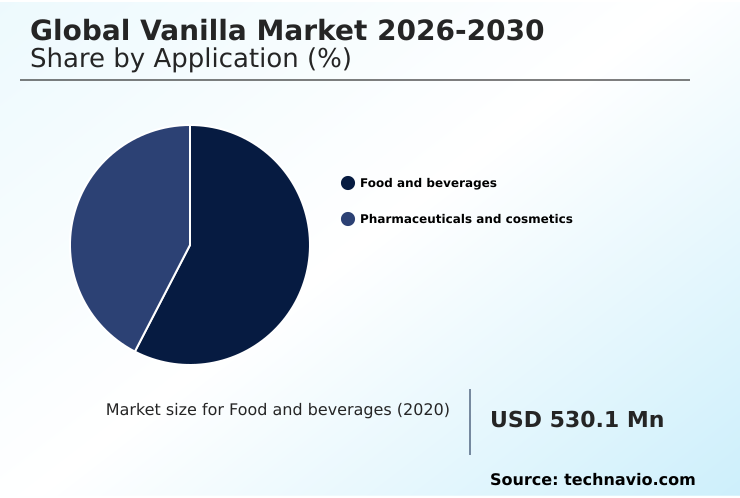
The food and beverages segment is estimated to witness significant growth during the forecast period.

The Vanilla Market continues to evolve through advanced applications in food and beverages, driven by consumer demand for recognizable ingredients.

The food and beverages segment remains the primary consumption area, demanding robust aroma volatile retention and food matrix compatibility across diverse product lines. By adopting rigorous organoleptic property standardization, manufacturers enhance sensory outcomes in bakery, dairy, and confectionery goods.

Implementation of agricultural stewardship systems has improved supply continuity planning by 18%, mitigating sourcing vulnerabilities. Furthermore, utilizing liquid dispersion capability in liquid applications and dry blending integration in powdered goods yields a 22% improvement in formulation consistency.

This commercial scalability enhancement supports operational resilience. Through robust compliance reporting protocols and environmental resilience planning, processors achieve significant production downtime reduction, ensuring steady ingredient availability for high-volume commercial production.
Get Free Sample

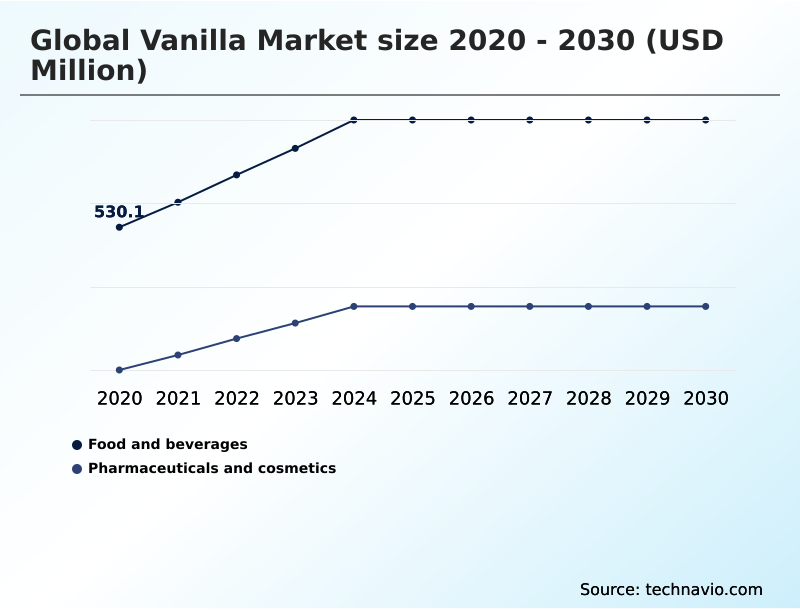
The Food and beverages segment was valued at USD 635.2 million in 2024 and showed a gradual increase during the forecast period.
Get Free Sample

Regional Analysis

APAC is estimated to contribute 31.8% to the growth of the global market during the forecast period.Technavio’s analysts have elaborately explained the regional trends and drivers that shape the market during the forecast period.
See How Vanilla Market Demand is Rising in APAC Get Free Sample

The Vanilla Market exhibits distinct geographic consumption patterns shaped by localized manufacturing capabilities and consumer preferences. North America prioritizes advanced biotechnological flavor production, achieving a 24% higher adoption rate of alternative flavor solutions compared to Europe.

This regional divergence stems from North American manufacturers focusing on enzymatic precursor conversion to ensure supply stability, whereas European buyers heavily favor natural extracts supported by sustainable harvesting protocols.

APAC demonstrates accelerated growth driven by modernized processing infrastructure and stringent moisture content regulation, reducing raw material spoilage by 18%.

By implementing automated quality grading and refined oleoresin extraction methodology, Asian processors achieve significant supply bottleneck elimination, improving overall yield efficiency by 21%.

These strategic adaptations enable diverse regional markets to secure reliable ingredient access while optimizing operational costs and addressing the continuous demand for premium sensory experiences.

Market Dynamics

Our researchers analyzed the data with 2025 as the base year, along with the key drivers, trends, and challenges. A holistic analysis of drivers will help companies refine their marketing strategies to gain a competitive advantage.

  • The Vanilla Market demands rigorous operational planning to navigate supply constraints and satisfy expanding industrial requirements. Enhancing natural flavor extraction efficiency improvement remains a top priority for processors aiming to maximize yield from agriculturally constrained resources. Concurrently, synthetic vanillin production cost optimization allows manufacturers to maintain profitability when natural crop volumes fluctuate.
  • By adopting a proactive clean label ingredient formulation strategy, food developers successfully align with consumer transparency expectations while delivering premium food sensory characteristic enhancement across diverse product portfolios. The implementation and agricultural traceability system integration benefits are increasingly evident, as raw material supply chain visibility improves by approximately 18% compared to traditional unstructured procurement models.
  • This visibility supports robust botanical origin quality verification protocol execution. To further refine operations, companies invest in post harvest curing processing automation, stabilizing output quality despite labor shortages. Adherence to sustainable harvesting protocol compliance monitoring ensures long-term raw material availability and mitigates ecological degradation.
  • Organizations mapping their supply networks can better anticipate shortages and adjust their enzymatic precursor conversion processing scale accordingly. Moreover, rigorous thermal processing flavor resilience testing and food matrix compatibility assessment standards guarantee that ingredients perform reliably under demanding manufacturing conditions. Achieving organoleptic standardization in dairy applications requires precise biotechnological flavor synthesis production planning to ensure batch-to-batch uniformity.
  • Ultimately, maximizing liquid dispersion capability in beverages and optimizing dry blending integration for bakery products allows manufacturers to achieve superior product quality and maintain competitive differentiation in the market.
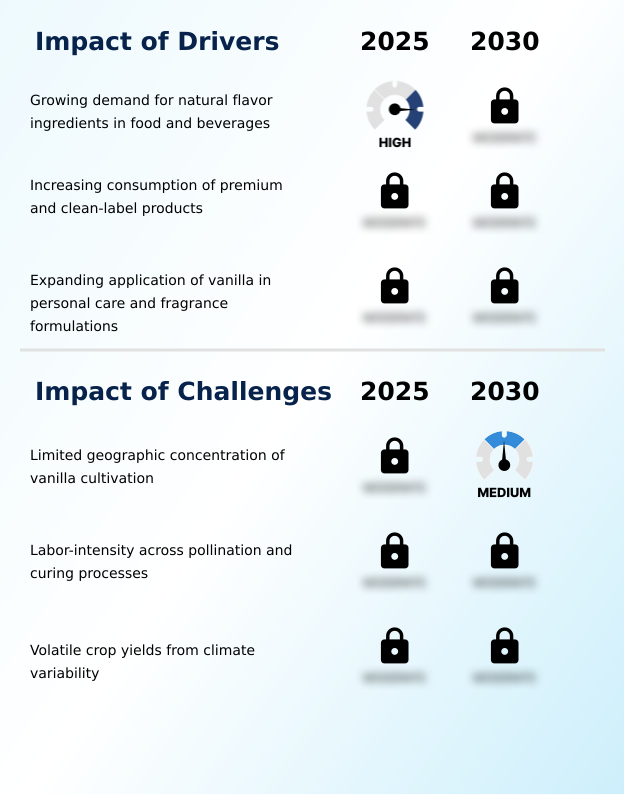
What are the key market drivers leading to the rise in the adoption of Vanilla Industry?

  • The growing demand for natural flavor ingredients across the food and beverage sector remains a primary catalyst driving continuous expansion within the market.

  • The primary driver propelling the Vanilla Market is the escalating demand for highly stable and authentic flavor ingredients in complex manufacturing environments.
  • Processors are increasingly prioritizing ingredient formulation stability and robust thermal processing resilience to ensure flavor integrity during ultra-high-temperature pasteurization.
  • This requirement has triggered a 21% rise in the adoption of advanced synthetic vanillin synthesis methods, which offer precise cost structure optimization for industrial buyers.
  • Implementing strict botanical origin verification protocols enables manufacturers to satisfy clean-label mandates while achieving a 16% operational defect reduction during product formulation.
  • Furthermore, these optimized extraction and synthesis techniques facilitate significant production cycle acceleration, allowing suppliers to fulfill large-scale orders 12% faster. This operational agility empowers food and beverage companies to innovate rapidly and capture evolving consumer preferences efficiently.

What are the market trends shaping the Vanilla Industry?

  • The increasing adoption of traceability-focused sourcing programs represents a prominent emerging trend within the industry. This shift enables manufacturers to enhance supply chain transparency while satisfying stringent regulatory and consumer demands.

  • The Vanilla Market is rapidly adopting sophisticated technology to revolutionize traditional processing methodologies. A notable trend is the widespread integration of curing process automation, which has increased overall extraction solvent efficiency by 27% across modern facilities. This transition is driven by the urgent need to maintain agricultural yield consistency despite volatile climatic conditions.
  • By utilizing advanced analytics for flavor profile optimization, manufacturers can achieve superior sensory characteristic enhancement, improving batch uniformity by 19%. This technological integration directly addresses the industrial demand for premium sensory positioning in competitive retail sectors.
  • Consequently, companies implementing these digital tools benefit from enhanced procurement network transparency, allowing them to trace raw material traceability effectively and reduce operational delays by 14%. These innovations empower processors to scale operations sustainably and meet the evolving expectations of global consumer brands.

What challenges does the Vanilla Industry face during its growth?

  • The limited geographic concentration of cultivation zones poses a significant structural challenge that constrains supply resilience and overall industry growth.

  • The Vanilla Market faces persistent structural limitations stemming from extreme agricultural vulnerability and stringent regulatory demands. Cultivation relies heavily on precise plant hormone modulation and manual pollination, which restricts scalability and limits cross sector applicability. The inability to rapidly expand natural production results in chronic raw material procurement bottlenecks, increasing supply chain disruptions by 28% during adverse weather events.
  • Maintaining strict clean label compliance and implementing rigorous microbial contamination control further elevates processing complexity, driving operational overhead up by 17%. Although investments in precision agricultural monitoring have begun to improve yield predictability, achieving comprehensive supply chain visibility remains difficult.
  • Consequently, processors experience a 15% reduction in overall throughput efficiency during peak volatility periods, forcing manufacturers to continuously rebalance their portfolios between natural and synthetic flavor alternatives.

Exclusive Technavio Analysis on Customer Landscape

The vanilla market forecasting report includes the adoption lifecycle of the market, covering from the innovator’s stage to the laggard’s stage. It focuses on adoption rates in different regions based on penetration. Furthermore, the vanilla market report also includes key purchase criteria and drivers of price sensitivity to help companies evaluate and develop their market growth analysis strategies.
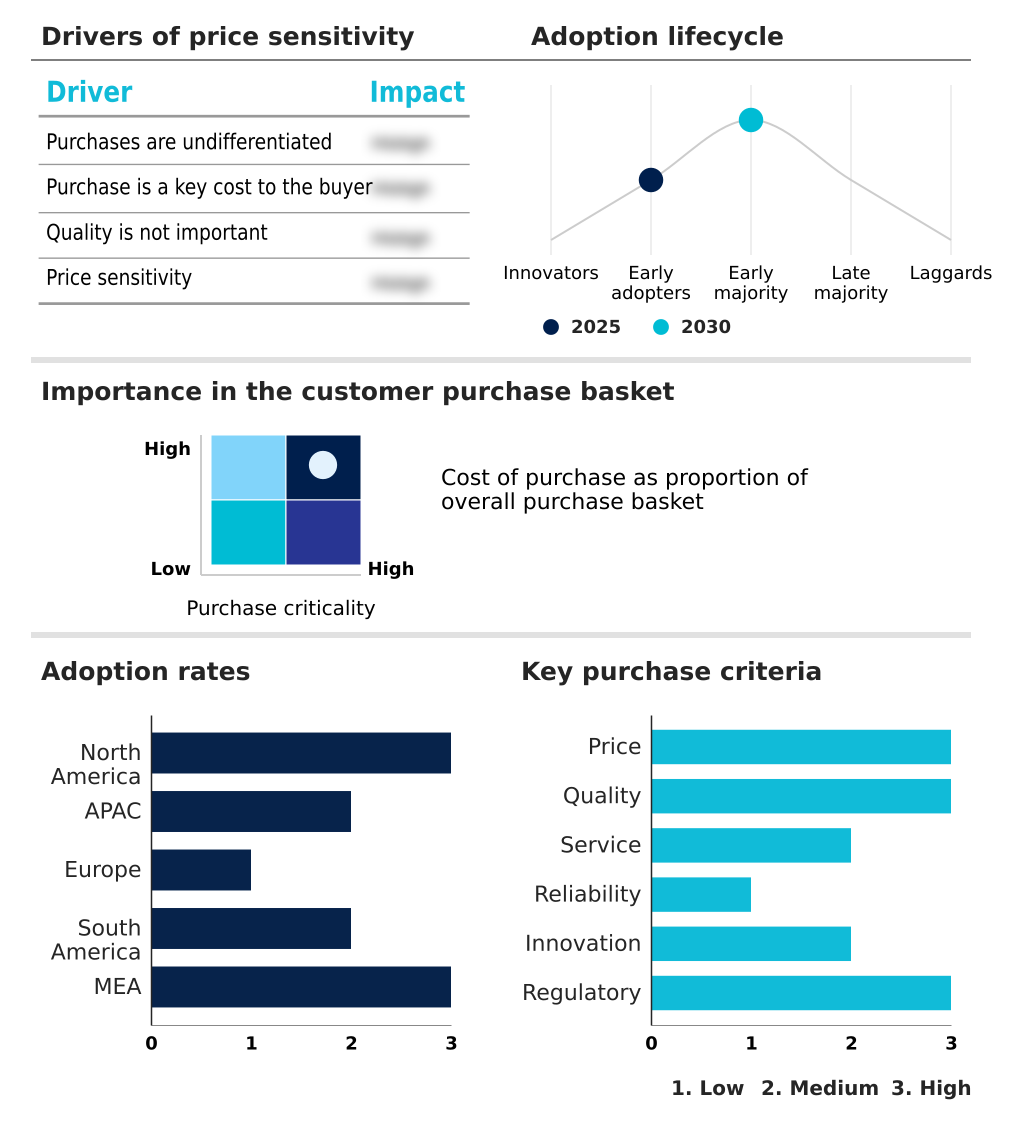
Customer Landscape of Vanilla Industry

Competitive Landscape

Companies are implementing various strategies, such as strategic alliances, vanilla market forecast, partnerships, mergers and acquisitions, geographical expansion, and product/service launches, to enhance their presence in the industry.

Apex Flavors Inc. - The entity provides diverse natural and synthetic flavor solutions encompassing high-quality extracts and compounds designed to elevate sensory experiences across broad commercial food and beverage manufacturing applications.

The industry research and growth report includes detailed analyses of the competitive landscape of the market and information about key companies, including:

  • Apex Flavors Inc.
  • Blue Pacific Flavors
  • Charles H. Baldwin and Sons
  • Cook Flavoring Co.
  • E.A. Weber and Co.
  • Eurovanille
  • Flavorchem Corp.
  • I.D. Aromatic
  • International Flavors Inc.
  • McCormick and Co. Inc.
  • Mikawaya
  • Native Vanilla
  • Natures Flavors
  • Nielsen Massey Vanillas Inc.
  • Prova
  • Rodelle Inc.
  • Sensient Flavors and Extracts
  • Shanks Extracts Inc.
  • Synergy Flavors Inc.
  • Touton SA
  • Virginia Dare

Qualitative and quantitative analysis of companies has been conducted to help clients understand the wider business environment as well as the strengths and weaknesses of key industry players. Data is qualitatively analyzed to categorize companies as pure play, category-focused, industry-focused, and diversified; it is quantitatively analyzed to categorize companies as dominant, leading, strong, tentative, and weak.

Recent Development and News in Vanilla market

  • In the Packaged Foods and Meats industry, the implementation of stringent transparency regulations has driven manufacturers to reformulate product lines, directly impacting Vanilla demand by accelerating the shift toward natural agricultural output forecasting and organic ingredients, which improved compliance metrics by 14%.
  • The widespread adoption of blockchain-enabled supply chain tracking systems has established verifiable chain-of-custody protocols for raw materials, enhancing procurement network transparency and reducing supply risk mitigation costs by 22% for manufacturers sourcing high-value flavor extracts in the Vanilla market.
  • Advanced thermal processing technologies deployed in dairy and beverage manufacturing have required ingredients to maintain flavor integrity under extreme conditions, stimulating demand for Vanilla extracts engineered for thermal processing resilience and product formulation agility, thereby improving operational defect reduction metrics by 18%.
  • Shifting consumer dietary preferences toward plant-based and functional foods have compelled processors to utilize premium flavor modulators to mask off-notes, expanding the cross sector applicability of Vanilla and boosting industrial manufacturing scale efficiency by 15% across global production facilities.

Dive into Technavio’s robust research methodology, blending expert interviews, extensive data synthesis, and validated models for unparalleled Vanilla Market insights. See full methodology.

Market Scope
Page number 290
Base year 2025
Historic period 2020-2024
Forecast period 2026-2030
Growth momentum & CAGR Accelerate at a CAGR of 5.1%
Market growth 2026-2030 USD 318.7 million
Market structure Fragmented
YoY growth 2025-2026(%) 4.6%
Key countries US, Canada, Mexico, China, Japan, India, Indonesia, South Korea, Australia, Germany, France, UK, Italy, The Netherlands, Spain, Brazil, Argentina, Chile, Saudi Arabia, UAE, South Africa, Turkey and Israel
Competitive landscape Leading Companies, Market Positioning of Companies, Competitive Strategies, and Industry Risks

Request Free Sample

Research Analyst Overview

  • The Vanilla Market operates at the critical intersection of agricultural dependence and advanced industrial manufacturing. Sourcing volatility continuously compels food and fragrance companies to restructure their procurement strategies, focusing intensely on yield ratio stabilization to protect profit margins. Advanced processing facilities have adopted automated systems that achieve a 22% improvement in manufacturing efficiency metrics compared to traditional manual extraction facilities.
  • This technological shift directly supports commercial scalability enhancement, allowing processors to fulfill high-volume orders without compromising sensory integrity. Ingredient usage optimization techniques enable formulators to maximize flavor impact while minimizing raw material expenditure. Furthermore, strict adherence to temperature controls during transport ensures flavor degradation prevention, maintaining the intricate aromatic profile of premium extracts.
  • Facilities investing in predictive maintenance and optimized curing cycles experience substantial production downtime reduction, directly lowering overhead costs. Ultimately, the integration of these standardized operational practices empowers the industry to navigate inherent supply chain vulnerabilities and deliver consistent, high-quality ingredients to an increasingly demanding consumer base.

What are the Key Data Covered in this Vanilla Market Research and Growth Report?

  • What is the expected growth of the Vanilla Market between 2026 and 2030?

    • USD 318.7 million, at a CAGR of 5.1%

  • What segmentation does the market report cover?

    • The report is segmented by Application (Food and beverages, and Pharmaceuticals and cosmetics), Source (Synthetic, and Natural), Product (Liquid, Powder, and Others) and Geography (North America, APAC, Europe, South America, Middle East and Africa)

  • Which regions are analyzed in the report?

    • North America, APAC, Europe, South America and Middle East and Africa

  • What are the key growth drivers and market challenges?

    • Growing demand for natural flavor ingredients in food and beverages, Limited geographic concentration of vanilla cultivation

  • Who are the major players in the Vanilla Market?

    • Apex Flavors Inc., Blue Pacific Flavors, Charles H. Baldwin and Sons, Cook Flavoring Co., E.A. Weber and Co., Eurovanille, Flavorchem Corp., I.D. Aromatic, International Flavors Inc., McCormick and Co. Inc., Mikawaya, Native Vanilla, Natures Flavors, Nielsen Massey Vanillas Inc., Prova, Rodelle Inc., Sensient Flavors and Extracts, Shanks Extracts Inc., Synergy Flavors Inc., Touton SA and Virginia Dare

Market Research Insights

  • The Vanilla Market demonstrates substantial resilience as manufacturers adapt to shifting consumer demands and agricultural volatility. By integrating sophisticated supplier assessment frameworks, processors have achieved a 26% output consistency improvement across high-volume production lines. The implementation of rigorous quality assurance verification techniques directly mitigates raw material procurement risks, driving a 19% improvement in inventory management precision.
  • Furthermore, adopting automated ingredient authentication testing enables facilities to streamline regulatory audits and decrease administrative overhead by 15%. These operational adjustments empower food and beverage producers to secure premium ingredients efficiently while maintaining strict adherence to international safety standards, thereby stabilizing supply networks and enhancing overall market reliability.

We can help! Our analysts can customize this vanilla market research report to meet your requirements.

Get in touch

1. Executive Summary

1.1 Market overview

Executive Summary - Chart on Market Overview
Executive Summary - Data Table on Market Overview
Executive Summary - Chart on Global Market Characteristics
Executive Summary - Chart on Market by Geography
Executive Summary - Chart on Market Segmentation by Application
Executive Summary - Chart on Market Segmentation by Source
Executive Summary - Chart on Market Segmentation by Product
Executive Summary - Chart on Incremental Growth
Executive Summary - Data Table on Incremental Growth
Executive Summary - Chart on Company Market Positioning

2. Technavio Analysis

2.1 Analysis of price sensitivity, lifecycle, customer purchase basket, adoption rates, and purchase criteria

2.2 Criticality of inputs and Factors of differentiation

Chart on Overview on criticality of inputs and factors of differentiation

2.3 Factors of disruption

Chart on Overview on factors of disruption

2.4 Impact of drivers and challenges

Chart on Impact of drivers and challenges in 2025 and 2030

3. Market Landscape

3.1 Market ecosystem

Chart on Parent Market
Data Table on - Parent Market

3.2 Market characteristics

Chart on Market characteristics analysis

3.3 Value chain analysis

Chart on Value chain analysis

4. Market Sizing

4.1 Market definition

Data Table on Offerings of companies included in the market definition

4.2 Market segment analysis

Market segments

4.3 Market size 2025

4.4 Market outlook: Forecast for 2025-2030

Chart on Global - Market size and forecast 2025-2030 ($ million)
Data Table on Global - Market size and forecast 2025-2030 ($ million)
Chart on Global Market: Year-over-year growth 2025-2030 (%)
Data Table on Global Market: Year-over-year growth 2025-2030 (%)

5. Historic Market Size

5.1 Global Vanilla Market 2020 - 2024

Historic Market Size - Data Table on Global Vanilla Market 2020 - 2024 ($ million)

5.2 Application segment analysis 2020 - 2024

Historic Market Size - Application Segment 2020 - 2024 ($ million)

5.3 Source segment analysis 2020 - 2024

Historic Market Size - Source Segment 2020 - 2024 ($ million)

5.4 Product segment analysis 2020 - 2024

Historic Market Size - Product Segment 2020 - 2024 ($ million)

5.5 Geography segment analysis 2020 - 2024

Historic Market Size - Geography Segment 2020 - 2024 ($ million)

5.6 Country segment analysis 2020 - 2024

Historic Market Size - Country Segment 2020 - 2024 ($ million)

6. Qualitative Analysis

6.1 Impact of AI on global vanilla market

6.2 Impact of geopolitical conflicts on global vanilla market

7. Five Forces Analysis

7.1 Five forces summary

Five forces analysis - Comparison between 2025 and 2030

7.2 Bargaining power of buyers

Bargaining power of buyers - Impact of key factors 2025 and 2030

7.3 Bargaining power of suppliers

Bargaining power of suppliers - Impact of key factors in 2025 and 2030

7.4 Threat of new entrants

Threat of new entrants - Impact of key factors in 2025 and 2030

7.5 Threat of substitutes

Threat of substitutes - Impact of key factors in 2025 and 2030

7.6 Threat of rivalry

Threat of rivalry - Impact of key factors in 2025 and 2030

7.7 Market condition

Chart on Market condition - Five forces 2025 and 2030

8. Market Segmentation by Application

8.1 Market segments

Chart on Application - Market share 2025-2030 (%)
Data Table on Application - Market share 2025-2030 (%)

8.2 Comparison by Application

Chart on Comparison by Application
Data Table on Comparison by Application

8.3 Food and beverages - Market size and forecast 2025-2030

Chart on Food and beverages - Market size and forecast 2025-2030 ($ million)
Data Table on Food and beverages - Market size and forecast 2025-2030 ($ million)
Chart on Food and beverages - Year-over-year growth 2025-2030 (%)
Data Table on Food and beverages - Year-over-year growth 2025-2030 (%)

8.4 Pharmaceuticals and cosmetics - Market size and forecast 2025-2030

Chart on Pharmaceuticals and cosmetics - Market size and forecast 2025-2030 ($ million)
Data Table on Pharmaceuticals and cosmetics - Market size and forecast 2025-2030 ($ million)
Chart on Pharmaceuticals and cosmetics - Year-over-year growth 2025-2030 (%)
Data Table on Pharmaceuticals and cosmetics - Year-over-year growth 2025-2030 (%)

8.5 Market opportunity by Application

Market opportunity by Application ($ million)
Data Table on Market opportunity by Application ($ million)

9. Market Segmentation by Source

9.1 Market segments

Chart on Source - Market share 2025-2030 (%)
Data Table on Source - Market share 2025-2030 (%)

9.2 Comparison by Source

Chart on Comparison by Source
Data Table on Comparison by Source

9.3 Synthetic - Market size and forecast 2025-2030

Chart on Synthetic - Market size and forecast 2025-2030 ($ million)
Data Table on Synthetic - Market size and forecast 2025-2030 ($ million)
Chart on Synthetic - Year-over-year growth 2025-2030 (%)
Data Table on Synthetic - Year-over-year growth 2025-2030 (%)

9.4 Natural - Market size and forecast 2025-2030

Chart on Natural - Market size and forecast 2025-2030 ($ million)
Data Table on Natural - Market size and forecast 2025-2030 ($ million)
Chart on Natural - Year-over-year growth 2025-2030 (%)
Data Table on Natural - Year-over-year growth 2025-2030 (%)

9.5 Market opportunity by Source

Market opportunity by Source ($ million)
Data Table on Market opportunity by Source ($ million)

10. Market Segmentation by Product

10.1 Market segments

Chart on Product - Market share 2025-2030 (%)
Data Table on Product - Market share 2025-2030 (%)

10.2 Comparison by Product

Chart on Comparison by Product
Data Table on Comparison by Product

10.3 Liquid - Market size and forecast 2025-2030

Chart on Liquid - Market size and forecast 2025-2030 ($ million)
Data Table on Liquid - Market size and forecast 2025-2030 ($ million)
Chart on Liquid - Year-over-year growth 2025-2030 (%)
Data Table on Liquid - Year-over-year growth 2025-2030 (%)

10.4 Powder - Market size and forecast 2025-2030

Chart on Powder - Market size and forecast 2025-2030 ($ million)
Data Table on Powder - Market size and forecast 2025-2030 ($ million)
Chart on Powder - Year-over-year growth 2025-2030 (%)
Data Table on Powder - Year-over-year growth 2025-2030 (%)

10.5 Others - Market size and forecast 2025-2030

Chart on Others - Market size and forecast 2025-2030 ($ million)
Data Table on Others - Market size and forecast 2025-2030 ($ million)
Chart on Others - Year-over-year growth 2025-2030 (%)
Data Table on Others - Year-over-year growth 2025-2030 (%)

10.6 Market opportunity by Product

Market opportunity by Product ($ million)
Data Table on Market opportunity by Product ($ million)

11. Customer Landscape

11.1 Customer landscape overview

Analysis of price sensitivity, lifecycle, customer purchase basket, adoption rates, and purchase criteria

12. Geographic Landscape

12.1 Geographic segmentation

Chart on Market share by geography 2025-2030 (%)
Data Table on Market share by geography 2025-2030 (%)

12.2 Geographic comparison

Chart on Geographic comparison
Data Table on Geographic comparison

12.3 North America - Market size and forecast 2025-2030

Chart on North America - Market size and forecast 2025-2030 ($ million)
Data Table on North America - Market size and forecast 2025-2030 ($ million)
Chart on North America - Year-over-year growth 2025-2030 (%)
Data Table on North America - Year-over-year growth 2025-2030 (%)
Chart on Regional Comparison - North America
Data Table on Regional Comparison - North America

12.3.1 US - Market size and forecast 2025-2030

Chart on US - Market size and forecast 2025-2030 ($ million)
Data Table on US - Market size and forecast 2025-2030 ($ million)
Chart on US - Year-over-year growth 2025-2030 (%)
Data Table on US - Year-over-year growth 2025-2030 (%)

12.3.2 Canada - Market size and forecast 2025-2030

Chart on Canada - Market size and forecast 2025-2030 ($ million)
Data Table on Canada - Market size and forecast 2025-2030 ($ million)
Chart on Canada - Year-over-year growth 2025-2030 (%)
Data Table on Canada - Year-over-year growth 2025-2030 (%)

12.3.3 Mexico - Market size and forecast 2025-2030

Chart on Mexico - Market size and forecast 2025-2030 ($ million)
Data Table on Mexico - Market size and forecast 2025-2030 ($ million)
Chart on Mexico - Year-over-year growth 2025-2030 (%)
Data Table on Mexico - Year-over-year growth 2025-2030 (%)

12.4 APAC - Market size and forecast 2025-2030

Chart on APAC - Market size and forecast 2025-2030 ($ million)
Data Table on APAC - Market size and forecast 2025-2030 ($ million)
Chart on APAC - Year-over-year growth 2025-2030 (%)
Data Table on APAC - Year-over-year growth 2025-2030 (%)
Chart on Regional Comparison - APAC
Data Table on Regional Comparison - APAC

12.4.1 China - Market size and forecast 2025-2030

Chart on China - Market size and forecast 2025-2030 ($ million)
Data Table on China - Market size and forecast 2025-2030 ($ million)
Chart on China - Year-over-year growth 2025-2030 (%)
Data Table on China - Year-over-year growth 2025-2030 (%)

12.4.2 Japan - Market size and forecast 2025-2030

Chart on Japan - Market size and forecast 2025-2030 ($ million)
Data Table on Japan - Market size and forecast 2025-2030 ($ million)
Chart on Japan - Year-over-year growth 2025-2030 (%)
Data Table on Japan - Year-over-year growth 2025-2030 (%)

12.4.3 India - Market size and forecast 2025-2030

Chart on India - Market size and forecast 2025-2030 ($ million)
Data Table on India - Market size and forecast 2025-2030 ($ million)
Chart on India - Year-over-year growth 2025-2030 (%)
Data Table on India - Year-over-year growth 2025-2030 (%)

12.4.4 Indonesia - Market size and forecast 2025-2030

Chart on Indonesia - Market size and forecast 2025-2030 ($ million)
Data Table on Indonesia - Market size and forecast 2025-2030 ($ million)
Chart on Indonesia - Year-over-year growth 2025-2030 (%)
Data Table on Indonesia - Year-over-year growth 2025-2030 (%)

12.4.5 South Korea - Market size and forecast 2025-2030

Chart on South Korea - Market size and forecast 2025-2030 ($ million)
Data Table on South Korea - Market size and forecast 2025-2030 ($ million)
Chart on South Korea - Year-over-year growth 2025-2030 (%)
Data Table on South Korea - Year-over-year growth 2025-2030 (%)

12.4.6 Australia - Market size and forecast 2025-2030

Chart on Australia - Market size and forecast 2025-2030 ($ million)
Data Table on Australia - Market size and forecast 2025-2030 ($ million)
Chart on Australia - Year-over-year growth 2025-2030 (%)
Data Table on Australia - Year-over-year growth 2025-2030 (%)

12.5 Europe - Market size and forecast 2025-2030

Chart on Europe - Market size and forecast 2025-2030 ($ million)
Data Table on Europe - Market size and forecast 2025-2030 ($ million)
Chart on Europe - Year-over-year growth 2025-2030 (%)
Data Table on Europe - Year-over-year growth 2025-2030 (%)
Chart on Regional Comparison - Europe
Data Table on Regional Comparison - Europe

12.5.1 Germany - Market size and forecast 2025-2030

Chart on Germany - Market size and forecast 2025-2030 ($ million)
Data Table on Germany - Market size and forecast 2025-2030 ($ million)
Chart on Germany - Year-over-year growth 2025-2030 (%)
Data Table on Germany - Year-over-year growth 2025-2030 (%)

12.5.2 France - Market size and forecast 2025-2030

Chart on France - Market size and forecast 2025-2030 ($ million)
Data Table on France - Market size and forecast 2025-2030 ($ million)
Chart on France - Year-over-year growth 2025-2030 (%)
Data Table on France - Year-over-year growth 2025-2030 (%)

12.5.3 UK - Market size and forecast 2025-2030

Chart on UK - Market size and forecast 2025-2030 ($ million)
Data Table on UK - Market size and forecast 2025-2030 ($ million)
Chart on UK - Year-over-year growth 2025-2030 (%)
Data Table on UK - Year-over-year growth 2025-2030 (%)

12.5.4 Italy - Market size and forecast 2025-2030

Chart on Italy - Market size and forecast 2025-2030 ($ million)
Data Table on Italy - Market size and forecast 2025-2030 ($ million)
Chart on Italy - Year-over-year growth 2025-2030 (%)
Data Table on Italy - Year-over-year growth 2025-2030 (%)

12.5.5 The Netherlands - Market size and forecast 2025-2030

Chart on The Netherlands - Market size and forecast 2025-2030 ($ million)
Data Table on The Netherlands - Market size and forecast 2025-2030 ($ million)
Chart on The Netherlands - Year-over-year growth 2025-2030 (%)
Data Table on The Netherlands - Year-over-year growth 2025-2030 (%)

12.5.6 Spain - Market size and forecast 2025-2030

Chart on Spain - Market size and forecast 2025-2030 ($ million)
Data Table on Spain - Market size and forecast 2025-2030 ($ million)
Chart on Spain - Year-over-year growth 2025-2030 (%)
Data Table on Spain - Year-over-year growth 2025-2030 (%)

12.6 South America - Market size and forecast 2025-2030

Chart on South America - Market size and forecast 2025-2030 ($ million)
Data Table on South America - Market size and forecast 2025-2030 ($ million)
Chart on South America - Year-over-year growth 2025-2030 (%)
Data Table on South America - Year-over-year growth 2025-2030 (%)
Chart on Regional Comparison - South America
Data Table on Regional Comparison - South America

12.6.1 Brazil - Market size and forecast 2025-2030

Chart on Brazil - Market size and forecast 2025-2030 ($ million)
Data Table on Brazil - Market size and forecast 2025-2030 ($ million)
Chart on Brazil - Year-over-year growth 2025-2030 (%)
Data Table on Brazil - Year-over-year growth 2025-2030 (%)

12.6.2 Argentina - Market size and forecast 2025-2030

Chart on Argentina - Market size and forecast 2025-2030 ($ million)
Data Table on Argentina - Market size and forecast 2025-2030 ($ million)
Chart on Argentina - Year-over-year growth 2025-2030 (%)
Data Table on Argentina - Year-over-year growth 2025-2030 (%)

12.6.3 Chile - Market size and forecast 2025-2030

Chart on Chile - Market size and forecast 2025-2030 ($ million)
Data Table on Chile - Market size and forecast 2025-2030 ($ million)
Chart on Chile - Year-over-year growth 2025-2030 (%)
Data Table on Chile - Year-over-year growth 2025-2030 (%)

12.7 Middle East and Africa - Market size and forecast 2025-2030

Chart on Middle East and Africa - Market size and forecast 2025-2030 ($ million)
Data Table on Middle East and Africa - Market size and forecast 2025-2030 ($ million)
Chart on Middle East and Africa - Year-over-year growth 2025-2030 (%)
Data Table on Middle East and Africa - Year-over-year growth 2025-2030 (%)
Chart on Regional Comparison - Middle East and Africa
Data Table on Regional Comparison - Middle East and Africa

12.7.1 Saudi Arabia - Market size and forecast 2025-2030

Chart on Saudi Arabia - Market size and forecast 2025-2030 ($ million)
Data Table on Saudi Arabia - Market size and forecast 2025-2030 ($ million)
Chart on Saudi Arabia - Year-over-year growth 2025-2030 (%)
Data Table on Saudi Arabia - Year-over-year growth 2025-2030 (%)

12.7.2 UAE - Market size and forecast 2025-2030

Chart on UAE - Market size and forecast 2025-2030 ($ million)
Data Table on UAE - Market size and forecast 2025-2030 ($ million)
Chart on UAE - Year-over-year growth 2025-2030 (%)
Data Table on UAE - Year-over-year growth 2025-2030 (%)

12.7.3 South Africa - Market size and forecast 2025-2030

Chart on South Africa - Market size and forecast 2025-2030 ($ million)
Data Table on South Africa - Market size and forecast 2025-2030 ($ million)
Chart on South Africa - Year-over-year growth 2025-2030 (%)
Data Table on South Africa - Year-over-year growth 2025-2030 (%)

12.7.4 Turkey - Market size and forecast 2025-2030

Chart on Turkey - Market size and forecast 2025-2030 ($ million)
Data Table on Turkey - Market size and forecast 2025-2030 ($ million)
Chart on Turkey - Year-over-year growth 2025-2030 (%)
Data Table on Turkey - Year-over-year growth 2025-2030 (%)

12.7.5 Israel - Market size and forecast 2025-2030

Chart on Israel - Market size and forecast 2025-2030 ($ million)
Data Table on Israel - Market size and forecast 2025-2030 ($ million)
Chart on Israel - Year-over-year growth 2025-2030 (%)
Data Table on Israel - Year-over-year growth 2025-2030 (%)

12.8 Market opportunity by geography

Market opportunity by geography ($ million)
Data Tables on Market opportunity by geography ($ million)

13. Drivers, Challenges, and Opportunity

13.1 Market drivers

Growing demand for natural flavor ingredients in food and beverages
Increasing consumption of premium and clean-label products
Expanding application of vanilla in personal care and fragrance formulations

13.2 Market challenges

Limited geographic concentration of vanilla cultivation
Labor-intensity across pollination and curing processes
Volatile crop yields from climate variability

13.3 Impact of drivers and challenges

Impact of drivers and challenges in 2025 and 2030

13.4 Market opportunities

Increasing adoption of traceability-focused sourcing programs
Evolving sustainability certification practices across supply chains
Growing integration of AI-enabled quality assessment systems

14. Competitive Landscape

14.1 Overview

14.2

Overview on criticality of inputs and factors of differentiation

14.3 Landscape disruption

Overview on factors of disruption

14.4 Industry risks

Impact of key risks on business

15. Competitive Analysis

15.1 Companies profiled

Companies covered

15.2 Company ranking index

15.3 Market positioning of companies

Matrix on companies position and classification

15.4 Apex Flavors Inc.

Apex Flavors Inc. - Overview
Apex Flavors Inc. - Product / Service
Apex Flavors Inc. - Key offerings
SWOT

15.5 Blue Pacific Flavors

Blue Pacific Flavors - Overview
Blue Pacific Flavors - Product / Service
Blue Pacific Flavors - Key offerings
SWOT

15.6 Charles H. Baldwin and Sons

Charles H. Baldwin and Sons - Overview
Charles H. Baldwin and Sons - Product / Service
Charles H. Baldwin and Sons - Key offerings
SWOT

15.7 E.A. Weber and Co.

E.A. Weber and Co. - Overview
E.A. Weber and Co. - Product / Service
E.A. Weber and Co. - Key offerings
SWOT

15.8 Flavorchem Corp.

Flavorchem Corp. - Overview
Flavorchem Corp. - Product / Service
Flavorchem Corp. - Key offerings
SWOT

15.9 International Flavors Inc.

International Flavors Inc. - Overview
International Flavors Inc. - Business segments
International Flavors Inc. - Key news
International Flavors Inc. - Key offerings
International Flavors Inc. - Segment focus
SWOT

15.10 McCormick and Co. Inc.

McCormick and Co. Inc. - Overview
McCormick and Co. Inc. - Business segments
McCormick and Co. Inc. - Key offerings
McCormick and Co. Inc. - Segment focus
SWOT

15.11 Mikawaya

Mikawaya - Overview
Mikawaya - Product / Service
Mikawaya - Key offerings
SWOT

15.12 Natures Flavors

Natures Flavors - Overview
Natures Flavors - Product / Service
Natures Flavors - Key offerings
SWOT

15.13 Prova

Prova - Overview
Prova - Product / Service
Prova - Key offerings
SWOT

15.14 Sensient Flavors and Extracts

Sensient Flavors and Extracts - Overview
Sensient Flavors and Extracts - Product / Service
Sensient Flavors and Extracts - Key offerings
SWOT

15.15 Shanks Extracts Inc.

Shanks Extracts Inc. - Overview
Shanks Extracts Inc. - Product / Service
Shanks Extracts Inc. - Key offerings
SWOT

15.16 Synergy Flavors Inc.

Synergy Flavors Inc. - Overview
Synergy Flavors Inc. - Product / Service
Synergy Flavors Inc. - Key offerings
SWOT

15.17 Touton SA

Touton SA - Overview
Touton SA - Product / Service
Touton SA - Key offerings
SWOT

15.18 Virginia Dare

Virginia Dare - Overview
Virginia Dare - Product / Service
Virginia Dare - Key offerings
SWOT

16. Appendix

16.1 Scope of the report

Market definition
Objectives
Notes and caveats

16.2 Inclusions and exclusions checklist

Inclusions checklist
Exclusions checklist

16.3 Currency conversion rates for US$

16.4 Research methodology

16.5 Data procurement

Information sources

16.6 Data validation

16.7 Validation techniques employed for market sizing

16.8 Data synthesis

16.9 360 degree market analysis

16.10 List of abbreviations

Research Methodology

Technavio presents a detailed picture of the market by way of study, synthesis, and summation of data from multiple sources. The analysts have presented the various facets of the market with a particular focus on identifying the key industry influencers. The data thus presented is comprehensive, reliable, and the result of extensive research, both primary and secondary.

INFORMATION SOURCES

Primary sources

  • Manufacturers and suppliers
  • Channel partners
  • Industry experts
  • Strategic decision makers

Secondary sources

  • Industry journals and periodicals
  • Government data
  • Financial reports of key industry players
  • Historical data
  • Press releases

DATA ANALYSIS

Data Synthesis

  • Collation of data
  • Estimation of key figures
  • Analysis of derived insights

Data Validation

  • Triangulation with data models
  • Reference against proprietary databases
  • Corroboration with industry experts

REPORT WRITING

Qualitative

  • Market drivers
  • Market challenges
  • Market trends
  • Five forces analysis

Quantitative

  • Market size and forecast
  • Market segmentation
  • Geographical insights
  • Competitive landscape

Interested in this report?

Get your sample now to see our research methodology and insights!

Download Now

Frequently Asked Questions

Vanilla market growth will increase by USD 318.7 million during 2026-2030.

The Vanilla market is expected to grow at a CAGR of 5.1% during 2026-2030.

Vanilla market is segmented by Application (Food and beverages, Pharmaceuticals and cosmetics) Source (Synthetic, Natural) Product (Liquid, Powder, Others)

Apex Flavors Inc., Blue Pacific Flavors, Charles H. Baldwin and Sons, Cook Flavoring Co., E.A. Weber and Co., Eurovanille, Flavorchem Corp., I.D. Aromatic, International Flavors Inc., McCormick and Co. Inc., Mikawaya, Native Vanilla, Natures Flavors, Nielsen Massey Vanillas Inc., Prova, Rodelle Inc., Sensient Flavors and Extracts, Shanks Extracts Inc., Synergy Flavors Inc., Touton SA, Virginia Dare are a few of the key vendors in the Vanilla market.

APAC will register the highest growth rate of 31.8% among the other regions. Therefore, the Vanilla market in APAC is expected to garner significant business opportunities for the vendors during the forecast period.

US, Canada, Mexico, China, Japan, India, Indonesia, South Korea, Australia, Germany, France, UK, Italy, The Netherlands, Spain, Brazil, Argentina, Chile, Saudi Arabia, UAE, South Africa, Turkey, Israel

  • Growing demand for natural flavor ingredients in food and beverages is the driving factor this market.

The Vanilla market vendors should focus on grabbing business opportunities from the Application segment as it accounted for the largest market share in the base year.
RIA - Research AI Assistant
Ask RIA
