Vanillin Market Analysis, Size, and Forecast 2024-2028: North America (US and Canada), Europe (France, Germany, Italy, and UK), Middle East and Africa (Egypt, KSA, Oman, and UAE), APAC (China, India, and Japan), South America (Argentina and Brazil), and Rest of World (ROW)

Vanillin Market Analysis, Size, and Forecast 2024-2028:
North America (US and Canada), Europe (France, Germany, Italy, and UK), Middle East and Africa (Egypt, KSA, Oman, and UAE), APAC (China, India, and Japan), South America (Argentina and Brazil), and Rest of World (ROW)

Published: May 2024 171 Pages SKU: IRTNTR41386

Market Overview at a Glance

$510.1 Mn
Market Opportunity
11.87%
CAGR
10.29
YoY growth 2023-2024(%)

Vanillin Market Size 2024-2028

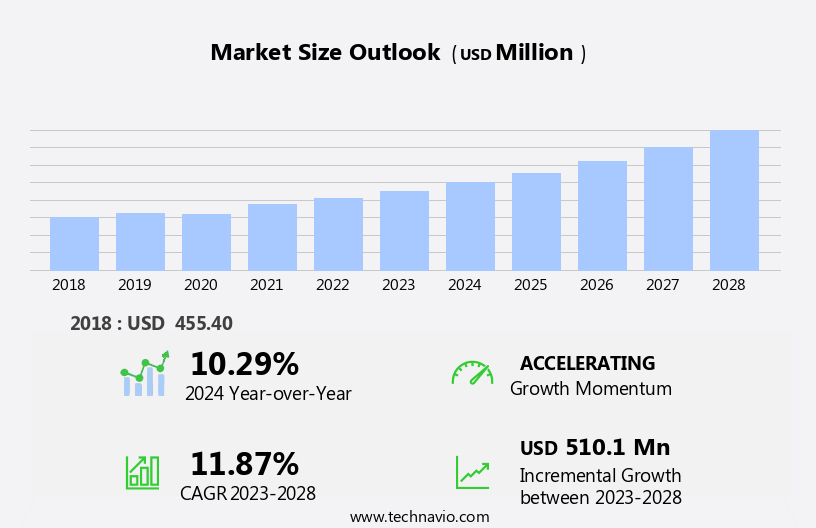
The vanillin market size is forecast to increase by USD 510.1 million, at a CAGR of 11.87% between 2023 and 2028.

  • The market is driven by the rising disposable incomes of consumers, leading to an increased demand for food and beverage products with natural flavors, including vanillin. The market encompasses a diverse range of industries, including confectioneries, ice cream, chocolates, alcoholic beverages, and the fragrance industry. This trend is further fueled by the emergence of environmentally friendly production processes using a catalyst, making vanillin production more sustainable and cost-effective. However, the market faces challenges due to the adverse effects of artificial food ingredients, leading to growing consumer preference for natural alternatives.
  • Companies seeking to capitalize on market opportunities should focus on developing and marketing natural vanillin products, while addressing the challenges of ensuring consistent quality and cost-competitiveness. Effective supply chain management and strategic partnerships will be crucial in navigating these challenges and staying competitive in the market.

What will be the Size of the Vanillin Market during the forecast period?

Vanillin Market Size

Explore in-depth regional segment analysis with market size data - historical 2018-2022 and forecasts 2024-2028 - in the full report.  
Request Free Sample

The market exhibits a dynamic and evolving nature, with various sectors continually integrating vanilla grade products into their offerings. Vanilla pods, an essential component of vanilla bean extract, are meticulously harvested and processed to produce high-quality vanilla flavoring. Indonesia and Madagascar are significant contributors to the global vanilla supply chain, with their unique terroirs influencing the distinct aroma and intensity of vanilla beans. Natural vanilla flavors, such as vanilla oleoresin and vanilla bean absolute, are highly sought after for their rich, complex taste. However, synthetic vanilla and flavor enhancers also play a role in the market, offering cost-effective alternatives.

The dairy industry extensively utilizes vanilla in ice cream and other dairy products, while bakery and confectionery applications showcase vanilla's versatility. Vanilla's presence extends to sauces and dressings, adding depth and complexity to various culinary creations. Vanilla pricing remains a critical factor, with market trends influencing the demand for organic, fair trade, and sustainably sourced vanilla. Vanilla processing and standardization are ongoing concerns, with certification programs ensuring product purity and consistency. Vanilla's applications continue to expand, with new markets emerging in the beverage, pharmaceutical, and fragrance industries. As the vanilla market unfolds, the interplay between various actors in the supply chain, regulatory frameworks, and consumer preferences shapes the evolving market landscape.

How is this Vanillin Industry segmented?

The vanillin industry research report provides comprehensive data (region-wise segment analysis), with forecasts and estimates in "USD million" for the period 2024-2028, as well as historical data from 2018-2022 for the following segments.

  • End-user
    • Food and beverages
    • Fragrances
    • Pharmaceuticals
  • Type
    • Natural vanillin
    • Synthetic vanillin
  • Distribution Channel
    • Direct Sales
    • Distributors
    • Online Platforms
  • Geography
    • North America
      • US
      • Canada
    • Europe
      • France
      • Germany
      • Italy
      • UK
    • Middle East and Africa
      • Egypt
      • KSA
      • Oman
      • UAE
    • APAC
      • China
      • India
      • Japan
    • South America
      • Argentina
      • Brazil
    • Rest of World (ROW)

By End-user Insights

The food and beverages segment is estimated to witness significant growth during the forecast period.

Vanillin, a key flavoring agent, finds extensive application in the food and beverage industry, particularly in sweets and desserts. Ethyl vanillin, with its edible flavor, is preferred for its ability to add or enhance odor. Vanilla beans, sourced from countries like Madagascar and Indonesia, are used for extraction, while synthetic vanillin is derived from lignin. Vanilla extract and paste, made from vanilla beans, are widely used in baking and confectionery. Vanilla bean powder and vanilla aroma are other popular forms of vanillin. Regulations govern the use of vanillin in food products, ensuring fair trade practices and organic farming. Vanilla processing involves curing and drying of vanilla beans, followed by extraction through methods like solvent extraction or steam distillation.

Vanilla oleoresin and vanilla bean absolute are obtained during this process. Vanillin is used in various applications, including ice cream, sauces and dressings, bakery and confectionery, and even in savory dishes. Vanilla intensity can be adjusted using flavor enhancers. Vanilla certification and standardization ensure consistent quality. Vanilla substitutes like synthetic vanilla and natural flavors are available, with synthetic vanilla being cost-effective but lacking the complex flavor profile of natural vanilla. Vanilla intensity and purity are crucial factors in determining the market price. The vanilla market is witnessing trends towards sustainability and ethical sourcing, with a growing preference for fair trade vanilla and organic vanilla.

Vanilla farming and processing techniques are evolving to meet these demands, ensuring a continuous supply of high-quality vanillin for the food and beverage industry.

Vanillin Market Size

Request Free Sample

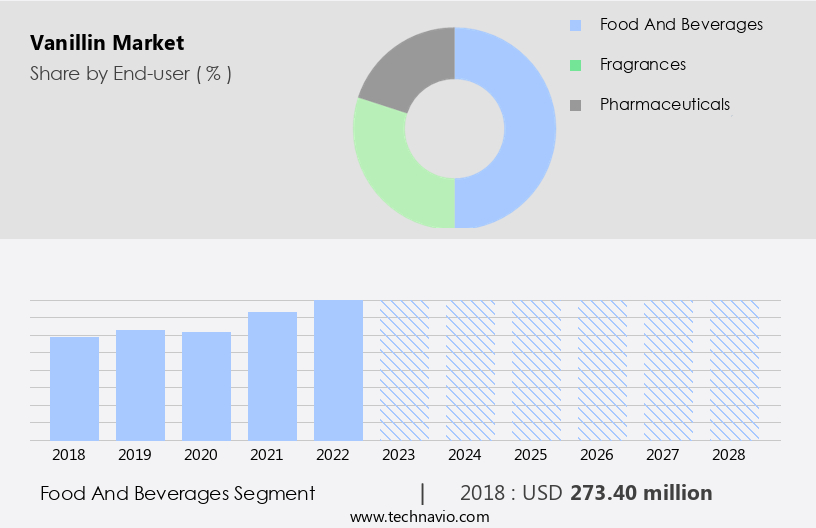
The Food and beverages segment was valued at USD 273.40 million in 2018 and showed a gradual increase during the forecast period.

Regional Analysis

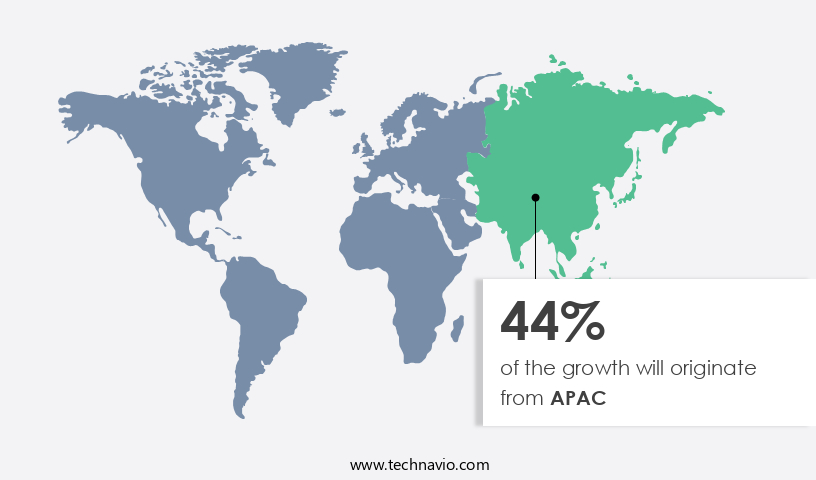
APAC is estimated to contribute 44% to the growth of the global market during the forecast period.Technavio's analysts have elaborately explained the regional trends and drivers that shape the market during the forecast period.

Vanillin Market Share by Geography

 Request Free Sample

In the global market, vanillin is a significant component in various food industries, particularly in dairy products and bakery and confectionery. The vanilla supply chain encompasses natural sources like vanilla beans from Madagascar and Indonesia, as well as synthetic alternatives. Vanilla bean extract and vanilla flavoring are essential ingredients in ice cream production, while vanilla bean powder and vanilla aroma are used in baking. Vanilla regulations ensure the quality and purity of vanilla products, with fair trade practices and organic farming gaining popularity. The vanilla market is diverse, including vanilla farming and processing in countries like Mexico, Tahitian, and Uganda.

Vanilla Mexico is known for its Bourbon and Tahitian varieties, while Madagascar produces the majority of the world's vanilla beans. Vanilla certification and standardization play a crucial role in maintaining consistency and enhancing flavor through the use of flavor enhancers and natural vanilla extract. The food flavors market is experiencing growth, especially in the Asia Pacific (APAC) region, where the demand for processed foods is increasing. Natural vanillin, derived from natural sources, is a popular choice for manufacturers due to its all-natural labeling and high market demand. For instance, BASF SE's Natural Vanillin F is a versatile ingredient used in various flavor applications, including chocolate, strawberry, and caramel.

Vanilla oleoresin, vanilla bean absolute, and vanilla bean resinoid are other forms of vanilla used in various applications, such as sauces and dressings, perfumes, and pharmaceuticals. Vanilla pricing remains a crucial factor, with synthetic vanilla and organic vanilla having different price points. Vanilla intensity, a measure of the strength of vanilla flavor, is also a consideration for manufacturers and consumers alike. In conclusion, the vanilla market is a dynamic and evolving industry, with various applications, forms, and sources. The food industry, particularly dairy products and bakery and confectionery, is a significant consumer of vanillin. The growth of the food flavors market, particularly in the APAC region, is driving the demand for natural vanillin and other vanilla derivatives.

Sustainability and ethical sourcing are also becoming increasingly important in the vanilla market.

Market Dynamics

Our researchers analyzed the data with 2023 as the base year, along with the key drivers, trends, and challenges. A holistic analysis of drivers will help companies refine their marketing strategies to gain a competitive advantage.

What are the key market drivers leading to the rise in the adoption of Vanillin Industry?

  • Disposable income growth serves as the primary catalyst for market expansion. 
  • The market is experiencing significant growth due to the limited supply of natural vanilla beans. Vanilla is a luxury crop with a small production scale, making it subject to constant price fluctuations. Madagascar, the world's largest vanilla producer, faced lower production in 2022 due to weak flowering in key growing areas. This resulted in a supply shortage and the availability of low-quality vanilla. In the vanilla supply chain, both vanilla bean extract and vanilla flavoring are essential components. Vanilla bean powder and vanilla aroma are other derivatives used in various industries, including dairy products and ice cream.
  • Vanilla extraction is a crucial process to obtain these products, and regulations play a significant role in ensuring their quality. Vanilla Indonesia and Vanilla Madagascar are major sources of natural vanilla beans. However, the limited supply and quality issues have led to an increased interest in synthetic vanillin production. The market dynamics are influenced by various factors, including production challenges, demand trends, and regulatory requirements. In conclusion, the market is expected to continue growing due to the limited supply of natural vanilla and the demand for vanilla derivatives in various industries. Ensuring a consistent and high-quality supply of vanilla and its derivatives remains a significant challenge for the market.

What are the market trends shaping the Vanillin Industry?

  • The emergence of environmentally friendly production processes utilizing catalysts is a significant market trend. This sustainable approach to manufacturing is gaining increasing attention and acceptance in industries seeking to reduce their carbon footprint and comply with environmental regulations.
  • Vanillin, a key flavor compound derived primarily from vanilla orchids, experiences increasing demand due to consumer preference for natural food products. However, the scarcity of natural vanillin, as less than 1% is derived from its original source, necessitates synthetic production. This synthetic process involves the use of guaiacol, a petroleum-derived precursor, and tree lignin, among other substances. In response to environmental concerns, researchers are exploring eco-friendly methods for vanillin production. For instance, a study published in May 2022 by researchers at Hubei University, Wuhan, China, detailed the biosynthesis of vanillin using Bacillus pumilus bacteria as guaiacyl precursors.
  • This innovative approach offers potential for sustainable vanillin production, aligning with the growing emphasis on fair trade and organic vanilla farming and processing methods in the bakery and confectionery industry. Vanilla standardization and the use of flavor enhancers also influence the market dynamics. Certification programs, such as those for fair trade vanilla, further impact the industry landscape.

What challenges does the Vanillin Industry face during its growth?

  • The growth of the food industry is significantly impacted by the adverse effects associated with the use of artificial food ingredients. 
  • The market is driven by consumers' growing preference for natural Food Additives over synthetic and artificial ingredients. With increasing health consciousness, consumers are seeking food and beverage products with clean, green labels, leading to a significant demand for natural vanillin derived from vanilla pods, vanilla bean absolute, and vanilla bean resinoid. Natural vanillin, also known as Bio Vanillin, is gaining popularity due to its health benefits and absence of long-term side effects associated with synthetic vanillin. The natural the market is expected to grow as consumers become more aware of the potential health risks of chemically synthesized ingredients, such as toxicity, allergies, and other health issues.
  • Vanillin is used extensively in various food applications, including sauces and dressings, and its natural form is increasingly being adopted in these sectors. Vanillin pricing remains a crucial factor in the market, with natural vanillin typically commanding a premium over synthetic vanillin. Other natural flavorings, such as vanilla oleoresin and vanilla extract, as well as vanilla paste, are also gaining traction in the market due to their natural origins and health benefits.

Exclusive Customer Landscape

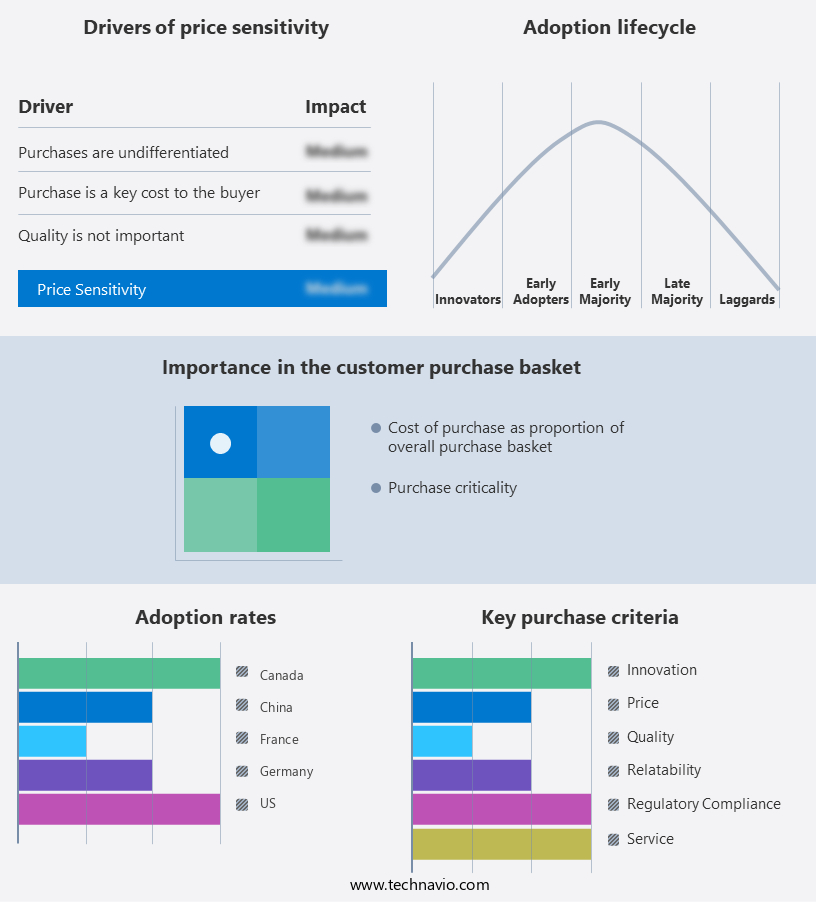
The vanillin market forecasting report includes the adoption lifecycle of the market, covering from the innovator's stage to the laggard's stage. It focuses on adoption rates in different regions based on penetration. Furthermore, the vanillin market report also includes key purchase criteria and drivers of price sensitivity to help companies evaluate and develop their market growth analysis strategies.

Vanillin Market Share by Geography

 Customer Landscape

Key Companies & Market Insights

Companies are implementing various strategies, such as strategic alliances, vanillin market forecast, partnerships, mergers and acquisitions, geographical expansion, and product/service launches, to enhance their presence in the industry.

The industry research and growth report includes detailed analyses of the competitive landscape of the market and information about key companies, including:

  • Advanced Biotech
  • Apple Flavor and Fragrance Group Co. Ltd.
  • Aurochemicals
  • Axxence Aromatic GmbH
  • BASF SE
  • Borregaard ASA
  • BRENNTAG SE
  • Camlin Fine Sciences Ltd.
  • Comax MFG Corp.
  • De Monchy Aromatics Ltd.
  • Evolva Holding AG
  • Jiaxing Zhonghua Chemical Co. Ltd.
  • Lesaffre and Cie
  • Liaoning Shixing Pharmaceutical and Chemical Co. Ltd.
  • Merck KGaA
  • Omega Ingredients Ltd.
  • Solvay SA
  • TANOBIO
  • Viachem Inc.
  • Vigon International Inc.

Qualitative and quantitative analysis of companies has been conducted to help clients understand the wider business environment as well as the strengths and weaknesses of key industry players. Data is qualitatively analyzed to categorize companies as pure play, category-focused, industry-focused, and diversified; it is quantitatively analyzed to categorize companies as dominant, leading, strong, tentative, and weak.

Recent Development and News in Vanillin Market

  • In February 2024, DuPont Nutrition & Biosciences, a leading global producer of vanillin, announced the expansion of its production capacity at its manufacturing site in Tate, Georgia, USA. This USD30 million investment aimed to increase the company's vanillin output by 25%, strengthening its market position (DuPont Press Release, 2024).
  • In May 2024, Firmenich, the world's largest privately-owned fragrance and flavor company, entered into a strategic partnership with Biotech Marchese, an Italian biotech firm specializing in natural vanillin production. This collaboration aimed to leverage Biotech Marchese's proprietary biotechnological process to produce sustainable vanillin for Firmenich's customers (Firmenich Press Release, 2024).
  • In October 2024, Sigma-Aldrich, a leading life science and high-tech material supplier, launched a new line of natural vanillin for research applications. This offering catered to the growing demand for natural ingredients in scientific research and development (Sigma-Aldrich Press Release, 2024).
  • In January 2025, the European Commission approved the use of synthetic vanillin in food and beverages, marking a significant policy change for the European market. This decision followed extensive discussions and debates regarding the safety and sustainability of natural vanillin sources (European Commission Press Release, 2025).

Research Analyst Overview

  • The vanilla market encompasses various segments, including imitation and natural vanilla, each with unique characteristics and demand patterns. Vanilla demand forecasting is crucial for businesses to prepare for fluctuating market trends and price volatility. Sustainability practices, such as ethical sourcing and biotechnology, are increasingly shaping the industry. Vanilla's symbolism, flavor profile, and health benefits continue to fuel consumer preferences, driving innovation and product development. Vanilla's traceability and quality control are essential aspects of the market, ensuring authenticity and consumer trust. Vanillin concentration and sensory analysis are key components of vanilla technology, enabling producers to optimize production and meet evolving consumer demands.
  • The literature on vanilla offers valuable insights into its history, cultural significance, and therapeutic uses. Vanilla's aroma compounds and adulteration are topics of ongoing research, with advancements in technology and ethical sourcing playing a significant role in mitigating issues. Vanilla's etymology and consumer preferences are also subjects of interest, shedding light on the market's rich history and future trends. Overall, the vanilla market outlook remains dynamic, with various factors influencing its growth and evolution.

Dive into Technavio's robust research methodology, blending expert interviews, extensive data synthesis, and validated models for unparalleled Vanillin Market insights. See full methodology.

Market Scope

Report Coverage

Details

Page number

171

Base year

2023

Historic period

2018-2022

Forecast period

2024-2028

Growth momentum & CAGR

Accelerate at a CAGR of 11.87%

Market growth 2024-2028

USD 510.1 million

Market structure

Fragmented

YoY growth 2023-2024(%)

10.29

Key countries

China, US, Germany, France, and Canada

Competitive landscape

Leading Companies, Market Positioning of Companies, Competitive Strategies, and Industry Risks

Request Free Sample

What are the Key Data Covered in this Vanillin Market Research and Growth Report?

  • CAGR of the Vanillin industry during the forecast period
  • Detailed information on factors that will drive the growth and forecasting between 2024 and 2028
  • Precise estimation of the size of the market and its contribution of the industry in focus to the parent market
  • Accurate predictions about upcoming growth and trends and changes in consumer behaviour
  • Growth of the market across APAC, Europe, North America, Middle East and Africa, and South America
  • Thorough analysis of the market's competitive landscape and detailed information about companies
  • Comprehensive analysis of factors that will challenge the vanillin market growth of industry companies

We can help! Our analysts can customize this vanillin market research report to meet your requirements.

Get in touch

1 Executive Summary

  • 1.1 Market overview
    • Executive Summary - Chart on Market Overview
    • Executive Summary - Data Table on Market Overview
    • Executive Summary - Chart on Global Market Characteristics
    • Executive Summary - Chart on Market by Geography
    • Executive Summary - Chart on Market Segmentation by End-user
    • Executive Summary - Chart on Market Segmentation by Type
    • Executive Summary - Chart on Incremental Growth
    • Executive Summary - Data Table on Incremental Growth
    • Executive Summary - Chart on Company Market Positioning

2 Market Landscape

  • 2.1 Market ecosystem
    • Parent Market
    • Data Table on - Parent Market
  • 2.2 Market characteristics
    • Market characteristics analysis
  • 2.3 Value chain analysis
    • Value Chain Analysis

3 Market Sizing

  • 3.1 Market definition
    • Offerings of companies included in the market definition
  • 3.2 Market segment analysis
    • Market segments
  • 3.3 Market size 2023
    • 3.4 Market outlook: Forecast for 2023-2028
      • Chart on Global - Market size and forecast 2023-2028 ($ million)
      • Data Table on Global - Market size and forecast 2023-2028 ($ million)
      • Chart on Global Market: Year-over-year growth 2023-2028 (%)
      • Data Table on Global Market: Year-over-year growth 2023-2028 (%)

    4 Historic Market Size

    • 4.1 Global Vanillin 2018 - 2022
      • Historic Market Size - Data Table on Global Vanillin 2018 - 2022 ($ million)
    • 4.2 End-user segment analysis 2018 - 2022
      • Historic Market Size - End-user Segment 2018 - 2022 ($ million)
    • 4.3 Type segment analysis 2018 - 2022
      • Historic Market Size - Type Segment 2018 - 2022 ($ million)
    • 4.4 Geography segment analysis 2018 - 2022
      • Historic Market Size - Geography Segment 2018 - 2022 ($ million)
    • 4.5 Country segment analysis 2018 - 2022
      • Historic Market Size - Country Segment 2018 - 2022 ($ million)

    5 Five Forces Analysis

    • 5.1 Five forces summary
      • Five forces analysis - Comparison between 2023 and 2028
    • 5.2 Bargaining power of buyers
      • Bargaining power of buyers - Impact of key factors 2023 and 2028
    • 5.3 Bargaining power of suppliers
      • Bargaining power of suppliers - Impact of key factors in 2023 and 2028
    • 5.4 Threat of new entrants
      • Threat of new entrants - Impact of key factors in 2023 and 2028
    • 5.5 Threat of substitutes
      • Threat of substitutes - Impact of key factors in 2023 and 2028
    • 5.6 Threat of rivalry
      • Threat of rivalry - Impact of key factors in 2023 and 2028
    • 5.7 Market condition
      • Chart on Market condition - Five forces 2023 and 2028

    6 Market Segmentation by End-user

    • 6.1 Market segments
      • Chart on End-user - Market share (2023-2028) (%)
      • Data Table on End-user - Market share (2023-2028) (%)
    • 6.2 Comparison by End-user
      • Chart on Comparison by End-user
      • Data Table on Comparison by End-user
    • 6.3 Food and beverages - Market size and forecast (2023-2028)
      • Chart on Food and beverages - Market size and forecast (2023-2028) ($ million)
      • Data Table on Food and beverages - Market size and forecast (2023-2028) ($ million)
      • Chart on Food and beverages - Year-over-year growth (2023-2028) (%)
      • Data Table on Food and beverages - Year-over-year growth (2023-2028) (%)
    • 6.4 Fragrances - Market size and forecast (2023-2028)
      • Chart on Fragrances - Market size and forecast (2023-2028) ($ million)
      • Data Table on Fragrances - Market size and forecast (2023-2028) ($ million)
      • Chart on Fragrances - Year-over-year growth (2023-2028) (%)
      • Data Table on Fragrances - Year-over-year growth (2023-2028) (%)
    • 6.5 Pharmaceuticals - Market size and forecast (2023-2028)
      • Chart on Pharmaceuticals - Market size and forecast (2023-2028) ($ million)
      • Data Table on Pharmaceuticals - Market size and forecast (2023-2028) ($ million)
      • Chart on Pharmaceuticals - Year-over-year growth (2023-2028) (%)
      • Data Table on Pharmaceuticals - Year-over-year growth (2023-2028) (%)
    • 6.6 Market opportunity by End-user
      • Market opportunity by End-user ($ million)
      • Data Table on Market opportunity by End-user ($ million)

    7 Market Segmentation by Type

    • 7.1 Market segments
      • Chart on Type - Market share (2023-2028) (%)
      • Data Table on Type - Market share (2023-2028) (%)
    • 7.2 Comparison by Type
      • Chart on Comparison by Type
      • Data Table on Comparison by Type
    • 7.3 Natural vanillin - Market size and forecast (2023-2028)
      • Chart on Natural vanillin - Market size and forecast (2023-2028) ($ million)
      • Data Table on Natural vanillin - Market size and forecast (2023-2028) ($ million)
      • Chart on Natural vanillin - Year-over-year growth (2023-2028) (%)
      • Data Table on Natural vanillin - Year-over-year growth (2023-2028) (%)
    • 7.4 Synthetic vanillin - Market size and forecast (2023-2028)
      • Chart on Synthetic vanillin - Market size and forecast (2023-2028) ($ million)
      • Data Table on Synthetic vanillin - Market size and forecast (2023-2028) ($ million)
      • Chart on Synthetic vanillin - Year-over-year growth (2023-2028) (%)
      • Data Table on Synthetic vanillin - Year-over-year growth (2023-2028) (%)
    • 7.5 Market opportunity by Type
      • Market opportunity by Type ($ million)
      • Data Table on Market opportunity by Type ($ million)

    8 Market Segmentation by Distribution Channel

    • 8.1 Market segments
      • Chart on Distribution Channel - Market share (2023-2028) (%)
      • Data Table on Distribution Channel - Market share (2023-2028) (%)
    • 8.2 Comparison by Distribution Channel
      • Chart on Comparison by Distribution Channel
      • Data Table on Comparison by Distribution Channel
    • 8.3 Direct Sales - Market size and forecast (2023-2028)
      • Chart on Direct Sales - Market size and forecast (2023-2028) ($ million)
      • Data Table on Direct Sales - Market size and forecast (2023-2028) ($ million)
      • Chart on Direct Sales - Year-over-year growth (2023-2028) (%)
      • Data Table on Direct Sales - Year-over-year growth (2023-2028) (%)
    • 8.4 Distributors - Market size and forecast (2023-2028)
      • Chart on Distributors - Market size and forecast (2023-2028) ($ million)
      • Data Table on Distributors - Market size and forecast (2023-2028) ($ million)
      • Chart on Distributors - Year-over-year growth (2023-2028) (%)
      • Data Table on Distributors - Year-over-year growth (2023-2028) (%)
    • 8.5 Online Platforms - Market size and forecast (2023-2028)
      • Chart on Online Platforms - Market size and forecast (2023-2028) ($ million)
      • Data Table on Online Platforms - Market size and forecast (2023-2028) ($ million)
      • Chart on Online Platforms - Year-over-year growth (2023-2028) (%)
      • Data Table on Online Platforms - Year-over-year growth (2023-2028) (%)
    • 8.6 Market opportunity by Distribution Channel
      • Market opportunity by Distribution Channel ($ million)
      • Data Table on Market opportunity by Distribution Channel ($ million)

    9 Customer Landscape

    • 9.1 Customer landscape overview
      • Analysis of price sensitivity, lifecycle, customer purchase basket, adoption rates, and purchase criteria

    10 Geographic Landscape

    • 10.1 Geographic segmentation
      • Chart on Market share by geography 2023-2028 (%)
      • Data Table on Market share by geography 2023-2028 (%)
    • 10.2 Geographic comparison
      • Chart on Geographic comparison
      • Data Table on Geographic comparison
    • 10.3 APAC - Market size and forecast 2023-2028
      • Chart on APAC - Market size and forecast 2023-2028 ($ million)
      • Data Table on APAC - Market size and forecast 2023-2028 ($ million)
      • Chart on APAC - Year-over-year growth 2023-2028 (%)
      • Data Table on APAC - Year-over-year growth 2023-2028 (%)
    • 10.4 Europe - Market size and forecast 2023-2028
      • Chart on Europe - Market size and forecast 2023-2028 ($ million)
      • Data Table on Europe - Market size and forecast 2023-2028 ($ million)
      • Chart on Europe - Year-over-year growth 2023-2028 (%)
      • Data Table on Europe - Year-over-year growth 2023-2028 (%)
    • 10.5 North America - Market size and forecast 2023-2028
      • Chart on North America - Market size and forecast 2023-2028 ($ million)
      • Data Table on North America - Market size and forecast 2023-2028 ($ million)
      • Chart on North America - Year-over-year growth 2023-2028 (%)
      • Data Table on North America - Year-over-year growth 2023-2028 (%)
    • 10.6 Middle East and Africa - Market size and forecast 2023-2028
      • Chart on Middle East and Africa - Market size and forecast 2023-2028 ($ million)
      • Data Table on Middle East and Africa - Market size and forecast 2023-2028 ($ million)
      • Chart on Middle East and Africa - Year-over-year growth 2023-2028 (%)
      • Data Table on Middle East and Africa - Year-over-year growth 2023-2028 (%)
    • 10.7 South America - Market size and forecast 2023-2028
      • Chart on South America - Market size and forecast 2023-2028 ($ million)
      • Data Table on South America - Market size and forecast 2023-2028 ($ million)
      • Chart on South America - Year-over-year growth 2023-2028 (%)
      • Data Table on South America - Year-over-year growth 2023-2028 (%)
    • 10.8 China - Market size and forecast 2023-2028
      • Chart on China - Market size and forecast 2023-2028 ($ million)
      • Data Table on China - Market size and forecast 2023-2028 ($ million)
      • Chart on China - Year-over-year growth 2023-2028 (%)
      • Data Table on China - Year-over-year growth 2023-2028 (%)
    • 10.9 US - Market size and forecast 2023-2028
      • Chart on US - Market size and forecast 2023-2028 ($ million)
      • Data Table on US - Market size and forecast 2023-2028 ($ million)
      • Chart on US - Year-over-year growth 2023-2028 (%)
      • Data Table on US - Year-over-year growth 2023-2028 (%)
    • 10.10 Germany - Market size and forecast 2023-2028
      • Chart on Germany - Market size and forecast 2023-2028 ($ million)
      • Data Table on Germany - Market size and forecast 2023-2028 ($ million)
      • Chart on Germany - Year-over-year growth 2023-2028 (%)
      • Data Table on Germany - Year-over-year growth 2023-2028 (%)
    • 10.11 France - Market size and forecast 2023-2028
      • Chart on France - Market size and forecast 2023-2028 ($ million)
      • Data Table on France - Market size and forecast 2023-2028 ($ million)
      • Chart on France - Year-over-year growth 2023-2028 (%)
      • Data Table on France - Year-over-year growth 2023-2028 (%)
    • 10.12 Canada - Market size and forecast 2023-2028
      • Chart on Canada - Market size and forecast 2023-2028 ($ million)
      • Data Table on Canada - Market size and forecast 2023-2028 ($ million)
      • Chart on Canada - Year-over-year growth 2023-2028 (%)
      • Data Table on Canada - Year-over-year growth 2023-2028 (%)
    • 10.13 Market opportunity by geography
      • Market opportunity by geography ($ million)
      • Data Tables on Market opportunity by geography ($ million)
    • 10.14 UK - Market size and forecast (2023-2028)
      • Chart on UK - Market size and forecast (2023-2028) ($ million)
      • Data Table on UK - Market size and forecast (2023-2028) ($ million)
      • Chart on UK - Year-over-year growth (2023-2028) (%)
      • Data Table on UK - Year-over-year growth (2023-2028) (%)
    • 10.15 Italy - Market size and forecast (2023-2028)
      • Chart on Italy - Market size and forecast (2023-2028) ($ million)
      • Data Table on Italy - Market size and forecast (2023-2028) ($ million)
      • Chart on Italy - Year-over-year growth (2023-2028) (%)
      • Data Table on Italy - Year-over-year growth (2023-2028) (%)
    • 10.16 India - Market size and forecast (2023-2028)
      • Chart on India - Market size and forecast (2023-2028) ($ million)
      • Data Table on India - Market size and forecast (2023-2028) ($ million)
      • Chart on India - Year-over-year growth (2023-2028) (%)
      • Data Table on India - Year-over-year growth (2023-2028) (%)
    • 10.17 Japan - Market size and forecast (2023-2028)
      • Chart on Japan - Market size and forecast (2023-2028) ($ million)
      • Data Table on Japan - Market size and forecast (2023-2028) ($ million)
      • Chart on Japan - Year-over-year growth (2023-2028) (%)
      • Data Table on Japan - Year-over-year growth (2023-2028) (%)
    • 10.18 Brazil - Market size and forecast (2023-2028)
      • Chart on Brazil - Market size and forecast (2023-2028) ($ million)
      • Data Table on Brazil - Market size and forecast (2023-2028) ($ million)
      • Chart on Brazil - Year-over-year growth (2023-2028) (%)
      • Data Table on Brazil - Year-over-year growth (2023-2028) (%)
    • 10.19 Egypt - Market size and forecast (2023-2028)
      • Chart on Egypt - Market size and forecast (2023-2028) ($ million)
      • Data Table on Egypt - Market size and forecast (2023-2028) ($ million)
      • Chart on Egypt - Year-over-year growth (2023-2028) (%)
      • Data Table on Egypt - Year-over-year growth (2023-2028) (%)
    • 10.20 UAE - Market size and forecast (2023-2028)
      • Chart on UAE - Market size and forecast (2023-2028) ($ million)
      • Data Table on UAE - Market size and forecast (2023-2028) ($ million)
      • Chart on UAE - Year-over-year growth (2023-2028) (%)
      • Data Table on UAE - Year-over-year growth (2023-2028) (%)
    • 10.21 Oman - Market size and forecast (2023-2028)
      • Chart on Oman - Market size and forecast (2023-2028) ($ million)
      • Data Table on Oman - Market size and forecast (2023-2028) ($ million)
      • Chart on Oman - Year-over-year growth (2023-2028) (%)
      • Data Table on Oman - Year-over-year growth (2023-2028) (%)
    • 10.22 Argentina - Market size and forecast (2023-2028)
      • Chart on Argentina - Market size and forecast (2023-2028) ($ million)
      • Data Table on Argentina - Market size and forecast (2023-2028) ($ million)
      • Chart on Argentina - Year-over-year growth (2023-2028) (%)
      • Data Table on Argentina - Year-over-year growth (2023-2028) (%)
    • 10.23 KSA - Market size and forecast (2023-2028)
      • Chart on KSA - Market size and forecast (2023-2028) ($ million)
      • Data Table on KSA - Market size and forecast (2023-2028) ($ million)
      • Chart on KSA - Year-over-year growth (2023-2028) (%)
      • Data Table on KSA - Year-over-year growth (2023-2028) (%)
    • 10.24 Rest of World (ROW) - Market size and forecast (2023-2028)
      • Chart on Rest of World (ROW) - Market size and forecast (2023-2028) ($ million)
      • Data Table on Rest of World (ROW) - Market size and forecast (2023-2028) ($ million)
      • Chart on Rest of World (ROW) - Year-over-year growth (2023-2028) (%)
      • Data Table on Rest of World (ROW) - Year-over-year growth (2023-2028) (%)

    11 Drivers, Challenges, and Opportunity/Restraints

    • 11.1 Market drivers
      • 11.2 Market challenges
        • 11.3 Impact of drivers and challenges
          • Impact of drivers and challenges in 2023 and 2028
        • 11.4 Market opportunities/restraints

          12 Competitive Landscape

          • 12.1 Overview
            • 12.2 Competitive Landscape
              • Overview on criticality of inputs and factors of differentiation
            • 12.3 Landscape disruption
              • Overview on factors of disruption
            • 12.4 Industry risks
              • Impact of key risks on business

            13 Competitive Analysis

            • 13.1 Companies profiled
              • Companies covered
            • 13.2 Market positioning of companies
              • Matrix on companies position and classification
            • 13.3 Advanced Biotech
              • Advanced Biotech - Overview
              • Advanced Biotech - Product / Service
              • Advanced Biotech - Key offerings
            • 13.4 Apple Flavor and Fragrance Group Co. Ltd.
              • Apple Flavor and Fragrance Group Co. Ltd. - Overview
              • Apple Flavor and Fragrance Group Co. Ltd. - Product / Service
              • Apple Flavor and Fragrance Group Co. Ltd. - Key offerings
            • 13.5 Aurochemicals
              • Aurochemicals - Overview
              • Aurochemicals - Product / Service
              • Aurochemicals - Key offerings
            • 13.6 Axxence Aromatic GmbH
              • Axxence Aromatic GmbH - Overview
              • Axxence Aromatic GmbH - Product / Service
              • Axxence Aromatic GmbH - Key offerings
            • 13.7 BASF SE
              • BASF SE - Overview
              • BASF SE - Business segments
              • BASF SE - Key news
              • BASF SE - Key offerings
              • BASF SE - Segment focus
            • 13.8 Borregaard ASA
              • Borregaard ASA - Overview
              • Borregaard ASA - Business segments
              • Borregaard ASA - Key offerings
              • Borregaard ASA - Segment focus
            • 13.9 BRENNTAG SE
              • BRENNTAG SE - Overview
              • BRENNTAG SE - Business segments
              • BRENNTAG SE - Key offerings
              • BRENNTAG SE - Segment focus
            • 13.10 Camlin Fine Sciences Ltd.
              • Camlin Fine Sciences Ltd. - Overview
              • Camlin Fine Sciences Ltd. - Product / Service
              • Camlin Fine Sciences Ltd. - Key offerings
            • 13.11 De Monchy Aromatics Ltd.
              • De Monchy Aromatics Ltd. - Overview
              • De Monchy Aromatics Ltd. - Product / Service
              • De Monchy Aromatics Ltd. - Key offerings
            • 13.12 Evolva Holding AG
              • Evolva Holding AG - Overview
              • Evolva Holding AG - Product / Service
              • Evolva Holding AG - Key offerings
            • 13.13 Jiaxing Zhonghua Chemical Co. Ltd.
              • Jiaxing Zhonghua Chemical Co. Ltd. - Overview
              • Jiaxing Zhonghua Chemical Co. Ltd. - Product / Service
              • Jiaxing Zhonghua Chemical Co. Ltd. - Key offerings
            • 13.14 Lesaffre and Cie
              • Lesaffre and Cie - Overview
              • Lesaffre and Cie - Product / Service
              • Lesaffre and Cie - Key offerings
            • 13.15 Merck KGaA
              • Merck KGaA - Overview
              • Merck KGaA - Business segments
              • Merck KGaA - Key news
              • Merck KGaA - Key offerings
              • Merck KGaA - Segment focus
            • 13.16 Solvay SA
              • Solvay SA - Overview
              • Solvay SA - Business segments
              • Solvay SA - Key news
              • Solvay SA - Key offerings
              • Solvay SA - Segment focus
            • 13.17 TANOBIO
              • TANOBIO - Overview
              • TANOBIO - Product / Service
              • TANOBIO - Key offerings

            14 Appendix

            • 14.1 Scope of the report
              • 14.2 Inclusions and exclusions checklist
                • Inclusions checklist
                • Exclusions checklist
              • 14.3 Currency conversion rates for US$
                • Currency conversion rates for US$
              • 14.4 Research methodology
                • Research methodology
              • 14.5 Data procurement
                • Information sources
              • 14.6 Data validation
                • Data validation
              • 14.7 Validation techniques employed for market sizing
                • Validation techniques employed for market sizing
              • 14.8 Data synthesis
                • Data synthesis
              • 14.9 360 degree market analysis
                • 360 degree market analysis
              • 14.10 List of abbreviations
                • List of abbreviations

              Research Methodology

              Technavio presents a detailed picture of the market by way of study, synthesis, and summation of data from multiple sources. The analysts have presented the various facets of the market with a particular focus on identifying the key industry influencers. The data thus presented is comprehensive, reliable, and the result of extensive research, both primary and secondary.

              INFORMATION SOURCES

              Primary sources

              • Manufacturers and suppliers
              • Channel partners
              • Industry experts
              • Strategic decision makers

              Secondary sources

              • Industry journals and periodicals
              • Government data
              • Financial reports of key industry players
              • Historical data
              • Press releases

              DATA ANALYSIS

              Data Synthesis

              • Collation of data
              • Estimation of key figures
              • Analysis of derived insights

              Data Validation

              • Triangulation with data models
              • Reference against proprietary databases
              • Corroboration with industry experts

              REPORT WRITING

              Qualitative

              • Market drivers
              • Market challenges
              • Market trends
              • Five forces analysis

              Quantitative

              • Market size and forecast
              • Market segmentation
              • Geographical insights
              • Competitive landscape

              Interested in this report?

              Get your sample now to see our research methodology and insights!

              Download Now

              Frequently Asked Questions

              Vanillin market growth will increase by $ 510.1 mn during 2024-2028.

              The Vanillin market is expected to grow at a CAGR of 11.87% during 2024-2028.

              Vanillin market is segmented by End-user( Food and beverages, Fragrances, Pharmaceuticals) Type( Natural vanillin, Synthetic vanillin, North America, MEA, South America)

              Advanced Biotech, Apple Flavor and Fragrance Group Co. Ltd., Aurochemicals, Axxence Aromatic GmbH, BASF SE, Borregaard ASA, BRENNTAG SE, Camlin Fine Sciences Ltd., Comax MFG Corp., De Monchy Aromatics Ltd., Evolva Holding AG, Jiaxing Zhonghua Chemical Co. Ltd., Lesaffre and Cie, Liaoning Shixing Pharmaceutical and Chemical Co. Ltd., Merck KGaA, Omega Ingredients Ltd., Solvay SA, TANOBIO, Viachem Inc., Vigon International Inc. are a few of the key vendors in the Vanillin market.

              APAC will register the highest growth rate of 44% among the other regions. Therefore, the Vanillin market in APAC is expected to garner significant business opportunities for the vendors during the forecast period.

              US, Canada, Germany, UK, Italy, France, China, India, Japan, Brazil, Egypt, UAE, Oman, Argentina, KSA, UAE, Brazil, Rest of World (ROW)

              • Increasing disposable incomesThe global vanillin market is expected to witness a considerable growth rate due to the limited supply of natural vanilla worldwide. Topical farmers involved in vanilla plantations are being daunted by constant price fluctuations. This is majorly due to the huge supply and demand gap associated with vanilla. Further is the driving factor this market.
              • vanilla is considered one of the smallest among luxury crops (tropical).Madagascar is the driving factor this market.
              • the largest vanilla producer in the world is the driving factor this market.
              • experienced lower vanilla production in 2022 due to weak flowering in the key growing areas in the northeast of the island in the last quarter of 2021. This has also resulted in low-quality vanilla. Such concerns surrounding the production of natural vanilla have led to a surge in demand for vanillin as a substitute for natural vanilla.On the demand side is the driving factor this market.
              • the prices of vanilla are driven by consumer food preferences. The increasing consumption of processed foods has led manufacturers of vanillin to capitalize on vanillin production methods using synthetic routes. Although synthetic vanillin does not match up to the exact flavor of vanilla is the driving factor this market.
              • it finds application in most vanilla products due to its low production cost than that of the naturally available vanilla. The production of synthetic vanillin is gaining popularity is the driving factor this market.
              • backed by such factors. This has contributed significantly to the falling prices of natural vanilla. Therefore is the driving factor this market.
              • the global vanillin market is being driven by the expensive value of natural vanilla. This is expected to contribute positively toward market expansion during the forecast period. is the driving factor this market.

              The Vanillin market vendors should focus on grabbing business opportunities from the Food and beverages segment as it accounted for the largest market share in the base year.