Vascular Access Devices Market Analysis North America, Europe, Asia, Rest of World (ROW) - US, Germany, UK, Japan, China - Size and Forecast 2024-2028

Vascular Access Devices Market Analysis North America, Europe, Asia, Rest of World (ROW) - US, Germany, UK, Japan, China - Size and Forecast 2024-2028

Published: Dec 2023 176 Pages SKU: IRTNTR77010

Market Overview at a Glance

$2.26 B
Market Opportunity
7.1%
CAGR
5.81
YoY growth 2023-2024(%)

Vascular Access Devices Market Size 2024-2028

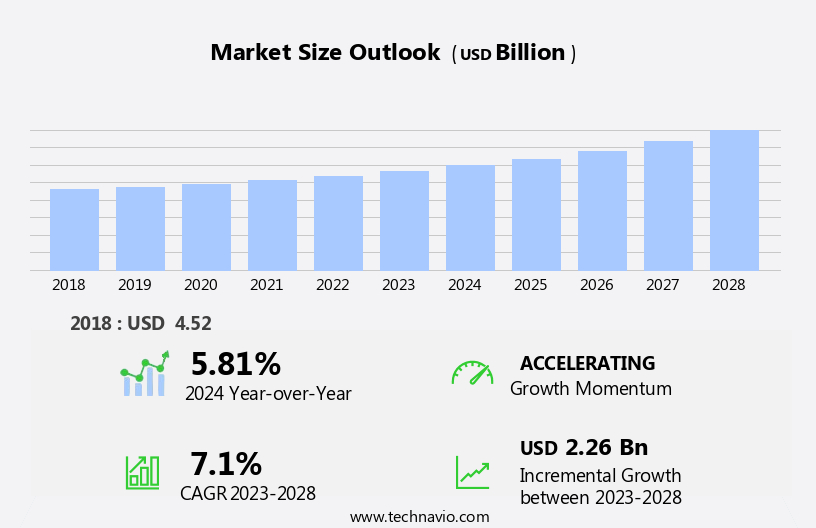
The vascular access devices market size is forecast to increase by USD 2.26 billion, at a CAGR of 7.1% between 2023 and 2028.

  • The market is witnessing significant growth due to the increasing prevalence of chronic diseases worldwide. Chronic conditions such as diabetes, cancer, and kidney diseases necessitate frequent monitoring and long-term treatment, driving the demand for advanced vascular access devices. Concurrently, technological advancements are leading to the development of new vascular access devices, offering enhanced patient safety, comfort, and efficacy. These innovations include the integration of smart technologies, biocompatible materials, and minimally invasive designs. However, the market faces challenges, primarily the risk of infection associated with vascular access devices. Infections can lead to complications, prolonged hospital stays, and increased healthcare costs.
  • To mitigate this challenge, companies are investing in research and development of antimicrobial coatings and biocompatible materials for vascular access devices. Collaborations between medical device manufacturers and healthcare providers are also crucial in implementing best practices for insertion, maintenance, and removal of vascular access devices to minimize infection risks. Companies seeking to capitalize on market opportunities should focus on developing innovative, safe, and effective vascular access devices while addressing infection risks through advanced materials and collaborative efforts with healthcare providers.

What will be the Size of the Vascular Access Devices Market during the forecast period?

Vascular Access Devices Market Size

Explore in-depth regional segment analysis with market size data - historical 2018-2022 and forecasts 2024-2028 - in the full report.  
Request Free Sample

The market continues to evolve, driven by advancements in technology and growing applications across various sectors. Surgical access techniques and minimally invasive procedures are increasingly being adopted, leading to the development of new devices for long-term vascular access. Drug delivery systems, such as implanted ports and peripheral intravenous catheters, are gaining popularity for their ability to provide consistent medication administration and improve patient comfort. Flushing protocols and post-insertion care are crucial aspects of vascular access, ensuring proper catheter function and reducing the risk of complications, including phlebitis, infection, and catheter malposition. Central venous catheters are commonly used for chemotherapy delivery, blood sampling, and hemodialysis, while peripheral intravenous catheters are preferred for fluid infusion and electrolyte monitoring.

The market dynamics are shaped by ongoing research and development efforts, focusing on catheter material biocompatibility, vein preservation, and infection control protocols. Minimally invasive access techniques, such as ultrasound-guided access, are gaining traction to reduce complications and improve patient outcomes. Long-term vascular access devices, including tunneled catheters and hemodialysis catheters, are essential for managing chronic conditions and providing total parenteral nutrition. Thrombosis prevention and catheter occlusion are critical concerns, with lock solutions and cannulation sites under constant development to minimize these risks. The market is a dynamic and complex landscape, requiring ongoing innovation and adaptation to meet the evolving needs of healthcare providers and patients.

Anatomical landmarks and blood pressure monitoring are essential considerations in catheter placement, while complication prevention strategies and infection control protocols remain top priorities for manufacturers and healthcare professionals alike.

How is this Vascular Access Devices Industry segmented?

The vascular access devices industry research report provides comprehensive data (region-wise segment analysis), with forecasts and estimates in "USD billion" for the period 2024-2028, as well as historical data from 2018-2022 for the following segments.

  • Product
    • Central VADs
    • Peripheral VADs
    • Accessories
  • End-user
    • Hospitals
    • Ambulatory care centers
    • Clinics and others
  • Geography
    • North America
      • US
    • Europe
      • Germany
      • UK
    • APAC
      • China
      • Japan
    • Rest of World (ROW)

    By Product Insights

    The central vads segment is estimated to witness significant growth during the forecast period.

    Central Vascular Access Devices (VADs) refer to medical devices where the tip reaches the superior vena cava, inferior vena cava, or right atrium. This strategic placement ensures the safe infusion of solutions with varying pH and osmolarity due to the high blood flow, which mitigates potential damage to the endothelium from vesicant or phlebolesive drugs. The central location of the catheter tip also facilitates direct infusion into the bloodstream, enhancing the efficacy of various medical procedures. Patient comfort is a crucial factor in the design of VADs. Catheter hubs are engineered to minimize trauma during insertion, ensuring a painless experience for patients.

    Extravasation management systems are integrated into catheters to prevent leakage, reducing the risk of complications. Blood sampling and hemoglobin measurement are essential functions of VADs, particularly for patients undergoing long-term therapy or those requiring frequent monitoring. Picc lines and implanted ports are commonly used for extended access, while tunneled catheters offer enhanced durability for hemodialysis access. Surgical access techniques, such as minimally invasive procedures, have gained popularity in recent years, reducing the risk of complications like catheter malposition and infection. Infection control protocols and complication prevention strategies are integral to the successful implementation of VADs, ensuring patient safety.

    Drug delivery systems, including chemotherapy, are administered through VADs, necessitating stringent biocompatibility requirements for catheter materials. Long-term vascular access solutions require thrombosis prevention measures, such as lock solutions and vein preservation techniques, to maintain catheter patency and dwell time. Central VADs are indispensable for various medical applications, including blood pressure monitoring, electrolyte monitoring, and anatomical landmark-guided access techniques, such as ultrasound-guided access. The risk of complications, such as hematoma formation, phlebitis, and infection, necessitates meticulous post-insertion care and adherence to flushing protocols. Fluid infusion, hemodialysis catheters, and total parenteral nutrition are some of the applications of VADs. Catheter occlusion and catheter patency are critical factors influencing the overall performance and success of these devices.

    Infection rates and catheter material biocompatibility are essential considerations in the development and implementation of VADs. Needle insertion technique plays a significant role in minimizing complications and maintaining catheter patency. Thrombosis prevention strategies, such as anticoagulation and heparin-bonded catheters, are employed to mitigate the risk of catheter-related blood clots. In conclusion, the VAD market is driven by the diverse applications of these devices in various medical procedures, from blood sampling and drug delivery to long-term access for hemodialysis and total parenteral nutrition. The ongoing research and development efforts focus on enhancing patient comfort, minimizing complications, and improving biocompatibility to ensure optimal patient outcomes.

    Vascular Access Devices Market Size

    Request Free Sample

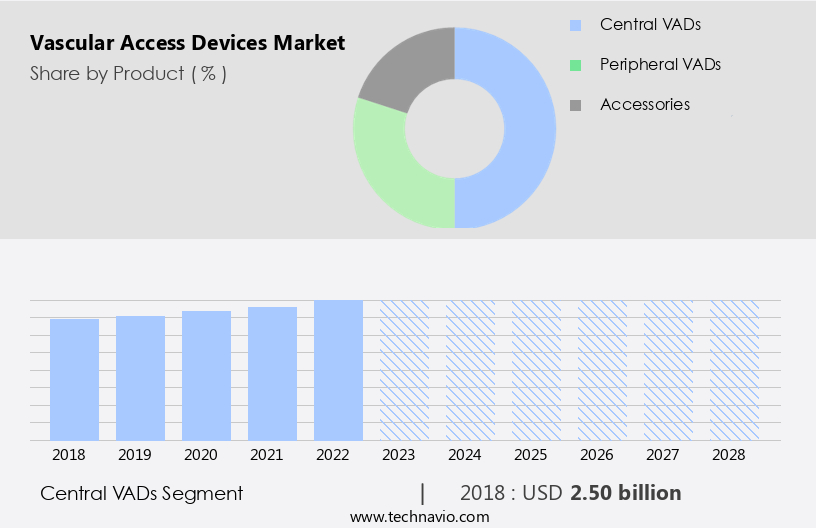
    The Central VADs segment was valued at USD 2.50 billion in 2018 and showed a gradual increase during the forecast period.

    Regional Analysis

    North America is estimated to contribute 44% to the growth of the global market during the forecast period.Technavio’s analysts have elaborately explained the regional trends and drivers that shape the market during the forecast period.

    Vascular Access Devices Market Share by Geography

     Request Free Sample

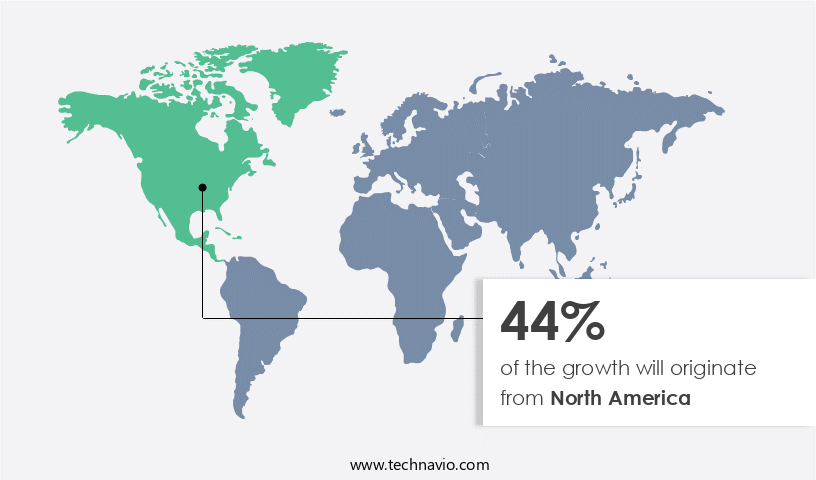
    The North American market for vascular access devices is a significant global sector, driven by the region's high prevalence of chronic diseases, substantial healthcare expenditure, and the presence of numerous key companies. The US and Canada are the primary contributors to this market's expansion. Chronic conditions, such as end-stage kidney disease (ESKD), diabetes, and cancer, necessitate frequent medical interventions and therapeutic treatments, thereby fueling the demand for advanced vascular access devices. According to the Centers for Disease Control and Prevention (CDC), approximately 130,522 people underwent ESKD treatment in the US in 2020. Patient comfort, extravasation management, and blood sampling are essential considerations in vascular access devices.

    Catheter hub design plays a crucial role in minimizing the risk of infection and improving patient comfort. Extravasation management systems help prevent medication leakage from the catheter site. Blood sampling devices ensure accurate and efficient blood collection. Hemoglobin measurement is another essential application, facilitating the monitoring of hemoglobin levels in patients undergoing chemotherapy or long-term vascular access. Innovations in surgical access techniques, such as minimally invasive procedures and ultrasound-guided access, have gained popularity due to their reduced risk of complications and improved patient outcomes. Long-term vascular access devices, including tunneled catheters and implanted ports, offer advantages like reduced infection rates, improved catheter patency, and extended catheter dwell time.

    Drug delivery systems, such as central venous catheters and arterial catheters, are essential for administering chemotherapy and other medications. Lock solutions help prevent infection and clotting in these catheters. Vein preservation techniques and electrolyte monitoring are essential to prevent complications like hematoma formation and infection. Infection control protocols and complication prevention strategies are critical to ensure patient safety. Fluid infusion, hemodialysis catheters, and catheter occlusion devices are essential for various therapeutic applications. Total parenteral nutrition and vascular access complications are significant concerns in long-term vascular access. Needle insertion technique and catheter patency are essential factors influencing the success and safety of vascular access procedures.

    Market Dynamics

    Our researchers analyzed the data with 2023 as the base year, along with the key drivers, trends, and challenges. A holistic analysis of drivers will help companies refine their marketing strategies to gain a competitive advantage.

    What are the key market drivers leading to the rise in the adoption of Vascular Access Devices Industry?

    • The global market is significantly driven by the rising prevalence of chronic diseases, which has become a major health concern worldwide. 

    • The market is experiencing significant growth due to the rising prevalence of chronic diseases such as cardiovascular diseases, diabetes, and cancer. According to the International Diabetes Federation (IDF), an estimated 537 million adults were living with diabetes in 2021, and this number is projected to increase to 643 million by 2030 and further to 783 million by 2045. The increasing burden of these diseases necessitates advanced medical interventions and therapeutic treatments, leading to a growing demand for vascular access devices. Patient comfort is a crucial factor in the design of vascular access devices. Catheter hub designs have evolved to minimize patient discomfort during blood sampling, picc line insertion, and dialysis access.
    • Extravasation management is another essential aspect of vascular access devices, as it helps prevent damage to the surrounding tissue during infusion therapy. Infection rates and catheter material biocompatibility are significant concerns in the market. Tunneled catheters and other advanced devices have been developed to reduce infection rates and improve patient safety. Catheter malposition is another challenge in the market, and efforts are being made to develop technologies that ensure proper catheter placement and minimize the risk of complications. Blood sampling and hemoglobin measurement are critical applications of vascular access devices, and advancements in these areas continue to drive market growth.
    • The importance of these devices in delivering effective healthcare solutions cannot be overstated, making the market an essential sector in the global healthcare industry.

    What are the market trends shaping the Vascular Access Devices Industry?

    • The development of advanced vascular access devices is currently a significant trend in the medical industry. This innovation aims to improve patient care and outcomes through enhanced safety, efficiency, and comfort in accessing blood vessels for diagnostic and therapeutic purposes.

    • Vascular access devices play a pivotal role in infusion therapy, enabling the delivery of fluids, medications, and nutrients directly into a patient's bloodstream. Two common types of vascular access techniques are surgical access and minimally invasive access. Surgical access involves creating a permanent entry point into a large vein, often through a surgical procedure, resulting in long-term access devices like implanted ports. In contrast, minimally invasive access uses smaller needles or catheters for short-term access, such as peripheral intravenous catheters (PIVCs) and central venous catheters (CVCs). PIVCs are commonly used for chemotherapy delivery and require frequent flushing protocols to maintain patency and prevent complications like phlebitis.
    • CVCs, on the other hand, offer long-term access and are often used for intensive care and nutritional support. However, they carry a higher risk of complications, including infection and thrombosis. Intravenous access procedures can pose risks to healthcare professionals, particularly the risk of needlestick injuries. According to the Centers for Disease Control and Prevention (CDC), there are approximately 385,000 sharps injuries annually, with over 30% attributed to hollow-bore needles like those used in PIVCs. Innovations in vascular access devices, such as B. Braun's Introcan Safety 2 IV Catheter with one-time blood control, aim to minimize these risks and enhance safety for clinicians.

    What challenges does the Vascular Access Devices Industry face during its growth?

    • The risk of infection poses a significant challenge to the growth of the vascular access devices industry, necessitating continuous efforts to enhance infection prevention measures. 

    • Vascular access devices, such as arterial catheters and peripherally inserted central catheters (PICCs), play a crucial role in delivering medications and fluids directly into the bloodstream. However, their prolonged use increases the risk of complications, including catheter-related bloodstream infections (CRBSI). These infections can result from microbial colonization during insertion or prolonged use. The consequences of CRBSI can be severe, leading to conditions like sepsis, increased morbidity, and mortality rates. To mitigate these risks, healthcare providers emphasize strict adherence to infection control protocols and complication prevention strategies. These include using ultrasound guidance for access, preserving anatomical landmarks, and implementing lock solutions for hematoma formation prevention.
    • Moreover, electrolyte monitoring and blood pressure monitoring are essential for maintaining patient safety. Healthcare professionals must prioritize aseptic techniques during insertion and rigorous maintenance practices to minimize infection risks. By focusing on these strategies, providers can ensure the safe and effective use of vascular access devices for fluid infusion and therapeutic applications.

    Exclusive Customer Landscape

    The vascular access devices market forecasting report includes the adoption lifecycle of the market, covering from the innovator’s stage to the laggard’s stage. It focuses on adoption rates in different regions based on penetration. Furthermore, the vascular access devices market report also includes key purchase criteria and drivers of price sensitivity to help companies evaluate and develop their market growth analysis strategies.
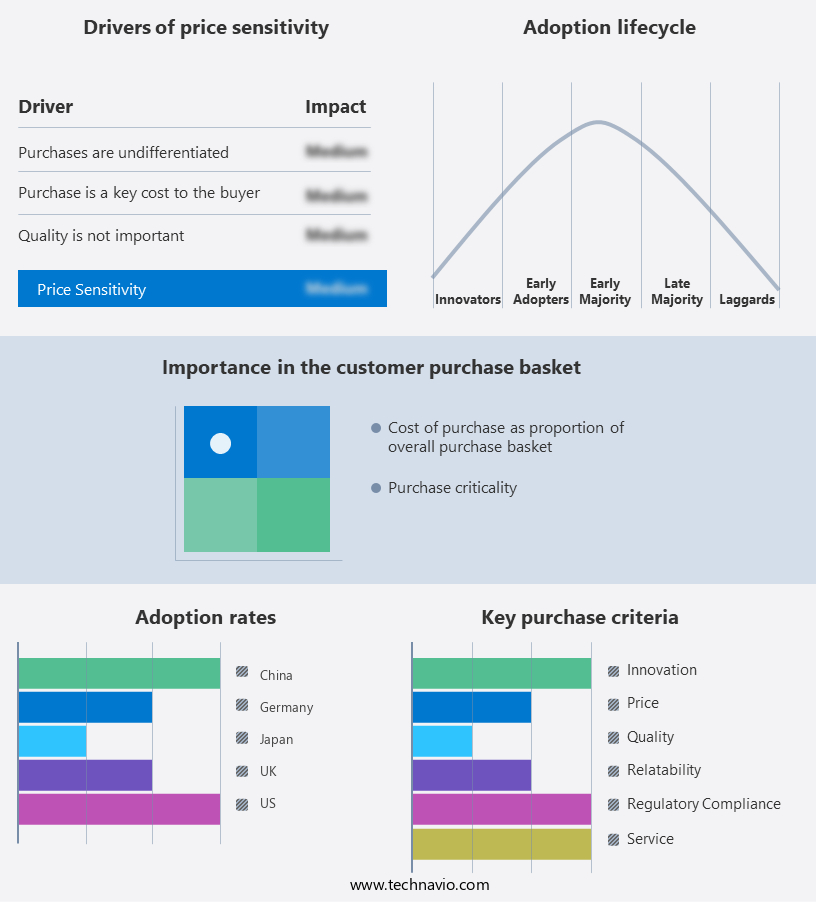
    Vascular Access Devices Market Share by Geography

     Customer Landscape

    Key Companies & Market Insights

    Companies are implementing various strategies, such as strategic alliances, vascular access devices market forecast, partnerships, mergers and acquisitions, geographical expansion, and product/service launches, to enhance their presence in the industry.

    3M Co. - This research focuses on 3M's extensive product portfolio of vascular access devices. Notable offerings include Tegaderm Chlorhexidine Gluconate, Cavilon No Sting Barrier Film, Transparent Film Dressings, and I.V. Advanced Securment Dressings. These innovative solutions enhance patient care by ensuring secure and effective vascular access.

    The industry research and growth report includes detailed analyses of the competitive landscape of the market and information about key companies, including:

    • 3M Co.
    • Access Vascular Inc.
    • Amecath
    • AngioDynamics Inc.
    • Argon Medical Devices Inc.
    • B.Braun SE
    • Becton Dickinson and Co.
    • BIOTRONIK SE and Co. KG
    • Cook Group Inc.
    • Delta Med S.p.A.
    • Fresenius SE and Co. KGaA
    • Guangdong Baihe Medical Technology Co. Ltd.
    • Haolang Technology Foshan Limited Co. Ltd.
    • ICU Medical Inc.
    • Kimal Group
    • Medical Components Inc.
    • Medline Industries LP
    • Medtronic Plc
    • Nipro Medical Corp.
    • pfm medical ag
    • Teleflex Inc.
    • Terumo Corp.
    • Vygon SAS

    Qualitative and quantitative analysis of companies has been conducted to help clients understand the wider business environment as well as the strengths and weaknesses of key industry players. Data is qualitatively analyzed to categorize companies as pure play, category-focused, industry-focused, and diversified; it is quantitatively analyzed to categorize companies as dominant, leading, strong, tentative, and weak.

    Recent Development and News in Vascular Access Devices Market

    • In January 2024, Medtronic plc, a leading medical technology, services, and solutions company, announced the launch of its new IntroducerSeal Dual Transseptal Sheath, designed to minimize the risk of complications during transseptal procedures. This innovative product, which received CE Mark approval in 2023, is expected to enhance patient safety and improve clinical outcomes (Medtronic Press Release, 2024).
    • In March 2024, Edwards Lifesciences Corporation, a global leader in patient care technologies, entered into a strategic partnership with Merit Medical to co-develop and commercialize a new line of vascular access products. This collaboration is expected to expand Edwards' product portfolio and strengthen its presence in the market (Edwards Lifesciences Press Release, 2024).
    • In May 2024, Becton, Dickinson and Company (BD), a leading medical technology company, completed the acquisition of CareFusion Corporation's Vascular Access business from Danaher Corporation. This acquisition significantly expanded BD's vascular access portfolio and enhanced its position as a leading provider of medical devices for infusion therapy and vascular access (BD Press Release, 2024).
    • In April 2025, Fresenius Medical Care AG & Co. KGaA, a global leader in renal care products and services, received FDA approval for its new Hemodialysis Access System, the AQuaAccess. This system, which utilizes a unique, single-use, pre-attached graft, aims to simplify hemodialysis procedures and improve patient outcomes (Fresenius Medical Care Press Release, 2025).

    Research Analyst Overview

    • The market encompasses reusable catheters and single-use alternatives, including central and peripheral options. Clinical trials continue to evaluate the effectiveness of antimicrobial coatings and antithrombogenic surfaces in mitigating infection risk and thrombosis. Healthcare providers prioritize adverse events monitoring and patient outcomes, with procedure time and healthcare costs also influencing selection. Quality improvement measures emphasize aseptic technique, catheter occlusion prevention, and infection prevention strategies. Post-removal care is crucial for reducing complications, such as catheter-related bloodstream infections. Biocompatible materials and catheter size selection are essential considerations for patient safety.
    • Provider organizations adhere to clinical guidelines, providing catheter insertion training and promoting evidence-based practice to minimize insertion complications and optimize removal techniques. Venous thromboembolism remains a significant concern, necessitating ongoing research and the implementation of complication reduction strategies.

    Dive into Technavio’s robust research methodology, blending expert interviews, extensive data synthesis, and validated models for unparalleled Vascular Access Devices Market insights. See full methodology.

    Market Scope

    Report Coverage

    Details

    Page number

    176

    Base year

    2023

    Historic period

    2018-2022

    Forecast period

    2024-2028

    Growth momentum & CAGR

    Accelerate at a CAGR of 7.1%

    Market growth 2024-2028

    USD 2.26 billion

    Market structure

    Fragmented

    YoY growth 2023-2024(%)

    5.81

    Key countries

    US, Germany, UK, Japan, and China

    Competitive landscape

    Leading Companies, Market Positioning of Companies, Competitive Strategies, and Industry Risks

    Request Free Sample

    What are the Key Data Covered in this Vascular Access Devices Market Research and Growth Report?

    • CAGR of the Vascular Access Devices industry during the forecast period
    • Detailed information on factors that will drive the growth and forecasting between 2024 and 2028
    • Precise estimation of the size of the market and its contribution of the industry in focus to the parent market
    • Accurate predictions about upcoming growth and trends and changes in consumer behaviour
    • Growth of the market across North America, Europe, Asia, and Rest of World (ROW)
    • Thorough analysis of the market’s competitive landscape and detailed information about companies
    • Comprehensive analysis of factors that will challenge the vascular access devices market growth of industry companies

    We can help! Our analysts can customize this vascular access devices market research report to meet your requirements.

    Get in touch


    1 Executive Summary

    • 1.1 Market overview
      • Exhibit 01: Executive Summary – Chart on Market Overview
      • Exhibit 02: Executive Summary – Data Table on Market Overview
      • Exhibit 03: Executive Summary – Chart on Global Market Characteristics
      • Exhibit 04: Executive Summary – Chart on Market by Geography
      • Exhibit 05: Executive Summary – Chart on Market Segmentation by Product
      • Exhibit 06: Executive Summary – Chart on Market Segmentation by End-user
      • Exhibit 07: Executive Summary – Chart on Incremental Growth
      • Exhibit 08: Executive Summary – Data Table on Incremental Growth
      • Exhibit 09: Executive Summary – Chart on Vendor Market Positioning

    2 Market Landscape

    • 2.1 Market ecosystem
      • Exhibit 10: Parent market
      • Exhibit 11: Market Characteristics

    3 Market Sizing

    • 3.1 Market definition
      • Exhibit 12: Offerings of vendors included in the market definition
    • 3.2 Market segment analysis
      • Exhibit 13: Market segments
    • 3.3 Market size 2023
      • 3.4 Market outlook: Forecast for 2023-2028
        • Exhibit 14: Chart on Global - Market size and forecast 2023-2028 ($ billion)
        • Exhibit 15: Data Table on Global - Market size and forecast 2023-2028 ($ billion)
        • Exhibit 16: Chart on Global Market: Year-over-year growth 2023-2028 (%)
        • Exhibit 17: Data Table on Global Market: Year-over-year growth 2023-2028 (%)

      4 Historic Market Size

      • 4.1 Global vascular access devices market 2018 - 2022
        • Exhibit 18: Historic Market Size – Data Table on global vascular access devices market 2018 - 2022 ($ billion)
      • 4.2 Product Segment Analysis 2018 - 2022
        • Exhibit 19: Historic Market Size – Product Segment 2018 - 2022 ($ billion)
      • 4.3 End-user Segment Analysis 2018 - 2022
        • Exhibit 20: Historic Market Size – End-user Segment 2018 - 2022 ($ billion)
      • 4.4 Geography Segment Analysis 2018 - 2022
        • Exhibit 21: Historic Market Size – Geography Segment 2018 - 2022 ($ billion)
      • 4.5 Country Segment Analysis 2018 - 2022
        • Exhibit 22: Historic Market Size – Country Segment 2018 - 2022 ($ billion)

      5 Five Forces Analysis

      • 5.1 Five forces summary
        • Exhibit 23: Five forces analysis - Comparison between 2023 and 2028
      • 5.2 Bargaining power of buyers
        • Exhibit 24: Chart on Bargaining power of buyers – Impact of key factors 2023 and 2028
      • 5.3 Bargaining power of suppliers
        • Exhibit 25: Bargaining power of suppliers – Impact of key factors in 2023 and 2028
      • 5.4 Threat of new entrants
        • Exhibit 26: Threat of new entrants – Impact of key factors in 2023 and 2028
      • 5.5 Threat of substitutes
        • Exhibit 27: Threat of substitutes – Impact of key factors in 2023 and 2028
      • 5.6 Threat of rivalry
        • Exhibit 28: Threat of rivalry – Impact of key factors in 2023 and 2028
      • 5.7 Market condition
        • Exhibit 29: Chart on Market condition - Five forces 2023 and 2028

      6 Market Segmentation by Product

      • 6.1 Market segments
        • Exhibit 30: Chart on Product - Market share 2023-2028 (%)
        • Exhibit 31: Data Table on Product - Market share 2023-2028 (%)
      • 6.2 Comparison by Product
        • Exhibit 32: Chart on Comparison by Product
        • Exhibit 33: Data Table on Comparison by Product
      • 6.3 Central VADs - Market size and forecast 2023-2028
        • Exhibit 34: Chart on Central VADs - Market size and forecast 2023-2028 ($ billion)
        • Exhibit 35: Data Table on Central VADs - Market size and forecast 2023-2028 ($ billion)
        • Exhibit 36: Chart on Central VADs - Year-over-year growth 2023-2028 (%)
        • Exhibit 37: Data Table on Central VADs - Year-over-year growth 2023-2028 (%)
      • 6.4 Peripheral VADs - Market size and forecast 2023-2028
        • Exhibit 38: Chart on Peripheral VADs - Market size and forecast 2023-2028 ($ billion)
        • Exhibit 39: Data Table on Peripheral VADs - Market size and forecast 2023-2028 ($ billion)
        • Exhibit 40: Chart on Peripheral VADs - Year-over-year growth 2023-2028 (%)
        • Exhibit 41: Data Table on Peripheral VADs - Year-over-year growth 2023-2028 (%)
      • 6.5 Accessories - Market size and forecast 2023-2028
        • Exhibit 42: Chart on Accessories - Market size and forecast 2023-2028 ($ billion)
        • Exhibit 43: Data Table on Accessories - Market size and forecast 2023-2028 ($ billion)
        • Exhibit 44: Chart on Accessories - Year-over-year growth 2023-2028 (%)
        • Exhibit 45: Data Table on Accessories - Year-over-year growth 2023-2028 (%)
      • 6.6 Market opportunity by Product
        • Exhibit 46: Market opportunity by Product ($ billion)
        • Exhibit 47: Data Table on Market opportunity by Product ($ billion)

      7 Market Segmentation by End-user

      • 7.1 Market segments
        • Exhibit 48: Chart on End-user - Market share 2023-2028 (%)
        • Exhibit 49: Data Table on End-user - Market share 2023-2028 (%)
      • 7.2 Comparison by End-user
        • Exhibit 50: Chart on Comparison by End-user
        • Exhibit 51: Data Table on Comparison by End-user
      • 7.3 Hospitals - Market size and forecast 2023-2028
        • Exhibit 52: Chart on Hospitals - Market size and forecast 2023-2028 ($ billion)
        • Exhibit 53: Data Table on Hospitals - Market size and forecast 2023-2028 ($ billion)
        • Exhibit 54: Chart on Hospitals - Year-over-year growth 2023-2028 (%)
        • Exhibit 55: Data Table on Hospitals - Year-over-year growth 2023-2028 (%)
      • 7.4 Ambulatory care centers - Market size and forecast 2023-2028
        • Exhibit 56: Chart on Ambulatory care centers - Market size and forecast 2023-2028 ($ billion)
        • Exhibit 57: Data Table on Ambulatory care centers - Market size and forecast 2023-2028 ($ billion)
        • Exhibit 58: Chart on Ambulatory care centers - Year-over-year growth 2023-2028 (%)
        • Exhibit 59: Data Table on Ambulatory care centers - Year-over-year growth 2023-2028 (%)
      • 7.5 Clinics and others - Market size and forecast 2023-2028
        • Exhibit 60: Chart on Clinics and others - Market size and forecast 2023-2028 ($ billion)
        • Exhibit 61: Data Table on Clinics and others - Market size and forecast 2023-2028 ($ billion)
        • Exhibit 62: Chart on Clinics and others - Year-over-year growth 2023-2028 (%)
        • Exhibit 63: Data Table on Clinics and others - Year-over-year growth 2023-2028 (%)
      • 7.6 Market opportunity by End-user
        • Exhibit 64: Market opportunity by End-user ($ billion)
        • Exhibit 65: Data Table on Market opportunity by End-user ($ billion)

      8 Customer Landscape

      • 8.1 Customer landscape overview
        • Exhibit 66: Analysis of price sensitivity, lifecycle, customer purchase basket, adoption rates, and purchase criteria

      9 Geographic Landscape

      • 9.1 Geographic segmentation
        • Exhibit 67: Chart on Market share by geography 2023-2028 (%)
        • Exhibit 68: Data Table on Market share by geography 2023-2028 (%)
      • 9.2 Geographic comparison
        • Exhibit 69: Chart on Geographic comparison
        • Exhibit 70: Data Table on Geographic comparison
      • 9.3 North America - Market size and forecast 2023-2028
        • Exhibit 71: Chart on North America - Market size and forecast 2023-2028 ($ billion)
        • Exhibit 72: Data Table on North America - Market size and forecast 2023-2028 ($ billion)
        • Exhibit 73: Chart on North America - Year-over-year growth 2023-2028 (%)
        • Exhibit 74: Data Table on North America - Year-over-year growth 2023-2028 (%)
      • 9.4 Europe - Market size and forecast 2023-2028
        • Exhibit 75: Chart on Europe - Market size and forecast 2023-2028 ($ billion)
        • Exhibit 76: Data Table on Europe - Market size and forecast 2023-2028 ($ billion)
        • Exhibit 77: Chart on Europe - Year-over-year growth 2023-2028 (%)
        • Exhibit 78: Data Table on Europe - Year-over-year growth 2023-2028 (%)
      • 9.5 Asia - Market size and forecast 2023-2028
        • Exhibit 79: Chart on Asia - Market size and forecast 2023-2028 ($ billion)
        • Exhibit 80: Data Table on Asia - Market size and forecast 2023-2028 ($ billion)
        • Exhibit 81: Chart on Asia - Year-over-year growth 2023-2028 (%)
        • Exhibit 82: Data Table on Asia - Year-over-year growth 2023-2028 (%)
      • 9.6 Rest of World (ROW) - Market size and forecast 2023-2028
        • Exhibit 83: Chart on Rest of World (ROW) - Market size and forecast 2023-2028 ($ billion)
        • Exhibit 84: Data Table on Rest of World (ROW) - Market size and forecast 2023-2028 ($ billion)
        • Exhibit 85: Chart on Rest of World (ROW) - Year-over-year growth 2023-2028 (%)
        • Exhibit 86: Data Table on Rest of World (ROW) - Year-over-year growth 2023-2028 (%)
      • 9.7 US - Market size and forecast 2023-2028
        • Exhibit 87: Chart on US - Market size and forecast 2023-2028 ($ billion)
        • Exhibit 88: Data Table on US - Market size and forecast 2023-2028 ($ billion)
        • Exhibit 89: Chart on US - Year-over-year growth 2023-2028 (%)
        • Exhibit 90: Data Table on US - Year-over-year growth 2023-2028 (%)
      • 9.8 Germany - Market size and forecast 2023-2028
        • Exhibit 91: Chart on Germany - Market size and forecast 2023-2028 ($ billion)
        • Exhibit 92: Data Table on Germany - Market size and forecast 2023-2028 ($ billion)
        • Exhibit 93: Chart on Germany - Year-over-year growth 2023-2028 (%)
        • Exhibit 94: Data Table on Germany - Year-over-year growth 2023-2028 (%)
      • 9.9 Japan - Market size and forecast 2023-2028
        • Exhibit 95: Chart on Japan - Market size and forecast 2023-2028 ($ billion)
        • Exhibit 96: Data Table on Japan - Market size and forecast 2023-2028 ($ billion)
        • Exhibit 97: Chart on Japan - Year-over-year growth 2023-2028 (%)
        • Exhibit 98: Data Table on Japan - Year-over-year growth 2023-2028 (%)
      • 9.10 China - Market size and forecast 2023-2028
        • Exhibit 99: Chart on China - Market size and forecast 2023-2028 ($ billion)
        • Exhibit 100: Data Table on China - Market size and forecast 2023-2028 ($ billion)
        • Exhibit 101: Chart on China - Year-over-year growth 2023-2028 (%)
        • Exhibit 102: Data Table on China - Year-over-year growth 2023-2028 (%)
      • 9.11 UK - Market size and forecast 2023-2028
        • Exhibit 103: Chart on UK - Market size and forecast 2023-2028 ($ billion)
        • Exhibit 104: Data Table on UK - Market size and forecast 2023-2028 ($ billion)
        • Exhibit 105: Chart on UK - Year-over-year growth 2023-2028 (%)
        • Exhibit 106: Data Table on UK - Year-over-year growth 2023-2028 (%)
      • 9.12 Market opportunity by geography
        • Exhibit 107: Market opportunity by geography ($ billion)
        • Exhibit 108: Data Tables on Market opportunity by geography ($ billion)

      10 Drivers, Challenges, and Trends

      • 10.1 Market drivers
        • 10.2 Market challenges
          • 10.3 Impact of drivers and challenges
            • Exhibit 109: Impact of drivers and challenges in 2023 and 2028
          • 10.4 Market trends

            11 Vendor Landscape

            • 11.1 Overview
              • 11.2 Vendor landscape
                • Exhibit 110: Overview on Criticality of inputs and Factors of differentiation
              • 11.3 Landscape disruption
                • Exhibit 111: Overview on factors of disruption
              • 11.4 Industry risks
                • Exhibit 112: Impact of key risks on business

              12 Vendor Analysis

              • 12.1 Vendors covered
                • Exhibit 113: Vendors covered
              • 12.2 Market positioning of vendors
                • Exhibit 114: Matrix on vendor position and classification
              • 12.3 3M Co.
                • Exhibit 115: 3M Co. - Overview
                • Exhibit 116: 3M Co. - Business segments
                • Exhibit 117: 3M Co. - Key news
                • Exhibit 118: 3M Co. - Key offerings
                • Exhibit 119: 3M Co. - Segment focus
              • 12.4 Access Vascular Inc.
                • Exhibit 120: Access Vascular Inc. - Overview
                • Exhibit 121: Access Vascular Inc. - Product / Service
                • Exhibit 122: Access Vascular Inc. - Key offerings
              • 12.5 Amecath
                • Exhibit 123: Amecath - Overview
                • Exhibit 124: Amecath - Product / Service
                • Exhibit 125: Amecath - Key offerings
              • 12.6 AngioDynamics Inc.
                • Exhibit 126: AngioDynamics Inc. - Overview
                • Exhibit 127: AngioDynamics Inc. - Business segments
                • Exhibit 128: AngioDynamics Inc. - Key news
                • Exhibit 129: AngioDynamics Inc. - Key offerings
                • Exhibit 130: AngioDynamics Inc. - Segment focus
              • 12.7 Argon Medical Devices Inc.
                • Exhibit 131: Argon Medical Devices Inc. - Overview
                • Exhibit 132: Argon Medical Devices Inc. - Product / Service
                • Exhibit 133: Argon Medical Devices Inc. - Key news
                • Exhibit 134: Argon Medical Devices Inc. - Key offerings
              • 12.8 B.Braun SE
                • Exhibit 135: B.Braun SE - Overview
                • Exhibit 136: B.Braun SE - Business segments
                • Exhibit 137: B.Braun SE - Key news
                • Exhibit 138: B.Braun SE - Key offerings
                • Exhibit 139: B.Braun SE - Segment focus
              • 12.9 Becton Dickinson and Co.
                • Exhibit 140: Becton Dickinson and Co. - Overview
                • Exhibit 141: Becton Dickinson and Co. - Business segments
                • Exhibit 142: Becton Dickinson and Co. - Key news
                • Exhibit 143: Becton Dickinson and Co. - Key offerings
                • Exhibit 144: Becton Dickinson and Co. - Segment focus
              • 12.10 Cook Group Inc.
                • Exhibit 145: Cook Group Inc. - Overview
                • Exhibit 146: Cook Group Inc. - Product / Service
                • Exhibit 147: Cook Group Inc. - Key offerings
              • 12.11 Fresenius SE and Co. KGaA
                • Exhibit 148: Fresenius SE and Co. KGaA - Overview
                • Exhibit 149: Fresenius SE and Co. KGaA - Business segments
                • Exhibit 150: Fresenius SE and Co. KGaA - Key news
                • Exhibit 151: Fresenius SE and Co. KGaA - Key offerings
                • Exhibit 152: Fresenius SE and Co. KGaA - Segment focus
              • 12.12 ICU Medical Inc.
                • Exhibit 153: ICU Medical Inc. - Overview
                • Exhibit 154: ICU Medical Inc. - Product / Service
                • Exhibit 155: ICU Medical Inc. - Key offerings
              • 12.13 Medtronic Plc
                • Exhibit 156: Medtronic Plc - Overview
                • Exhibit 157: Medtronic Plc - Business segments
                • Exhibit 158: Medtronic Plc - Key news
                • Exhibit 159: Medtronic Plc - Key offerings
                • Exhibit 160: Medtronic Plc - Segment focus
              • 12.14 Nipro Medical Corp.
                • Exhibit 161: Nipro Medical Corp. - Overview
                • Exhibit 162: Nipro Medical Corp. - Product / Service
                • Exhibit 163: Nipro Medical Corp. - Key offerings
              • 12.15 Teleflex Inc.
                • Exhibit 164: Teleflex Inc. - Overview
                • Exhibit 165: Teleflex Inc. - Business segments
                • Exhibit 166: Teleflex Inc. - Key news
                • Exhibit 167: Teleflex Inc. - Key offerings
                • Exhibit 168: Teleflex Inc. - Segment focus
              • 12.16 Terumo Corp.
                • Exhibit 169: Terumo Corp. - Overview
                • Exhibit 170: Terumo Corp. - Business segments
                • Exhibit 171: Terumo Corp. - Key news
                • Exhibit 172: Terumo Corp. - Key offerings
                • Exhibit 173: Terumo Corp. - Segment focus
              • 12.17 Vygon SAS
                • Exhibit 174: Vygon SAS - Overview
                • Exhibit 175: Vygon SAS - Product / Service
                • Exhibit 176: Vygon SAS - Key offerings

              13 Appendix

              • 13.1 Scope of the report
                • 13.2 Inclusions and exclusions checklist
                  • Exhibit 177: Inclusions checklist
                  • Exhibit 178: Exclusions checklist
                • 13.3 Currency conversion rates for US$
                  • Exhibit 179: Currency conversion rates for US$
                • 13.4 Research methodology
                  • Exhibit 180: Research methodology
                  • Exhibit 181: Validation techniques employed for market sizing
                  • Exhibit 182: Information sources
                • 13.5 List of abbreviations
                  • Exhibit 183: List of abbreviations

                Research Methodology

                Technavio presents a detailed picture of the market by way of study, synthesis, and summation of data from multiple sources. The analysts have presented the various facets of the market with a particular focus on identifying the key industry influencers. The data thus presented is comprehensive, reliable, and the result of extensive research, both primary and secondary.

                INFORMATION SOURCES

                Primary sources

                • Manufacturers and suppliers
                • Channel partners
                • Industry experts
                • Strategic decision makers

                Secondary sources

                • Industry journals and periodicals
                • Government data
                • Financial reports of key industry players
                • Historical data
                • Press releases

                DATA ANALYSIS

                Data Synthesis

                • Collation of data
                • Estimation of key figures
                • Analysis of derived insights

                Data Validation

                • Triangulation with data models
                • Reference against proprietary databases
                • Corroboration with industry experts

                REPORT WRITING

                Qualitative

                • Market drivers
                • Market challenges
                • Market trends
                • Five forces analysis

                Quantitative

                • Market size and forecast
                • Market segmentation
                • Geographical insights
                • Competitive landscape

                Interested in this report?

                Get your sample now to see our research methodology and insights!

                Download Now

                Frequently Asked Questions

                Vascular Access Devices market growth will increase by $ 2.26 bn during 2024-2028 .

                The Vascular Access Devices market is expected to grow at a CAGR of 7.1% during 2024-2028 .

                Vascular Access Devices market is segmented by Product( Central VADs, Peripheral VADs, Accessories) End-user( Hospitals, Ambulatory care centers, Clinics and others)

                3M Co., Access Vascular Inc., Amecath, AngioDynamics Inc., Argon Medical Devices Inc., B.Braun SE, Becton Dickinson and Co., BIOTRONIK SE and Co. KG, Cook Group Inc., Delta Med S.p.A., Fresenius SE and Co. KGaA, Guangdong Baihe Medical Technology Co. Ltd., Haolang Technology Foshan Limited Co. Ltd., ICU Medical Inc., Kimal Group, Medical Components Inc., Medline Industries LP, Medtronic Plc, Nipro Medical Corp., pfm medical ag, Teleflex Inc., Terumo Corp., Vygon SAS are a few of the key vendors in the Vascular Access Devices market.

                North America will register the highest growth rate of 44% among the other regions. Therefore, the Vascular Access Devices market in North America is expected to garner significant business opportunities for the vendors during the forecast period.

                US, Germany, UK, Japan, China

                • Increasing prevalence of chronic diseases globallyThe increasing prevalence of chronic diseases globally is a significant driver for the growth of the global vascular access devices market. Instances of chronic diseases is the driving factor this market.
                • including cardiovascular diseases is the driving factor this market.
                • diabetes is the driving factor this market.
                • and cancer is the driving factor this market.
                • have witnessed a surge is the driving factor this market.
                • necessitating advanced medical interventions and therapeutic treatments. According to the International Diabetes Federation (IDF) is the driving factor this market.
                • in 2021 is the driving factor this market.
                • an estimated 537 million adults aged 20 to 79 years globally were living with diabetes is the driving factor this market.
                • equating to 1 in 10 individuals. Projections indicate a concerning upward trend is the driving factor this market.
                • with expectations of reaching 643 million by 2030 and a further increase to 783 million by 2045. Additionally is the driving factor this market.
                • on December 14 is the driving factor this market.
                • 2020 is the driving factor this market.
                • the International Agency for Research on Cancer (IARC) released the updated Globocan 2020 is the driving factor this market.
                • revealing that the global cancer burden had increased to 19.3 million cases and 10 million cancer deaths in 2020. Vascular access devices is the driving factor this market.
                • such as central venous catheters and implantable ports is the driving factor this market.
                • play a crucial role in the management and treatment of these chronic conditions. For instance is the driving factor this market.
                • in cancer patients undergoing chemotherapy is the driving factor this market.
                • implantable ports provide a convenient and long-term solution for administering medications is the driving factor this market.
                • reducing the need for repeated needle insertions. Moreover is the driving factor this market.
                • the rising incidence of diabetes has led to an increased demand for vascular access devices in the administration of insulin and other medications. Patients with cardiovascular diseases often require continuous monitoring and treatment is the driving factor this market.
                • necessitating the use of vascular access devices for efficient delivery of medications and fluids. The prevalence of these chronic conditions is expected to continue growing due to factors such as sedentary lifestyles is the driving factor this market.
                • dietary habits is the driving factor this market.
                • and an aging population is the driving factor this market.
                • sustaining the demand for vascular access devices in the foreseeable future. Thus is the driving factor this market.
                • the increasing prevalence of chronic diseases globally will continue to drive the growth of the market in focus during the forecast period. is the driving factor this market.

                The Vascular Access Devices market vendors should focus on grabbing business opportunities from the Central VADs segment as it accounted for the largest market share in the base year.