
Vertical AI Market Size 2025-2029
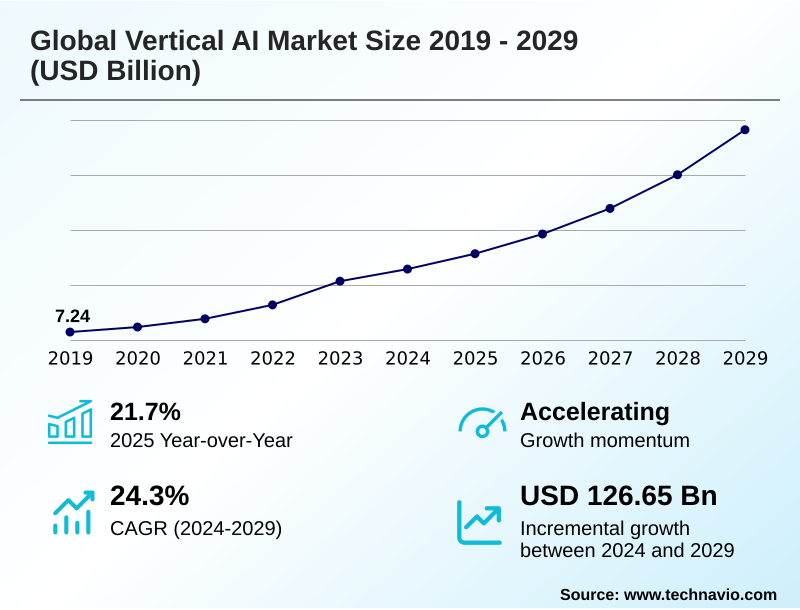
The vertical ai market size is valued to increase by USD 126.65 billion, at a CAGR of 24.3% from 2024 to 2029. Increasing demand for specialization and domain-specific solutions will drive the vertical ai market.
Major Market Trends & Insights
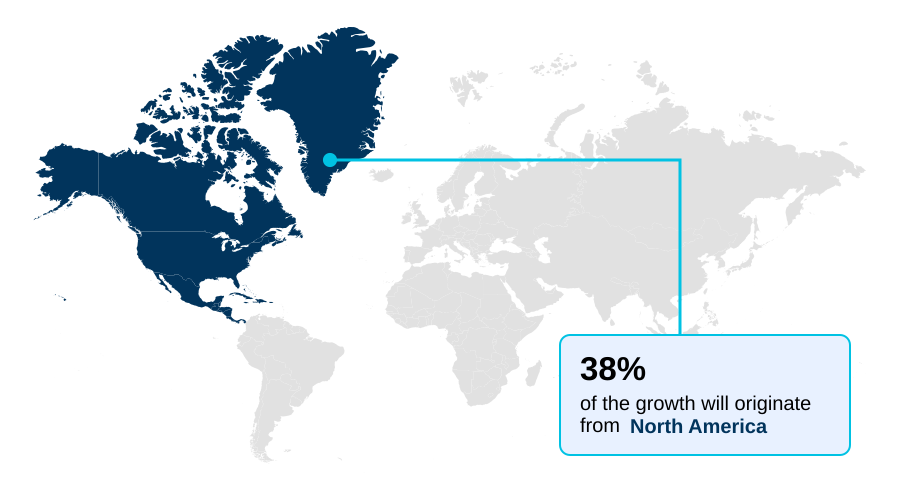
- North America dominated the market and accounted for a 38.2% growth during the forecast period.
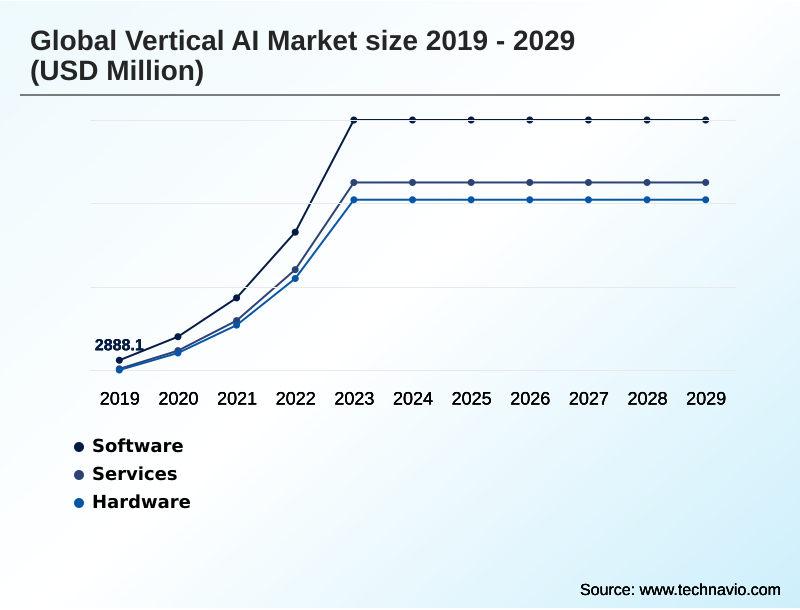
- By Component - Software segment was valued at USD 21.49 billion in 2023
- By Deployment - Cloud-based segment accounted for the largest market revenue share in 2023
Market Size & Forecast
- Market Opportunities: USD 183.88 billion
- Market Future Opportunities: USD 126.65 billion
- CAGR from 2024 to 2029 : 24.3%
Market Summary
- The Vertical AI Market is shifting from general-purpose platforms to specialized solutions designed for specific industry contexts. This evolution is driven by the demand for systems with deep domain knowledge that can address unique operational challenges and regulatory requirements.
- Businesses are leveraging vertical generative AI and domain-specific datasets to achieve hyper-personalization at scale, enhance AI-powered diagnostics in healthcare, and implement predictive maintenance AI in manufacturing. The proliferation of big data and advanced specialized AI chips provides the necessary foundation for training sophisticated deep learning models.
- For instance, in logistics, a company can deploy AI for supply chain optimization using computer vision algorithms to monitor warehouse inventory and natural language processing to manage shipping documentation, significantly improving efficiency. However, challenges such as vertical AI implementation costs and the need for skilled professionals in AI model risk management persist.
- The adoption of cloud-based AI platforms and on-premises AI deployment options offers flexibility, while a focus on explainable machine learning addresses concerns around transparency and trust, making these industry-specific AI solutions more accessible.
What will be the Size of the Vertical AI Market during the forecast period?
Get Key Insights on Market Forecast (PDF) Get Free Sample
How is the Vertical AI Market Segmented?
The vertical ai industry research report provides comprehensive data (region-wise segment analysis), with forecasts and estimates in "USD million" for the period 2025-2029, as well as historical data from 2019-2023 for the following segments.
- Component
- Software
- Services
- Hardware
- Deployment
- Cloud-based
- On-premises
- End-user
- IT and telecom
- BFSI
- Healthcare
- Retail
- Others
- Geography
- North America
- US
- Canada
- Mexico
- APAC
- China
- Japan
- South Korea
- Europe
- Germany
- UK
- France
- Middle East and Africa
- UAE
- Saudi Arabia
- Israel
- South America
- Brazil
- Argentina
- Colombia
- Rest of World (ROW)
- North America
By Component Insights
The software segment is estimated to witness significant growth during the forecast period.
The software segment of the vertical AI market is characterized by solutions that provide industry-specific functionalities. These applications are designed to integrate into the workflows of sectors like healthcare, finance, and manufacturing.
The demand is driven by the need for tools that understand domain nuances, from regulatory compliance to diagnostic accuracy. For example, AI-powered diagnostics and AI-powered recommendation engines are becoming standard.
However, a significant barrier remains, as 61% of firms report a lack of experience with AI governance tools. This challenge highlights the need for user-friendly vertical generative AI and agentic orchestration platforms.
As AI applications in healthcare and AI in financial services mature, the focus shifts to deploying deep learning models for contextual automation and AI-driven personalization to achieve a competitive edge.
Effective AI in manufacturing automation relies heavily on specialized AI-powered robots and robust computer vision algorithms. The growth of cloud-based AI platforms facilitates this adoption.
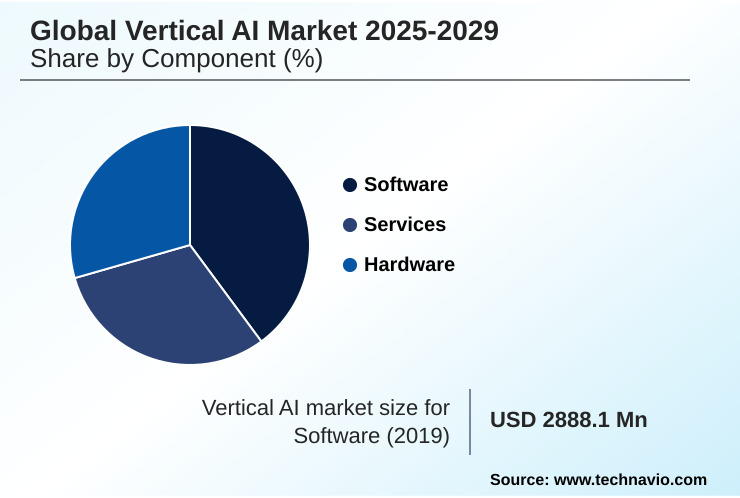
The Software segment was valued at USD 21.49 billion in 2023 and showed a gradual increase during the forecast period.
Regional Analysis
North America is estimated to contribute 38.2% to the growth of the global market during the forecast period.Technavio’s analysts have elaborately explained the regional trends and drivers that shape the market during the forecast period.
See How Vertical AI Market Demand is Rising in North America Get Free Sample
North America is projected to contribute 38.2% of the market's incremental growth, leading global adoption of industry-specific AI solutions. This dominance is fueled by substantial investments in AI applications in healthcare and AI in financial services.
In APAC, rapid digitalization is driving demand for AI for retail personalization and AI in manufacturing automation. European markets focus on regulatory technology AI, integrating AI governance tools to ensure compliance.
The widespread adoption of cloud-based AI platforms accelerates the deployment of customized generative AI and agentic automation globally. The use of AI-powered traffic management in AI for smart city infrastructure projects is a growing trend across regions.
In contrast, emerging economies are leveraging AI in agritech to address food security challenges, demonstrating the technology's versatile impact on diverse economic landscapes.
Market Dynamics
Our researchers analyzed the data with 2024 as the base year, along with the key drivers, trends, and challenges. A holistic analysis of drivers will help companies refine their marketing strategies to gain a competitive advantage.
- The strategic implementation of vertical AI solutions for regulatory compliance is becoming a critical differentiator for businesses, especially as customizing large language models for finance and other regulated sectors gains momentum.
- The choice between on-premises deployment of vertical AI solutions and cloud-based platforms for vertical AI often depends on data security needs and legacy system constraints, with enterprise AI integration with legacy systems being a key consideration. In industrial settings, AI-powered predictive maintenance in manufacturing is proven to reduce downtime more effectively than traditional methods.
- Similarly, the impact of AI on customer service automation is profound, freeing human agents for complex tasks. Vertical AI applications in algorithmic trading are reshaping financial markets, while vertical AI for fraud detection systems provides an essential layer of security. The benefits of generative AI in pharmaceutical drug discovery and using AI models for clinical diagnostics are accelerating healthcare innovation.
- In retail, the benefits of AI in retail personalization are clear, and how AI improves supply chain automation is a central focus for logistics firms.
- From automotive AI systems for autonomous vehicles to AI-driven credit scoring for financial inclusion using advanced machine learning models for credit underwriting, and even AI applications in legal contract analysis, specialized AI is creating tangible value. The adoption of vertical AI implementation in precision agriculture and the role of vertical AI in smart grids further highlight its transformative potential.
What are the key market drivers leading to the rise in the adoption of Vertical AI Industry?
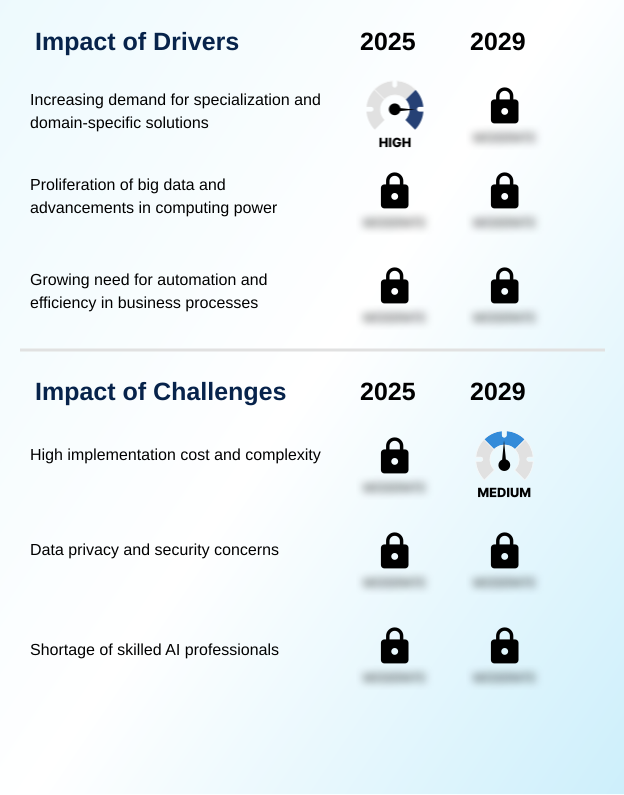
- The increasing demand for specialized, domain-specific solutions that address unique industry challenges is a key driver fueling market growth.
- The demand for industry-specific AI solutions that address complex, domain-specific challenges is a primary market driver.
- Businesses are moving beyond generic platforms to adopt AI applications in healthcare and AI in financial services that deliver measurable results, such as enhanced clinical decision-making and robust real-time fraud detection.
- The proliferation of big data, combined with advancements in deep learning models, fuels this trend. In manufacturing, AI for supply chain optimization and AI-powered quality control are becoming essential for maintaining a competitive edge.
- North America’s market leadership, contributing 38.2% to incremental growth, underscores the strong demand.
- Yet, the talent gap remains a significant factor, with 61% of firms citing a lack of expertise, which ironically drives the need for more intuitive vertical SaaS solutions.
What are the market trends shaping the Vertical AI Industry?
- The proliferation of generative AI within core vertical operations is an emerging trend. This evolution is reshaping industry-specific workflows and creating new opportunities for innovation.
- Key trends are reshaping the market, led by the integration of vertical generative AI into core operations. This shift enables hyper-personalization at scale and drives the development of advanced AI-powered diagnostics and predictive maintenance AI.
- While AI in legal technology and AI for drug discovery showcase significant innovation, adoption is constrained by talent shortages, with 61% of firms reporting a lack of experience with relevant tools. The growth of AI in entertainment and media and AI in aerospace and defense highlights the technology's expanding footprint.
- The market's momentum is evident in regions like North America, which accounts for 38.2% of incremental growth. This is driven by sophisticated algorithmic trading systems and the adoption of AI-powered traffic management in smart cities, supported by enterprise-focused AI hardware and specialized AI chips.
What challenges does the Vertical AI Industry face during its growth?
- High implementation costs and the intrinsic complexity of deploying customized AI solutions present a key challenge affecting widespread industry adoption.
- Significant challenges temper market growth, primarily vertical AI implementation costs and persistent data privacy in AI systems. A recent breach that exposed 190 million patient records underscores the critical need for robust AI for cybersecurity threats and effective AI model risk management.
- Furthermore, a pervasive talent shortage is a major obstacle; a survey revealed that 61% of firms lack experience with essential AI tools, and 53% struggle with integrating new technology into legacy systems.
- This skills gap complicates both on-premises AI deployment and the management of cloud-based AI platforms, hindering progress in areas like AI in insurance claims processing and AI for credit risk analysis. These vertical AI adoption challenges require strategic investment in both technology and workforce development.
Exclusive Technavio Analysis on Customer Landscape
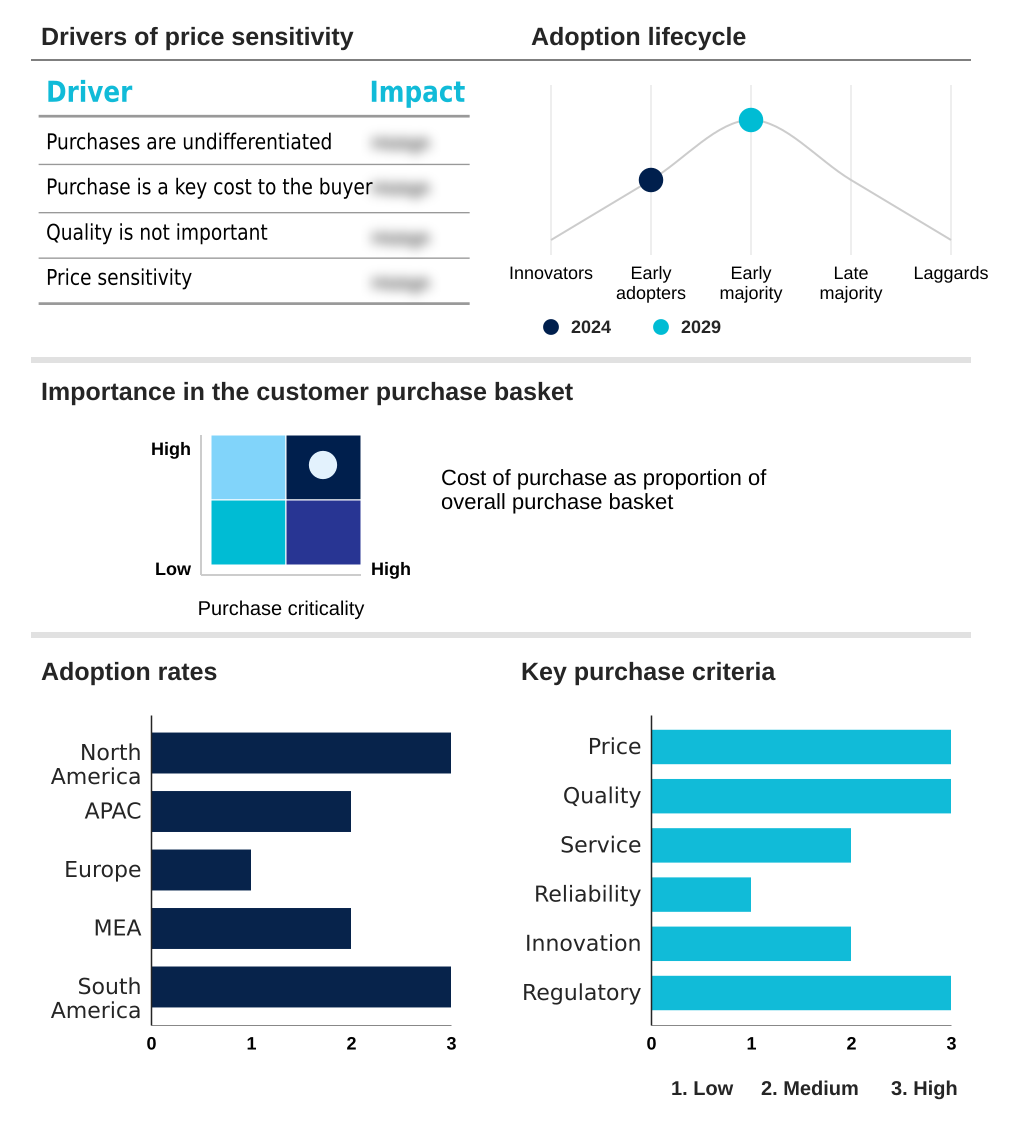
The vertical ai market forecasting report includes the adoption lifecycle of the market, covering from the innovator’s stage to the laggard’s stage. It focuses on adoption rates in different regions based on penetration. Furthermore, the vertical ai market report also includes key purchase criteria and drivers of price sensitivity to help companies evaluate and develop their market growth analysis strategies.
Customer Landscape of Vertical AI Industry
Competitive Landscape
Companies are implementing various strategies, such as strategic alliances, vertical ai market forecast, partnerships, mergers and acquisitions, geographical expansion, and product/service launches, to enhance their presence in the industry.
Accenture PLC - Delivering agentic automation and generative intelligence for key sectors through industry-specific copilots and AI navigation tools.
The industry research and growth report includes detailed analyses of the competitive landscape of the market and information about key companies, including:
- Accenture PLC
- Alphabet Inc.
- Amazon Web Services Inc.
- C3.ai Inc.
- CentralReach LLC
- Counsel AI Corp.
- Fieldguide Inc.
- H2O.ai Inc.
- HighRadius Corp.
- IBM Corp.
- LeadGenius
- Matellio Inc.
- Microsoft Corp.
- NVIDIA Corp.
- Oracle Corp.
- Salesforce Inc.
- Seamless.AI
- Siemens Healthineers AG
- Suki AI Inc.
- ZestFinance Inc.
Qualitative and quantitative analysis of companies has been conducted to help clients understand the wider business environment as well as the strengths and weaknesses of key industry players. Data is qualitatively analyzed to categorize companies as pure play, category-focused, industry-focused, and diversified; it is quantitatively analyzed to categorize companies as dominant, leading, strong, tentative, and weak.
Recent Development and News in Vertical ai market
- In August 2024, Volkswagen announced the integration of a ChatGPT-based AI assistant into its vehicle lineup to create a more personalized and intuitive in-car experience.
- In October 2024, Orange France began utilizing generative AI to enhance its customer service operations, aiming to provide more efficient and accurate support across text-based channels.
- In November 2024, Microsoft announced new adapted AI models for various industries, developed with partners to address unique sector-specific requirements and workflows more effectively.
- In February 2025, PEACCEL was awarded the French DeepTech label for its AI-driven platform for biologics, designed to accelerate drug discovery for large molecule drugs.
Dive into Technavio’s robust research methodology, blending expert interviews, extensive data synthesis, and validated models for unparalleled Vertical AI Market insights. See full methodology.
| Market Scope | |
|---|---|
| Page number | 305 |
| Base year | 2024 |
| Historic period | 2019-2023 |
| Forecast period | 2025-2029 |
| Growth momentum & CAGR | Accelerate at a CAGR of 24.3% |
| Market growth 2025-2029 | USD 126650.4 million |
| Market structure | Fragmented |
| YoY growth 2024-2025(%) | 21.7% |
| Key countries | US, Canada, Mexico, China, Japan, South Korea, India, Australia, Indonesia, Germany, UK, France, Italy, Spain, The Netherlands, UAE, Saudi Arabia, Israel, South Africa, Turkey, Brazil, Argentina and Colombia |
| Competitive landscape | Leading Companies, Market Positioning of Companies, Competitive Strategies, and Industry Risks |
Research Analyst Overview
- The Vertical AI Market is characterized by a definitive shift toward solutions leveraging domain-specific datasets to power industry-specific workflows. Boardroom decisions are increasingly centered on whether to build or buy customized generative AI capabilities, balancing innovation with the high cost of deployment.
- The core of this market involves vertical generative AI and hyper-personalization at scale, which are enabled by technologies like retrieval-augmented generation and agentic orchestration. While AI-powered diagnostics and real-time fraud detection demonstrate clear ROI, a significant hurdle is the talent gap, with a recent survey showing that 61% of firms lack experience with necessary AI governance tools.
- Success hinges on integrating solutions like AI-powered chatbots and AI-powered robots with explainable machine learning to build trust. The development of specialized AI chips, NIM microservices, and enterprise-focused AI hardware supports both cloud and on-premises private AI cloud solution deployments.
- This enables advanced applications from AI-powered quality control and AI-powered surveillance to AI-driven personalization, precision agriculture AI, and complex credit underwriting solutions that redefine clinical decision-making and operational efficiency through agentic automation, generative intelligence, contextual automation, and AI-based credit scoring.
What are the Key Data Covered in this Vertical AI Market Research and Growth Report?
-
What is the expected growth of the Vertical AI Market between 2025 and 2029?
-
USD 126.65 billion, at a CAGR of 24.3%
-
-
What segmentation does the market report cover?
-
The report is segmented by Component (Software, Services, Hardware), Deployment (Cloud-based, On-premises), End-user (IT and telecom, BFSI, Healthcare, Retail, Others) and Geography (North America, APAC, Europe, Middle East and Africa, South America)
-
-
Which regions are analyzed in the report?
-
North America, APAC, Europe, Middle East and Africa and South America
-
-
What are the key growth drivers and market challenges?
-
Increasing demand for specialization and domain-specific solutions, High implementation cost and complexity
-
-
Who are the major players in the Vertical AI Market?
-
Accenture PLC, Alphabet Inc., Amazon Web Services Inc., C3.ai Inc., CentralReach LLC, Counsel AI Corp., Fieldguide Inc., H2O.ai Inc., HighRadius Corp., IBM Corp., LeadGenius, Matellio Inc., Microsoft Corp., NVIDIA Corp., Oracle Corp., Salesforce Inc., Seamless.AI, Siemens Healthineers AG, Suki AI Inc. and ZestFinance Inc.
-
Market Research Insights
- The market is defined by a strategic shift towards industry-specific AI solutions that deliver tangible business outcomes. The demand for AI for customer service automation and AI for logistics management is accelerating as organizations seek greater efficiency.
- However, successful on-premises AI deployment and cloud integration face significant hurdles, with 53% of firms reporting problems with integrating new technology and 61% citing a lack of internal expertise. These vertical AI adoption challenges highlight the complexity of managing data privacy in AI systems and executing effective AI model risk management.
- As AI for talent acquisition becomes more sophisticated, companies are better able to address these skill gaps, while vertical SaaS solutions offer a more accessible entry point for specialized applications in sectors like AI in public sector services.
We can help! Our analysts can customize this vertical ai market research report to meet your requirements.
 RIA -
RIA - 
