
Viral Vector Manufacturing Market Size 2026-2030
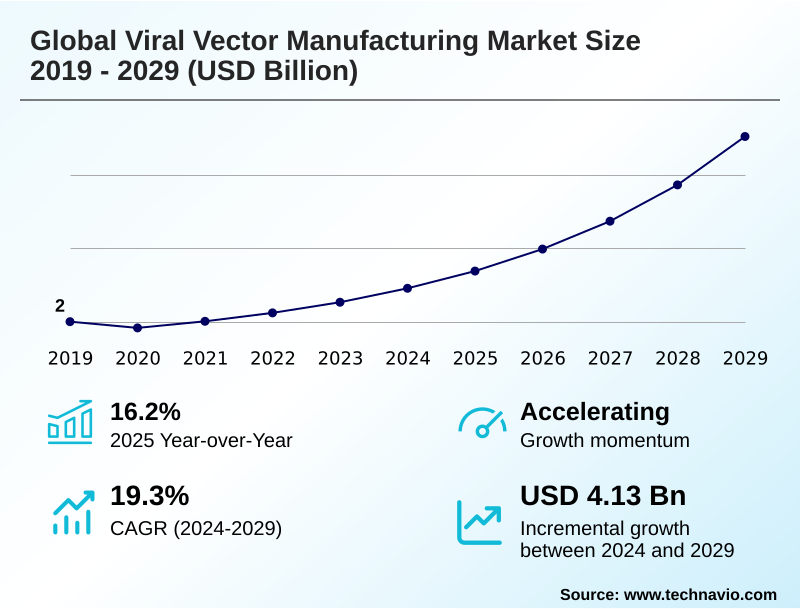
The viral vector manufacturing market size is valued to increase by USD 5.48 billion, at a CAGR of 21.2% from 2025 to 2030. Robust pipeline and favorable regulatory environment will drive the viral vector manufacturing market.
Major Market Trends & Insights
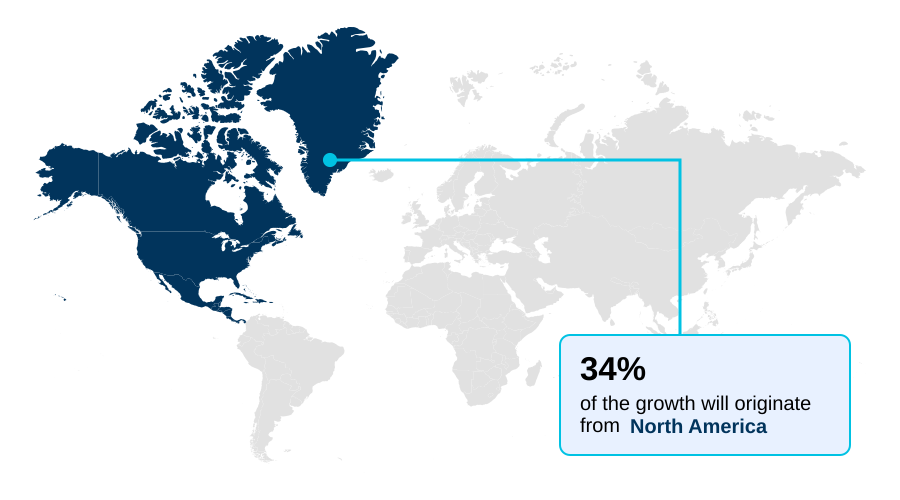
- North America dominated the market and accounted for a 36.4% growth during the forecast period.
- By Manufacturing Type - In-house manufacturing segment was valued at USD 1.90 billion in 2024
- By Application - Genetic disorders segment accounted for the largest market revenue share in 2024
Market Size & Forecast
- Market Opportunities: USD 7.03 billion
- Market Future Opportunities: USD 5.48 billion
- CAGR from 2025 to 2030 : 21.2%
Market Summary
- The viral vector manufacturing market is foundational to the advancement of gene and cell therapies, focusing on the complex bioprocess of producing delivery vehicles for therapeutic genetic material. Growth is fueled by an expanding clinical pipeline for indications in oncology, as well as rare and genetic disorders.
- A key trend involves a strategic pivot by larger therapeutic developers toward in-house manufacturing to secure supply chains and protect intellectual property, contrasting with the dominant outsourcing model favored by smaller biotechs.
- For instance, a mid-sized company faces a critical decision: invest heavily in a dedicated facility, which offers long-term cost benefits and control but carries high upfront capital risk, or partner with a contract development and manufacturing organization (CDMO) to accelerate market entry, despite higher per-batch costs and potential capacity constraints.
- This decision is complicated by persistent challenges, including supply chain vulnerabilities for critical raw materials like GMP-grade plasmids, analytical hurdles in ensuring vector quality and potency, and a significant shortage of specialized talent. Technological innovation in scalable production platforms and advanced analytical methods remains crucial to overcoming these obstacles and enabling broader patient access to these transformative medicines.
What will be the Size of the Viral Vector Manufacturing Market during the forecast period?
Get Key Insights on Market Forecast (PDF) Get Free Sample
How is the Viral Vector Manufacturing Market Segmented?
The viral vector manufacturing industry research report provides comprehensive data (region-wise segment analysis), with forecasts and estimates in "USD million" for the period 2026-2030, as well as historical data from 2020-2024 for the following segments.
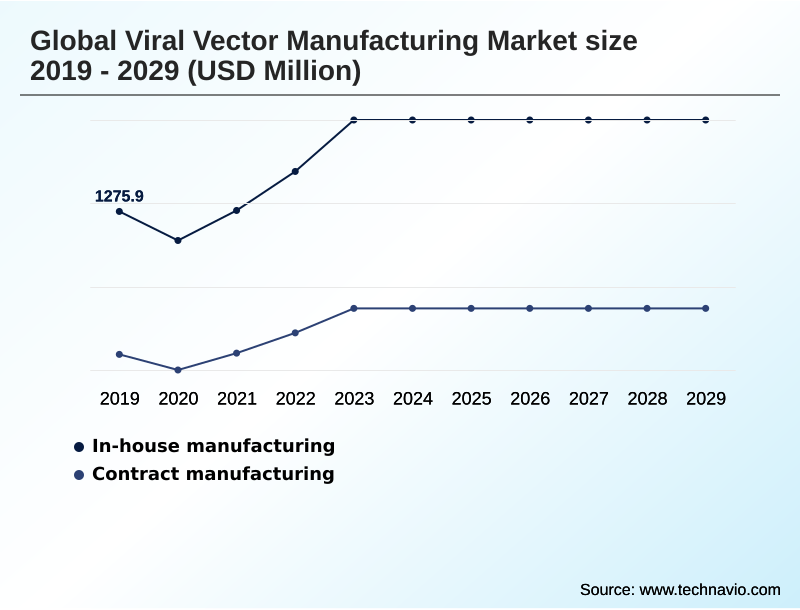
- Manufacturing type
- In-house manufacturing
- Contract manufacturing
- Application
- Genetic disorders
- Infectious disease
- Cancer
- Neurological disorders
- Others
- Type
- Adeno-associated viral (AAV) vectors
- Lentiviral vectors
- Adenoviral vectors
- Others
- Geography
- North America
- US
- Canada
- Mexico
- Europe
- Germany
- UK
- France
- Asia
- Rest of World (ROW)
- North America
By Manufacturing Type Insights
The in-house manufacturing segment is estimated to witness significant growth during the forecast period.
The in-house manufacturing segment is a strategic component of the viral vector manufacturing market, where firms establish dedicated facilities for development and production.
This model provides comprehensive control over the manufacturing lifecycle, from upstream process development to downstream purification, safeguarding proprietary technologies. By internalizing operations, organizations can meticulously protect critical intellectual property, a major concern in the competitive cell and gene therapy landscape.
Direct oversight allows for unparalleled quality assurance and regulatory adherence, minimizing third-party risks and securing the biopharmaceutical supply chain. The adoption of this model has been shown to reduce production timelines by over 25% for companies with robust therapeutic pipelines.
This approach utilizes gmp-grade plasmids and requires significant analytical method development, making the technology transfer process a critical internal function.
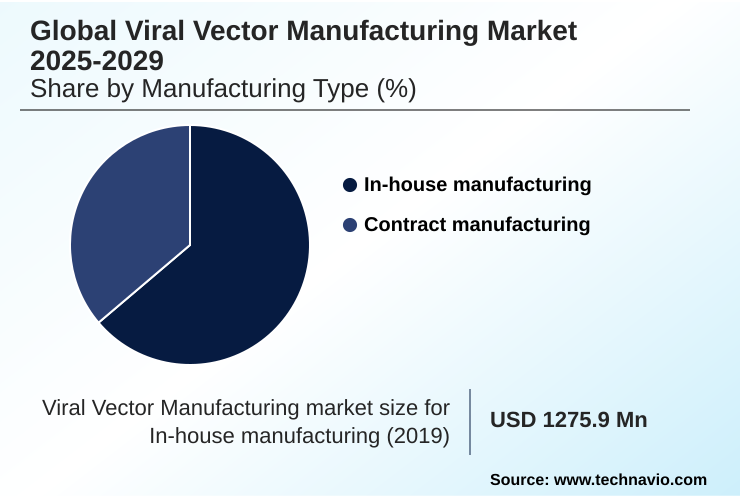
The In-house manufacturing segment was valued at USD 1.90 billion in 2024 and showed a gradual increase during the forecast period.
Regional Analysis
North America is estimated to contribute 36.4% to the growth of the global market during the forecast period.Technavio’s analysts have elaborately explained the regional trends and drivers that shape the market during the forecast period.
See How Viral Vector Manufacturing Market Demand is Rising in North America Get Free Sample
The geographic landscape of the viral vector manufacturing market is characterized by established leadership and rapid emergence.
North America continues to dominate, accounting for over 36% of incremental growth opportunities, driven by its dense ecosystem of biotechnology firms and significant R&D investment in gene therapy manufacturing.
However, Asia is quickly closing the gap, with substantial government funding fostering the creation of advanced GMP facility design and commercial-scale manufacturing hubs.
New facilities in emerging regions are leveraging advanced bioprocess automation, enabling them to achieve production efficiencies that reduce turnaround times by over 20%.
This global expansion addresses the high demand for clinical-grade vector supply, with a focus on viral safety testing and quality control in biologics to meet diverse regulatory standards.
The development of regional expertise is crucial for a resilient biopharmaceutical supply chain.
Market Dynamics
Our researchers analyzed the data with 2025 as the base year, along with the key drivers, trends, and challenges. A holistic analysis of drivers will help companies refine their marketing strategies to gain a competitive advantage.
- The strategic landscape of the viral vector manufacturing market is defined by the intricate technical and operational decisions firms must navigate. Key considerations include AAV vector manufacturing for neurological disorders and lentiviral vector production for CAR-T therapy, each presenting unique challenges.
- Optimizing the full to empty capsid ratio in AAV production is a critical quality attribute that directly impacts therapeutic efficacy and dosage requirements. Operationally, the decision between in-house vs outsourced viral vector manufacturing involves complex trade-offs between capital investment and supply chain control. For many, scaling up suspension culture for viral vectors is the only viable path to commercial volumes.
- This transition is dependent on securing a reliable source of GMP plasmid DNA for viral vector production. The entire process is scrutinized through the lens of analytical challenges in viral vector characterization, where techniques must be robust enough to satisfy global regulatory pathways for viral vector-based therapies.
- Firms leveraging templated platforms for the technology transfer for viral vector processes report development timelines up to twice as fast as those using bespoke approaches. This efficiency is critical, as the cost-effective downstream purification of lentivirus remains a significant hurdle. The development of advanced analytical methods for viral vectors, including viral vector potency assay development, is ongoing.
- Furthermore, strategies for reducing viral vector immunogenicity, ensuring long-term stability of viral vectors, and managing the supply chain for viral vector manufacturing are paramount. Innovations in viral vector formulation and delivery, along with advancements in cell line development for viral vector production, are pushing the industry forward.
- Ultimately, the successful commercialization of these therapies hinges on mastering these complexities, from the nuances of adeno-associated virus purification methods to the broader strategies for addressing the viral vector manufacturing bottleneck.
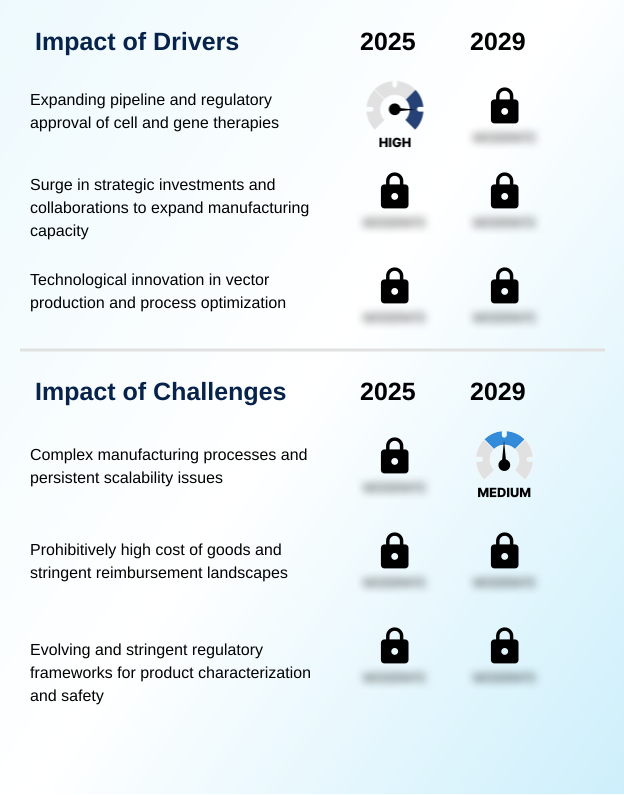
What are the key market drivers leading to the rise in the adoption of Viral Vector Manufacturing Industry?
- A robust clinical pipeline for gene and cell therapies, coupled with a favorable and evolving regulatory environment, serves as a primary driver for the market.
- The viral vector manufacturing market's growth is propelled by a confluence of scientific and commercial drivers. The expanding clinical pipeline for advanced therapy medicinal products (atMPs) creates unrelenting demand for high-titer vector production.
- This is supported by a significant influx of capital, enabling the construction of state-of-the-art facilities and investment in bioprocess engineering.
- Technological innovation is a primary driver; for instance, the shift from adherent to scalable suspension-based culture systems has enabled a 10-fold increase in production volume in some processes.
- Similarly, innovations in downstream processing, such as new chromatography methods, are improving vector recovery rates to over 80%.
- These advancements, coupled with progress in plasmid dna manufacturing and cell banking services, are crucial for meeting the demands of a maturing market.
What are the market trends shaping the Viral Vector Manufacturing Industry?
- A key trend is the strategic shift toward vertical integration by therapeutic developers establishing in-house manufacturing. This move is aimed at gaining greater control over production timelines and safeguarding intellectual property.
- Key trends in viral vector manufacturing are reshaping the production landscape to address scalability and quality. A strategic shift towards vertical integration allows developers greater control, while the adoption of standardized production platforms accelerates timelines to GMP manufacturing by up to 50% compared to bespoke process development. This industrialization relies on advances in aseptic processing and CHO cell line development.
- The most significant trend is the intensified focus on advanced analytical characterization. The implementation of robust vector characterization assays, especially for determining the full to empty capsid ratio, has improved accuracy by over 20%, ensuring higher product quality and safety.
- This emphasis on analytics, from viral clearance studies to final fill-finish services, is critical for navigating regulatory submission support and is a cornerstone of modern gene therapy manufacturing.
What challenges does the Viral Vector Manufacturing Industry face during its growth?
- A key challenge affecting industry growth is securing a consistent supply of high-quality raw materials within a reliable supply chain.
- The viral vector manufacturing market faces significant operational and technical challenges that constrain its growth potential. A primary restraint is the fragile supply chain for critical raw materials, where lead times for GMP-grade plasmids can exceed nine months, severely disrupting production schedules.
- This is compounded by analytical bottlenecks; the development and validation of new analytical method development for complex vector characterization assays can be a lengthy process, delaying batch release. Furthermore, a critical shortage of a specialized workforce, particularly in bioprocess engineering and quality control, has led to a 25% increase in recruitment costs for some organizations.
- This talent deficit impacts everything from viral safety testing to cryopreservation of vectors, hindering the industry's ability to scale and innovate efficiently despite advancements in perfusion culture technology.
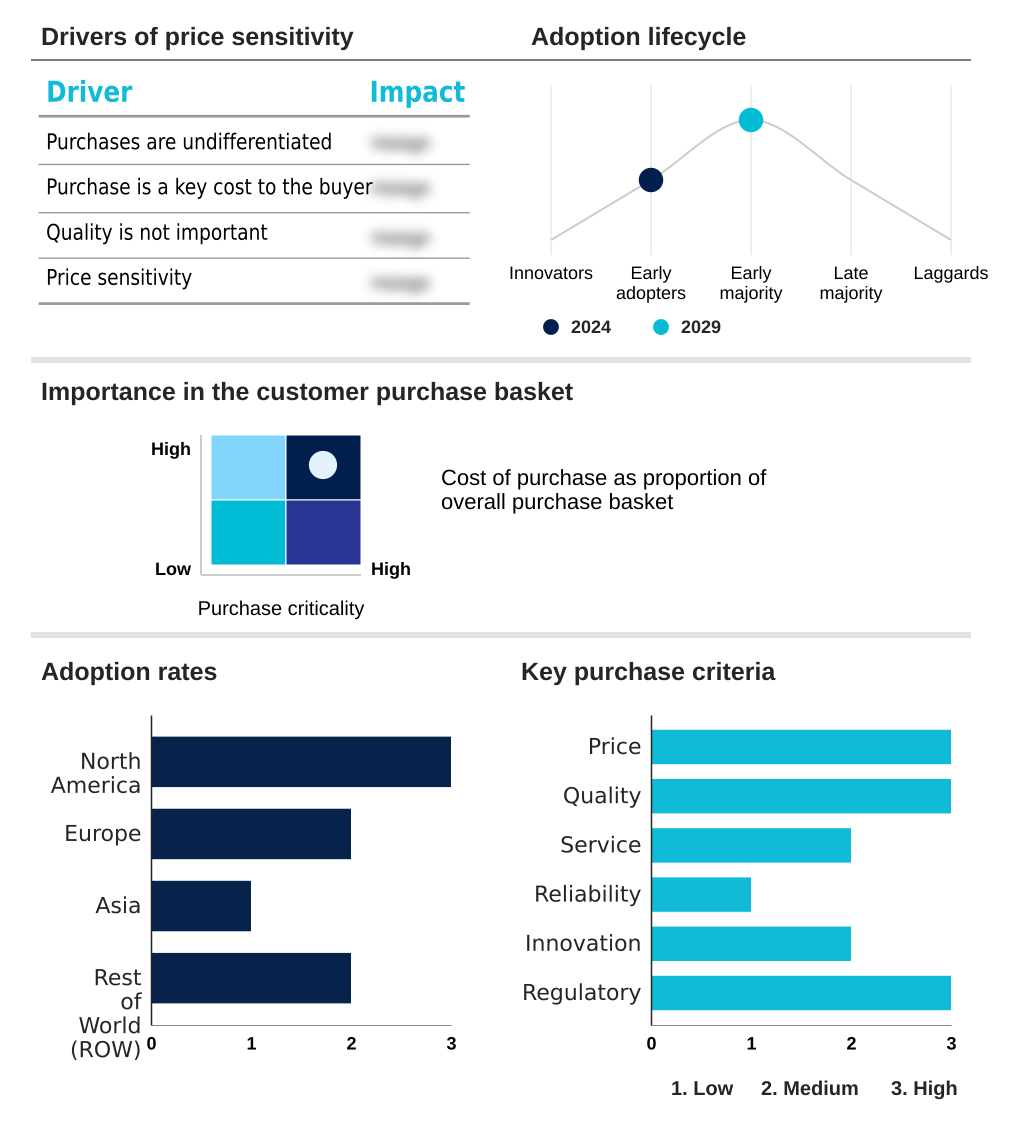
Exclusive Technavio Analysis on Customer Landscape
The viral vector manufacturing market forecasting report includes the adoption lifecycle of the market, covering from the innovator’s stage to the laggard’s stage. It focuses on adoption rates in different regions based on penetration. Furthermore, the viral vector manufacturing market report also includes key purchase criteria and drivers of price sensitivity to help companies evaluate and develop their market growth analysis strategies.
Customer Landscape of Viral Vector Manufacturing Industry
Competitive Landscape
Companies are implementing various strategies, such as strategic alliances, viral vector manufacturing market forecast, partnerships, mergers and acquisitions, geographical expansion, and product/service launches, to enhance their presence in the industry.
ABL Inc. - Offers comprehensive viral vector production, covering AAV, adenovirus, lentivirus, and oncolytic vectors, with integrated GMP process development and fill-finish services for therapeutic applications.
The industry research and growth report includes detailed analyses of the competitive landscape of the market and information about key companies, including:
- ABL Inc.
- AGC Biologics
- Aldevron LLC
- Andelyn Biosciences
- Batavia Biosciences BV
- Charles River Laboratories International Inc.
- Forge Biologics Inc.
- FUJIFILM Holdings Corp.
- Genezen
- Lonza Group Ltd.
- Novartis AG
- OBiO Technology Corp. Ltd.
- Oxford Biomedica plc
- Recipharm AB
- REGENXBIO Inc
- Sigma Aldrich Chemicals Ltd.
- Sirion Biotech GmbH
- SK Pharmteco
- Takara Bio Inc.
- Thermo Fisher Scientific Inc.
Qualitative and quantitative analysis of companies has been conducted to help clients understand the wider business environment as well as the strengths and weaknesses of key industry players. Data is qualitatively analyzed to categorize companies as pure play, category-focused, industry-focused, and diversified; it is quantitatively analyzed to categorize companies as dominant, leading, strong, tentative, and weak.
Recent Development and News in Viral vector manufacturing market
- In September 2024, Asimov and AGC Biologics announced a collaboration to develop a cost-effective and secure manufacturing approach for viral vector production, addressing key industry bottlenecks.
- In February 2025, Novartis announced the opening of a new, highly automated viral vector manufacturing facility in Slovenia to support its portfolio of cell and gene therapies.
- In March 2025, WuXi Biologics announced an accelerated growth forecast, citing the launch of new viral vector manufacturing capacity in Asia as a key driver.
- In April 2025, the US National Security Commission on Emerging Biotechnology recommended the creation of simpler, faster regulatory pathways for biotechnology products, impacting the viral vector development landscape.
Dive into Technavio’s robust research methodology, blending expert interviews, extensive data synthesis, and validated models for unparalleled Viral Vector Manufacturing Market insights. See full methodology.
| Market Scope | |
|---|---|
| Page number | 301 |
| Base year | 2025 |
| Historic period | 2020-2024 |
| Forecast period | 2026-2030 |
| Growth momentum & CAGR | Accelerate at a CAGR of 21.2% |
| Market growth 2026-2030 | USD 5475.7 million |
| Market structure | Fragmented |
| YoY growth 2025-2026(%) | 17.5% |
| Key countries | US, Canada, Mexico, Germany, UK, France, Italy, Spain, The Netherlands, China, Japan, India, South Korea, Thailand, Indonesia, Brazil, Saudi Arabia, UAE, Turkey, South Africa, Argentina, Colombia and Israel |
| Competitive landscape | Leading Companies, Market Positioning of Companies, Competitive Strategies, and Industry Risks |
Research Analyst Overview
- The viral vector manufacturing market is navigating a period of intense demand-driven expansion, where production capacity remains a critical constraint. The industry is defined by its core technologies, including adeno-associated viral (aav) vectors, lentiviral vectors, and adenoviral vectors, which are essential for both in vivo gene therapy and ex vivo gene modification.
- A pivotal trend is the adoption of process analytical technology (pat) to improve manufacturing consistency, a boardroom-level decision that pits significant capital expenditure against the long-term benefits of enhanced regulatory compliance and reduced batch failure rates.
- Progress hinges on optimizing the entire bioprocess, from the development of stable producer cell lines and the quality of gmp-grade plasmids to innovations in downstream purification and chromatography methods. Key quality metrics, such as the full to empty capsid ratio and transduction efficiency, are under intense scrutiny, driving the adoption of advanced analytical ultracentrifugation, next-generation sequencing, and mass spectrometry.
- For example, implementing advanced chromatography methods has been shown to increase downstream purification yields by over 30%. However, challenges like insertional mutagenesis with certain vectors, the risk of replication-competent adenovirus (rca), and the complexities of scaling suspension-based culture and transient transfection methods persist.
- Success in this field relies on a deep understanding of these interconnected technical elements, from charge detection mass spectrometry to oncolytic virotherapy.
What are the Key Data Covered in this Viral Vector Manufacturing Market Research and Growth Report?
-
What is the expected growth of the Viral Vector Manufacturing Market between 2026 and 2030?
-
USD 5.48 billion, at a CAGR of 21.2%
-
-
What segmentation does the market report cover?
-
The report is segmented by Manufacturing Type (In-house manufacturing, and Contract manufacturing), Application (Genetic disorders, Infectious disease, Cancer, Neurological disorders, and Others), Type (Adeno-associated viral (AAV) vectors, Lentiviral vectors, Adenoviral vectors, and Others) and Geography (North America, Europe, Asia, Rest of World (ROW))
-
-
Which regions are analyzed in the report?
-
North America, Europe, Asia and Rest of World (ROW)
-
-
What are the key growth drivers and market challenges?
-
Robust pipeline and favorable regulatory environment, Securing consistent and high-quality raw materials and consistent supply chain
-
-
Who are the major players in the Viral Vector Manufacturing Market?
-
ABL Inc., AGC Biologics, Aldevron LLC, Andelyn Biosciences, Batavia Biosciences BV, Charles River Laboratories International Inc., Forge Biologics Inc., FUJIFILM Holdings Corp., Genezen, Lonza Group Ltd., Novartis AG, OBiO Technology Corp. Ltd., Oxford Biomedica plc, Recipharm AB, REGENXBIO Inc, Sigma Aldrich Chemicals Ltd., Sirion Biotech GmbH, SK Pharmteco, Takara Bio Inc. and Thermo Fisher Scientific Inc.
-
Market Research Insights
- The viral vector manufacturing market is shaped by a dynamic interplay of technological advancement and capacity constraints. The adoption of single-use bioreactor systems has been a pivotal part of scalable manufacturing solutions, reducing cleaning and validation times by up to 40% and directly impacting cost of goods reduction. This shift supports the growing demand for clinical-grade vector supply.
- Concurrently, bioprocess automation is enhancing consistency in high-titer vector production, with some platforms reporting a 15% decrease in out-of-specification events. As the industry advances, the technology transfer process remains a critical juncture where standardized protocols can significantly de-risk the transition from development to commercial-scale manufacturing, ensuring the integrity of the biopharmaceutical supply chain.
- These advancements are essential for navigating the complex landscape of cell and gene therapy vector production.
We can help! Our analysts can customize this viral vector manufacturing market research report to meet your requirements.
 RIA -
RIA - 
