VXI Test Equipment Market Analysis North America, APAC, Europe, Middle East and Africa, South America - US, China, Germany, Japan, South Korea - Size and Forecast 2024-2028

VXI Test Equipment Market Analysis North America, APAC, Europe, Middle East and Africa, South America - US, China, Germany, Japan, South Korea - Size and Forecast 2024-2028

Published: Jul 2024 136 Pages SKU: IRTNTR72548

Market Overview at a Glance

$67.2 B
Market Opportunity
26.39%
CAGR
20.53
YoY growth 2023-2024(%)

VXI Test Equipment Market Size 2024-2028 

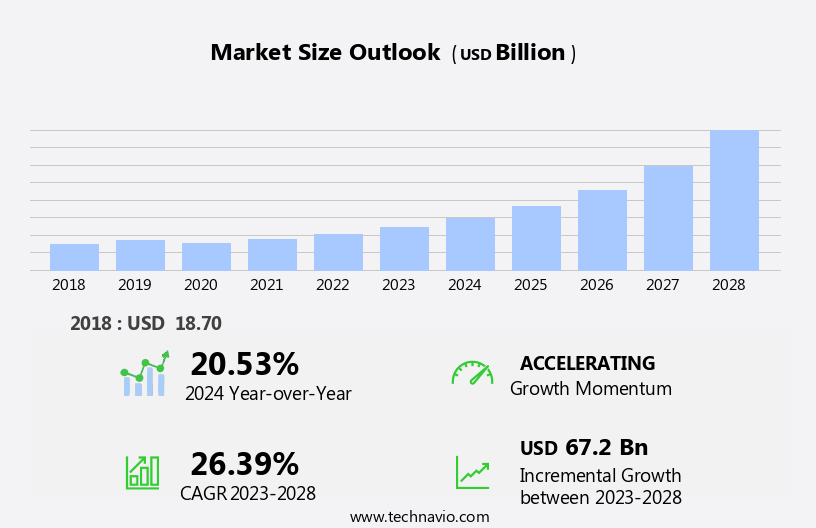
The VXI test equipment market size is forecast to increase by USD 67.2 billion at a CAGR of 26.39% between 2023 and 2028. 

  • The market is experiencing significant growth due to the increasing production of electronic devices such as smartphones, tablets, smartwatches, and smart thermostats. The demand for interoperability among these devices is driving the need for advanced testing solutions. 
  • Additionally, the market is witnessing a trend towards price-sensitive and multi-technology solutions to cater to various industries, including automotive electronics and UHD TVs. Furthermore, the growing popularity of fitness and activity trackers is expanding the scope of the market. This report provides an in-depth analysis of the market growth factors and trends, enabling stakeholders to make informed decisions.

What will be the Size of the Market During the Forecast Period?

VXI Test Equipment Market Size

 Request Free Sample

  • The market is a significant segment of the test and measurement industry, catering to various applications in diverse sectors. Several factors, including the increasing demand for advanced test solutions in multiple industries, drive this market. The semiconductor chip volume is a primary growth driver for the market. With the continuous expansion of the semiconductor industry, there is a growing need for sophisticated test equipment to ensure the quality and reliability of semiconductor devices. Moreover, the consumer electronics sector is another significant contributor to the market growth.
  • Furthermore, the increasing popularity of smartphones, tablets, smartwatches, and other wearable devices has led to an escalating demand for VXI test equipment to ensure their optimal performance and functionality. Furthermore, the automotive electronics industry is also a significant consumer of VXI test equipment. The growing adoption of advanced driver assistance systems (ADAS) and electric vehicles (EVs) necessitates rigorous testing to meet safety and performance standards. 
  • Additionally, the communications sector is another key market for VXI test equipment. With the increasing deployment of 5G networks and the Internet of Things (IoT), there is a growing need for advanced test solutions to ensure seamless connectivity and communication. Moreover, in the industrial electronics sector, VXI test equipment is used extensively for product quality control and process optimization. The increasing adoption of Industry 4.0 and smart manufacturing has further boosted the demand for advanced test solutions. Moreover, the defense sector and the aerospace industry are other significant consumers of VXI test equipment. The need for reliable and high-performance test solutions to ensure the functionality and safety of complex systems in these sectors is driving market growth.

Market Segmentation

The market research report provides comprehensive data (region-wise segment analysis), with forecasts and estimates in "USD billion" for the period 2024-2028, as well as historical data from 2018-2022 for the following segments. 
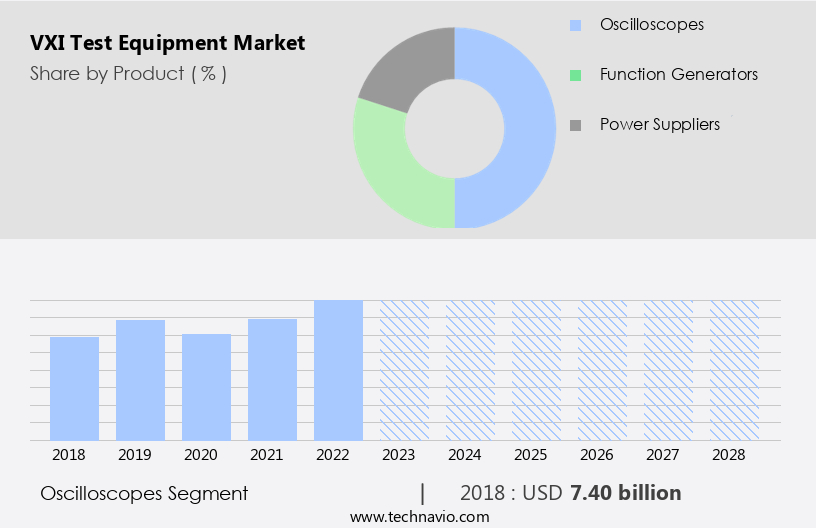
  • Product
    • Oscilloscopes
    • Function generators
    • Power suppliers
  • End User
    • Consumer Electronics
    • Communications
    • Aerospace, Military and Defense
    • Industrial Electronics
    • Others
  • Geography
    • North America
      • US
    • APAC
      • China
      • Japan
      • South Korea
    • Europe
      • Germany
    • Middle East and Africa
    • South America

By Product Insights

The oscilloscopes segment is estimated to witness significant growth during the forecast period. Oscilloscopes are essential VXI testing instruments used to examine voltage or current flow in electric devices or components. They are primarily utilized for displaying and interpreting the waveforms of electrical signals. Key applications of oscilloscopes encompass power analysis, data analysis for serial communication, jitter assessment, testing of data storage devices, and time-domain reflectometry. Furthermore, they serve purposes such as measuring time and voltage, bandwidth, differential voltage, and phase and rise time. In the automotive sector, oscilloscopes are employed to analyze ignition systems. Three primary types of oscilloscopes exist: analog, digital, and PC-based. Analog oscilloscopes provide a continuous display of waveforms, while digital oscilloscopes offer enhanced features like higher resolution, better accuracy, and larger memory depth.

Furthermore, PC-based oscilloscopes enable users to analyze signals using software installed on their computers. The demand for oscilloscopes is driven by the increasing use of electronic devices such as smartphones, tablets computers, smartwatches, smart thermostats, UHD TVs, fitness and activity trackers, and automotive electronics. Oscilloscopes are indispensable tools for R&D, production, and maintenance of these devices. As technology advances, oscilloscopes continue to evolve, offering more advanced features and higher performance.

VXI Test Equipment Market Size

Get a glance at the share of various segments. Request Free Sample

The oscilloscopes segment was valued at USD 7.40 billion in 2018 and showed a gradual increase during the forecast period.

Regional Insights

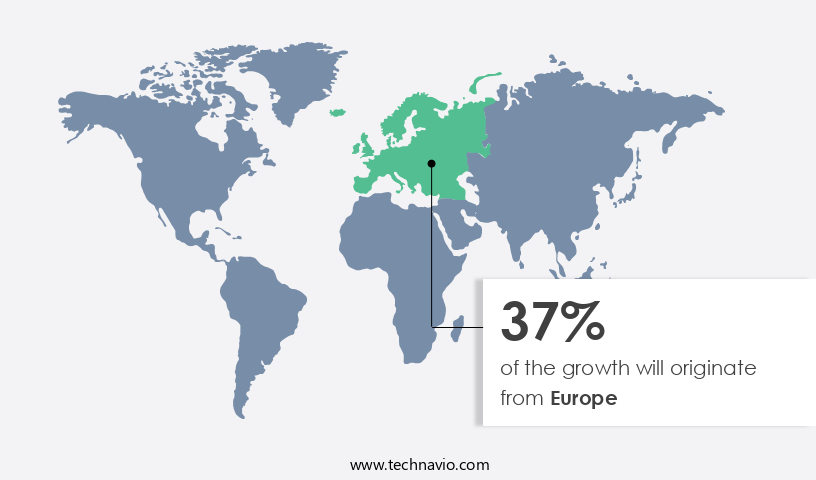
Europe is estimated to contribute 37% to the growth of the global market during the forecast period. Technavio's analysts have elaborately explained the regional trends and drivers that shape the market during the forecast period.

VXI Test Equipment Market Share by Geography

For more insights on the market share of various regions Request Free Sample

In the North American market, the United States holds a substantial position in the growth of the VXI test equipment industry. The US dominance is attributed to its large semiconductor industry, with a significant presence of integrated device manufacturers, fabrication plants, and research and development centers. However, the US electronics manufacturing sector faces competition from Asian companies due to lower labor and operational costs in those regions. Taiwanese and Chinese firms are capitalizing on this advantage and gaining market share from US-based companies. Despite the competition, the US remains a leading market for research and development due to strong intellectual property rights, a favorable regulatory environment, and abundant financing opportunities.

Market Dynamics

Our researchers analyzed the data with 2023 as the base year, along with the key drivers, trends, and challenges. A holistic analysis of drivers will help companies refine their marketing strategies to gain a competitive advantage.

Market Driver

Augmented production of electronic goods is the key driver of the market. The market is poised for significant expansion in the coming years, driven by the burgeoning communications sector and the industrial electronics industry. Exports of moderately and low-priced equipment from countries like China, Japan, and Singapore are fueling market growth.

The semiconductor and electronics industries' strong expansion in the Asia Pacific region (APAC) is also contributing to the market's growth. Although smartphone sales have plateaued, the increasing shipments of these devices will continue to drive demand for test and measurement equipment. Market fragmentation in North America, Western Europe, and China, along with the decreasing average selling price of smartphones in developed countries, has led to a decline in smartphone sales.

Market Trends

The growing need for interoperability is the upcoming trend in the market. The VXI testing equipment market continues to expand as technology advances, integrating new developments. Simultaneous testing, measurement, and analysis of multiple products are essential features of some test equipment. However, the interoperability challenge arises when new products are incompatible with existing test equipment. This issue transcends various product categories, including video monitors, home networking devices, automated products, smoke alarms, and home gateways, as well as homogeneous devices such as switches and routers. To address these interoperability concerns, manufacturers are focusing on creating versatile test equipment that can be used with a wide range of products. The market is witnessing significant growth as companies strive to offer solutions that cater to the evolving technological landscape.

This approach ensures that businesses can invest in test equipment that remains relevant and effective, regardless of the changing product landscape. In the context of the global economy, the test and measurement market's expansion is influenced by several factors, including the semiconductor chip volume, data acquisition requirements, and the growing demand for consumer electronics.

Market Challenge

The need for price-sensitive and multiple technology solutions is a key challenge affecting the market growth. In the dynamic market, competition is fierce as companies continually invest in research and development to introduce innovative products.

However, the market faces challenges due to rising raw material costs and increasing import duties. These factors, in turn, increase the production costs of test equipment, making it less affordable for price-conscious consumers in the electronics sector. For instance, local Chinese companies offer digital ultrasonic flaw detectors at a USD 1,000 lower price point than leading suppliers.

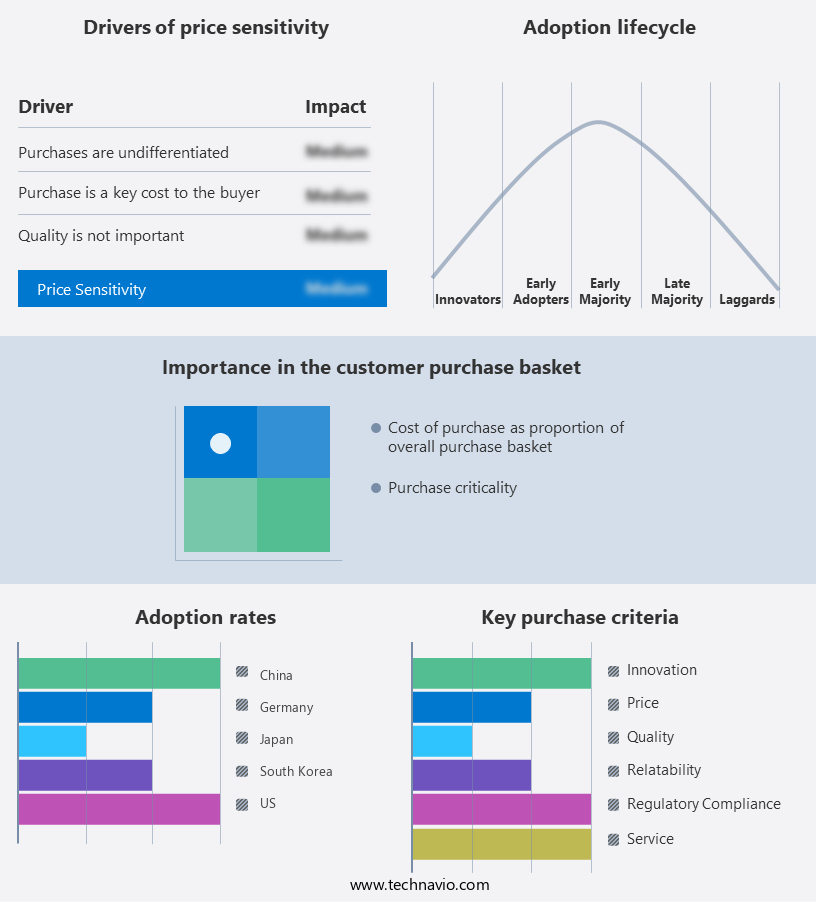
Exclusive Customer Landscape

The market forecasting report includes the adoption lifecycle of the market, covering from the innovator's stage to the laggard's stage. It focuses on adoption rates in different regions based on penetration. Furthermore, the report also includes key purchase criteria and drivers of price sensitivity to help companies evaluate and develop their market growth analysis strategies.

VXI Test Equipment Market Share by Geography

 Customer Landscape

Key Companies & Market Insights

Companies are implementing various strategies, such as strategic alliances, partnerships, mergers and acquisitions, geographical expansion, and product/service launches, to enhance their presence in the market.

Agilent Technologies Inc.- The company offers VXI test equipment that is an ideal standard for all high-density, high-speed applications.

The market research and growth report includes detailed analyses of the competitive landscape of the market and information about key companies, including:

  • Agilent Technologies Inc.
  • Airbus SE
  • AMETEK Inc.
  • Astronics Corp.
  • C and H Technologies Inc.
  • COMTEL Electronics GmbH
  • Data Patterns India Ltd.
  • Giga tronics Inc.
  • ICS Electronics
  • Informtest Holding
  • Keysight Technologies Inc.
  • North Atlantic Industries
  • Phillips Aerospace
  • Pickering Interfaces Ltd.
  • Spanawave Corp.
  • Teradyne Inc.
  • Virginia Panel Corp.
  • Vitrek LLC
  • VX Instruments GmbH
  • W-IE-NE-R Power Electronics GmbH

Qualitative and quantitative analysis of companies has been conducted to help clients understand the wider business environment as well as the strengths and weaknesses of key market players. Data is qualitatively analyzed to categorize companies as pure play, category-focused, industry-focused, and diversified; it is quantitatively analyzed to categorize companies as dominant, leading, strong, tentative, and weak.

Research Analyst Overview

The VXI testing equipment market is a significant segment of the test and measurement industry, catering to various applications in communications, industrial electronics, consumer electronics, and others. VXI, or VMEbus Extensions for Instrumentation, is a high-performance bus system that enables the integration of various test and measurement instruments. The market growth is influenced by several factors, including the increasing semiconductor chip volume, the expanding use of VXI in consumer electronics such as smartphones, tablets, smartwatches, and smart thermostats, and the growing demand for VXI equipment in automotive electronics, UHD TVs, and wearable devices.

Moreover, the market is witnessing significant growth in the defense sector, helicopters, commercial aircraft, and other applications. The market is competitive, with key players offering a wide range of VXI testing equipment. Product pricing is a crucial factor influencing the market's competitiveness. The market's future outlook is promising, with continuous advancements in technology and increasing demand from various end-users. Smartwatches and fitness & activity trackers are increasingly integrated with advanced technologies from companies like National Instruments, enabling more precise health monitoring and real-time data analysis for users.

Market Scope

Report Coverage

Details

Page number

136

Base year

2023

Historic period

2018-2022

Forecast period

2024-2028

Growth momentum & CAGR

Accelerate at a CAGR of 26.39%

Market Growth 2024-2028

USD 67.2 billion

Market structure

Fragmented

YoY growth 2023-2024(%)

20.53

Regional analysis

North America, APAC, Europe, Middle East and Africa, and South America

Performing market contribution

Europe at 37%

Key countries

US, China, Germany, Japan, and South Korea

Competitive landscape

Leading Companies, Market Positioning of Companies, Competitive Strategies, and Industry Risks

Key companies profiled

Agilent Technologies Inc., Airbus SE, AMETEK Inc., Astronics Corp., C and H Technologies Inc., COMTEL Electronics GmbH, Data Patterns India Ltd., Giga tronics Inc., ICS Electronics, Informtest Holding, Keysight Technologies Inc., North Atlantic Industries, Phillips Aerospace, Pickering Interfaces Ltd., Spanawave Corp., Teradyne Inc., Virginia Panel Corp., Vitrek LLC, VX Instruments GmbH, and W-IE-NE-R Power Electronics GmbH

Market dynamics

Parent market analysis, market growth inducers and obstacles, market forecast, fast-growing and slow-growing segment analysis, COVID-19 impact and recovery analysis and future consumer dynamics, market condition analysis for the forecast period

Customization purview

If our market report has not included the data that you are looking for, you can reach out to our analysts and get segments customized.

Request Free Sample

What are the Key Data Covered in this Market Research and Growth Report?

  • CAGR of the market during the forecast period
  • Detailed information on factors that will drive the market growth and forecasting between 2024 and 2028
  • Precise estimation of the size of the market  and its contribution of the market in focus to the parent market
  • Accurate predictions about upcoming market growth and trends and changes in consumer behaviour
  • Growth of the market across North America, APAC, Europe, Middle East and Africa, and South America
  • Thorough analysis of the market's competitive landscape and detailed information about companies
  • Comprehensive analysis of factors that will challenge the growth of market companies

We can help! Our analysts can customize this market research report to meet your requirements. Get in touch

1 Executive Summary

  • 1.1 Market overview
    • Executive Summary - Chart on Market Overview
    • Executive Summary - Data Table on Market Overview
    • Executive Summary - Chart on Global Market Characteristics
    • Executive Summary - Chart on Market by Geography
    • Executive Summary - Chart on Market Segmentation by Product
    • Executive Summary - Chart on Incremental Growth
    • Executive Summary - Data Table on Incremental Growth
    • Executive Summary - Chart on Company Market Positioning

2 Market Landscape

  • 2.1 Market ecosystem
    • Parent Market
    • Data Table on - Parent Market
  • 2.2 Market characteristics
    • Market characteristics analysis
  • 2.3 Value chain analysis
    • Value Chain Analysis

3 Market Sizing

  • 3.1 Market definition
    • Offerings of companies included in the market definition
  • 3.2 Market segment analysis
    • Market segments
  • 3.3 Market size 2023
    • 3.4 Market outlook: Forecast for 2023-2028
      • Chart on Global - Market size and forecast 2023-2028 ($ billion)
      • Data Table on Global - Market size and forecast 2023-2028 ($ billion)
      • Chart on Global Market: Year-over-year growth 2023-2028 (%)
      • Data Table on Global Market: Year-over-year growth 2023-2028 (%)

    4 Historic Market Size

    • 4.1 Global VXI Test Equipment Market 2018 - 2022
      • Historic Market Size - Data Table on Global VXI Test Equipment Market 2018 - 2022 ($ billion)
    • 4.2 Product segment analysis 2018 - 2022
      • Historic Market Size - Product Segment 2018 - 2022 ($ billion)
    • 4.3 Geography segment analysis 2018 - 2022
      • Historic Market Size - Geography Segment 2018 - 2022 ($ billion)
    • 4.4 Country segment analysis 2018 - 2022
      • Historic Market Size - Country Segment 2018 - 2022 ($ billion)

    5 Five Forces Analysis

    • 5.1 Five forces summary
      • Five forces analysis - Comparison between 2023 and 2028
    • 5.2 Bargaining power of buyers
      • Bargaining power of buyers - Impact of key factors 2023 and 2028
    • 5.3 Bargaining power of suppliers
      • Bargaining power of suppliers - Impact of key factors in 2023 and 2028
    • 5.4 Threat of new entrants
      • Threat of new entrants - Impact of key factors in 2023 and 2028
    • 5.5 Threat of substitutes
      • Threat of substitutes - Impact of key factors in 2023 and 2028
    • 5.6 Threat of rivalry
      • Threat of rivalry - Impact of key factors in 2023 and 2028
    • 5.7 Market condition
      • Chart on Market condition - Five forces 2023 and 2028

    6 Market Segmentation by Product

    • 6.1 Market segments
      • Chart on Product - Market share 2023-2028 (%)
      • Data Table on Product - Market share 2023-2028 (%)
    • 6.2 Comparison by Product
      • Chart on Comparison by Product
      • Data Table on Comparison by Product
    • 6.3 Oscilloscopes - Market size and forecast 2023-2028
      • Chart on Oscilloscopes - Market size and forecast 2023-2028 ($ billion)
      • Data Table on Oscilloscopes - Market size and forecast 2023-2028 ($ billion)
      • Chart on Oscilloscopes - Year-over-year growth 2023-2028 (%)
      • Data Table on Oscilloscopes - Year-over-year growth 2023-2028 (%)
    • 6.4 Function generators - Market size and forecast 2023-2028
      • Chart on Function generators - Market size and forecast 2023-2028 ($ billion)
      • Data Table on Function generators - Market size and forecast 2023-2028 ($ billion)
      • Chart on Function generators - Year-over-year growth 2023-2028 (%)
      • Data Table on Function generators - Year-over-year growth 2023-2028 (%)
    • 6.5 Power suppliers - Market size and forecast 2023-2028
      • Chart on Power suppliers - Market size and forecast 2023-2028 ($ billion)
      • Data Table on Power suppliers - Market size and forecast 2023-2028 ($ billion)
      • Chart on Power suppliers - Year-over-year growth 2023-2028 (%)
      • Data Table on Power suppliers - Year-over-year growth 2023-2028 (%)
    • 6.6 Market opportunity by Product
      • Market opportunity by Product ($ billion)
      • Data Table on Market opportunity by Product ($ billion)

    7 Market Segmentation by End User

    • 7.1 Market segments
      • Chart on End User - Market share (2023-2028) (%)
      • Data Table on End User - Market share (2023-2028) (%)
    • 7.2 Comparison by End User
      • Chart on Comparison by End User
      • Data Table on Comparison by End User
    • 7.3 Consumer Electronics - Market size and forecast (2023-2028)
      • Chart on Consumer Electronics - Market size and forecast (2023-2028) ($ million)
      • Data Table on Consumer Electronics - Market size and forecast (2023-2028) ($ million)
      • Chart on Consumer Electronics - Year-over-year growth (2023-2028) (%)
      • Data Table on Consumer Electronics - Year-over-year growth (2023-2028) (%)
    • 7.4 Communications - Market size and forecast (2023-2028)
      • Chart on Communications - Market size and forecast (2023-2028) ($ million)
      • Data Table on Communications - Market size and forecast (2023-2028) ($ million)
      • Chart on Communications - Year-over-year growth (2023-2028) (%)
      • Data Table on Communications - Year-over-year growth (2023-2028) (%)
    • 7.5 Aerospace, Military and Defense - Market size and forecast (2023-2028)
      • Chart on Aerospace, Military and Defense - Market size and forecast (2023-2028) ($ million)
      • Data Table on Aerospace, Military and Defense - Market size and forecast (2023-2028) ($ million)
      • Chart on Aerospace, Military and Defense - Year-over-year growth (2023-2028) (%)
      • Data Table on Aerospace, Military and Defense - Year-over-year growth (2023-2028) (%)
    • 7.6 Industrial Electronics - Market size and forecast (2023-2028)
      • Chart on Industrial Electronics - Market size and forecast (2023-2028) ($ million)
      • Data Table on Industrial Electronics - Market size and forecast (2023-2028) ($ million)
      • Chart on Industrial Electronics - Year-over-year growth (2023-2028) (%)
      • Data Table on Industrial Electronics - Year-over-year growth (2023-2028) (%)
    • 7.7 Others - Market size and forecast (2023-2028)
      • Chart on Others - Market size and forecast (2023-2028) ($ million)
      • Data Table on Others - Market size and forecast (2023-2028) ($ million)
      • Chart on Others - Year-over-year growth (2023-2028) (%)
      • Data Table on Others - Year-over-year growth (2023-2028) (%)
    • 7.8 Market opportunity by End User
      • Market opportunity by $segment_name ($ million)
      • Data Table on Market opportunity by $segment_name ($ million)

    8 Customer Landscape

    • 8.1 Customer landscape overview
      • Analysis of price sensitivity, lifecycle, customer purchase basket, adoption rates, and purchase criteria

    9 Geographic Landscape

    • 9.1 Geographic segmentation
      • Chart on Market share by geography 2023-2028 (%)
      • Data Table on Market share by geography 2023-2028 (%)
    • 9.2 Geographic comparison
      • Chart on Geographic comparison
      • Data Table on Geographic comparison
    • 9.3 North America - Market size and forecast 2023-2028
      • Chart on North America - Market size and forecast 2023-2028 ($ billion)
      • Data Table on North America - Market size and forecast 2023-2028 ($ billion)
      • Chart on North America - Year-over-year growth 2023-2028 (%)
      • Data Table on North America - Year-over-year growth 2023-2028 (%)
    • 9.4 APAC - Market size and forecast 2023-2028
      • Chart on APAC - Market size and forecast 2023-2028 ($ billion)
      • Data Table on APAC - Market size and forecast 2023-2028 ($ billion)
      • Chart on APAC - Year-over-year growth 2023-2028 (%)
      • Data Table on APAC - Year-over-year growth 2023-2028 (%)
    • 9.5 Europe - Market size and forecast 2023-2028
      • Chart on Europe - Market size and forecast 2023-2028 ($ billion)
      • Data Table on Europe - Market size and forecast 2023-2028 ($ billion)
      • Chart on Europe - Year-over-year growth 2023-2028 (%)
      • Data Table on Europe - Year-over-year growth 2023-2028 (%)
    • 9.6 Middle East and Africa - Market size and forecast 2023-2028
      • Chart on Middle East and Africa - Market size and forecast 2023-2028 ($ billion)
      • Data Table on Middle East and Africa - Market size and forecast 2023-2028 ($ billion)
      • Chart on Middle East and Africa - Year-over-year growth 2023-2028 (%)
      • Data Table on Middle East and Africa - Year-over-year growth 2023-2028 (%)
    • 9.7 South America - Market size and forecast 2023-2028
      • Chart on South America - Market size and forecast 2023-2028 ($ billion)
      • Data Table on South America - Market size and forecast 2023-2028 ($ billion)
      • Chart on South America - Year-over-year growth 2023-2028 (%)
      • Data Table on South America - Year-over-year growth 2023-2028 (%)
    • 9.8 US - Market size and forecast 2023-2028
      • Chart on US - Market size and forecast 2023-2028 ($ billion)
      • Data Table on US - Market size and forecast 2023-2028 ($ billion)
      • Chart on US - Year-over-year growth 2023-2028 (%)
      • Data Table on US - Year-over-year growth 2023-2028 (%)
    • 9.9 China - Market size and forecast 2023-2028
      • Chart on China - Market size and forecast 2023-2028 ($ billion)
      • Data Table on China - Market size and forecast 2023-2028 ($ billion)
      • Chart on China - Year-over-year growth 2023-2028 (%)
      • Data Table on China - Year-over-year growth 2023-2028 (%)
    • 9.10 Germany - Market size and forecast 2023-2028
      • Chart on Germany - Market size and forecast 2023-2028 ($ billion)
      • Data Table on Germany - Market size and forecast 2023-2028 ($ billion)
      • Chart on Germany - Year-over-year growth 2023-2028 (%)
      • Data Table on Germany - Year-over-year growth 2023-2028 (%)
    • 9.11 South Korea - Market size and forecast 2023-2028
      • Chart on South Korea - Market size and forecast 2023-2028 ($ billion)
      • Data Table on South Korea - Market size and forecast 2023-2028 ($ billion)
      • Chart on South Korea - Year-over-year growth 2023-2028 (%)
      • Data Table on South Korea - Year-over-year growth 2023-2028 (%)
    • 9.12 Japan - Market size and forecast 2023-2028
      • Chart on Japan - Market size and forecast 2023-2028 ($ billion)
      • Data Table on Japan - Market size and forecast 2023-2028 ($ billion)
      • Chart on Japan - Year-over-year growth 2023-2028 (%)
      • Data Table on Japan - Year-over-year growth 2023-2028 (%)
    • 9.13 Market opportunity by geography
      • Market opportunity by geography ($ billion)
      • Data Tables on Market opportunity by geography ($ billion)

    10 Drivers, Challenges, and Opportunity/Restraints

    • 10.1 Market drivers
      • 10.2 Market challenges
        • 10.3 Impact of drivers and challenges
          • Impact of drivers and challenges in 2023 and 2028
        • 10.4 Market opportunities/restraints

          11 Competitive Landscape

          • 11.1 Overview
            • 11.2 Competitive Landscape
              • Overview on criticality of inputs and factors of differentiation
            • 11.3 Landscape disruption
              • Overview on factors of disruption
            • 11.4 Industry risks
              • Impact of key risks on business

            12 Competitive Analysis

            • 12.1 Companies profiled
              • Companies covered
            • 12.2 Market positioning of companies
              • Matrix on companies position and classification
            • 12.3 Agilent Technologies Inc.
              • Agilent Technologies Inc. - Overview
              • Agilent Technologies Inc. - Business segments
              • Agilent Technologies Inc. - Key news
              • Agilent Technologies Inc. - Key offerings
              • Agilent Technologies Inc. - Segment focus
            • 12.4 Airbus SE
              • Airbus SE - Overview
              • Airbus SE - Business segments
              • Airbus SE - Key news
              • Airbus SE - Key offerings
              • Airbus SE - Segment focus
            • 12.5 Astronics Corp.
              • Astronics Corp. - Overview
              • Astronics Corp. - Business segments
              • Astronics Corp. - Key news
              • Astronics Corp. - Key offerings
              • Astronics Corp. - Segment focus
            • 12.6 C and H Technologies Inc.
              • C and H Technologies Inc. - Overview
              • C and H Technologies Inc. - Product / Service
              • C and H Technologies Inc. - Key offerings
            • 12.7 Giga tronics Inc.
              • Giga tronics Inc. - Overview
              • Giga tronics Inc. - Product / Service
              • Giga tronics Inc. - Key offerings
            • 12.8 Informtest Holding
              • Informtest Holding - Overview
              • Informtest Holding - Product / Service
              • Informtest Holding - Key offerings
            • 12.9 Pickering Interfaces Ltd.
              • Pickering Interfaces Ltd. - Overview
              • Pickering Interfaces Ltd. - Product / Service
              • Pickering Interfaces Ltd. - Key offerings
            • 12.10 Teradyne Inc.
              • Teradyne Inc. - Overview
              • Teradyne Inc. - Business segments
              • Teradyne Inc. - Key news
              • Teradyne Inc. - Key offerings
              • Teradyne Inc. - Segment focus
            • 12.11 Vitrek LLC
              • Vitrek LLC - Overview
              • Vitrek LLC - Product / Service
              • Vitrek LLC - Key offerings
            • 12.12 VX Instruments GmbH
              • VX Instruments GmbH - Overview
              • VX Instruments GmbH - Product / Service
              • VX Instruments GmbH - Key offerings

            13 Appendix

            • 13.1 Scope of the report
              • 13.2 Inclusions and exclusions checklist
                • Inclusions checklist
                • Exclusions checklist
              • 13.3 Currency conversion rates for US$
                • Currency conversion rates for US$
              • 13.4 Research methodology
                • Research methodology
              • 13.5 Data procurement
                • Information sources
              • 13.6 Data validation
                • Data validation
              • 13.7 Validation techniques employed for market sizing
                • Validation techniques employed for market sizing
              • 13.8 Data synthesis
                • Data synthesis
              • 13.9 360 degree market analysis
                • 360 degree market analysis
              • 13.10 List of abbreviations
                • List of abbreviations

              Research Methodology

              Technavio presents a detailed picture of the market by way of study, synthesis, and summation of data from multiple sources. The analysts have presented the various facets of the market with a particular focus on identifying the key industry influencers. The data thus presented is comprehensive, reliable, and the result of extensive research, both primary and secondary.

              INFORMATION SOURCES

              Primary sources

              • Manufacturers and suppliers
              • Channel partners
              • Industry experts
              • Strategic decision makers

              Secondary sources

              • Industry journals and periodicals
              • Government data
              • Financial reports of key industry players
              • Historical data
              • Press releases

              DATA ANALYSIS

              Data Synthesis

              • Collation of data
              • Estimation of key figures
              • Analysis of derived insights

              Data Validation

              • Triangulation with data models
              • Reference against proprietary databases
              • Corroboration with industry experts

              REPORT WRITING

              Qualitative

              • Market drivers
              • Market challenges
              • Market trends
              • Five forces analysis

              Quantitative

              • Market size and forecast
              • Market segmentation
              • Geographical insights
              • Competitive landscape

              Interested in this report?

              Get your sample now to see our research methodology and insights!

              Download Now

              Frequently Asked Questions

              VXI Test Equipment market growth will increase by $ 67.2 bn during 2024-2028.

              The VXI Test Equipment market is expected to grow at a CAGR of 26.39% during 2024-2028.

              VXI Test Equipment market is segmented by Product( Oscilloscopes, Function generators, Power suppliers) End User( Consumer Electronics, Communications, Aerospace, Military and Defense, Industrial Electronics, Others)

              Agilent Technologies Inc., Airbus SE, AMETEK Inc., Astronics Corp., C and H Technologies Inc., COMTEL Electronics GmbH, Data Patterns India Ltd., Giga tronics Inc., ICS Electronics, Informtest Holding, Keysight Technologies Inc., North Atlantic Industries, Phillips Aerospace, Pickering Interfaces Ltd., Spanawave Corp., Teradyne Inc., Virginia Panel Corp., Vitrek LLC, VX Instruments GmbH, W-IE-NE-R Power Electronics GmbH are a few of the key vendors in the VXI Test Equipment market.

              Europe will register the highest growth rate of 37% among the other regions. Therefore, the VXI Test Equipment market in Europe is expected to garner significant business opportunities for the vendors during the forecast period.

              US, China, Germany, Japan, South Korea

              • Augmented production of electronic goodsThe electronics industry is expected to grow rapidly during the forecast period. An increase in the exports of electronic goods has been recorded in China is the driving factor this market.
              • Japan is the driving factor this market.
              • and Singapore. APAC mostly exports moderately priced and low-priced equipment. Also is the driving factor this market.
              • strong growth in the semiconductor and electronics industry in APAC will drive the growth of the global VXI test equipment market.Though smartphone sales have been stagnant is the driving factor this market.
              • the shipments of smartphones are growing is the driving factor this market.
              • and it will promote the growth of test and measurement equipment. The decline in smartphone sale is primarily due to the market fragmentation in North America is the driving factor this market.
              • Western Europe is the driving factor this market.
              • and China is the driving factor this market.
              • as well as the drop in the average selling price of smartphones in developed countries. However is the driving factor this market.
              • there are still many regions where smartphones are not popular is the driving factor this market.
              • and the market penetration of smartphones in these areas will increase the demand for VXI test equipment. The increasing sales of smartphones are the highest motivation factor in this segment. China is the driving factor this market.
              • Hong Kong is the driving factor this market.
              • Vietnam is the driving factor this market.
              • Singapore is the driving factor this market.
              • and Taiwan are the major producers of smartphones is the driving factor this market.
              • and the growing smartphone market will foster the sales of VXI test equipment in this region. A substantial number of people use the Internet with the help of smartphones. For instance is the driving factor this market.
              • social media platforms such as Facebook is the driving factor this market.
              • WhatsApp is the driving factor this market.
              • Twitter is the driving factor this market.
              • LinkedIn is the driving factor this market.
              • banking facilities is the driving factor this market.
              • and money wallets are more popular on mobile platforms than on desktops and laptops. The increased use of the Internet through smartphones has encouraged manufacturers to introduce new technologies such as long-term evolution( LTE) is the driving factor this market.
              • 4G is the driving factor this market.
              • and 5G to these platforms. However is the driving factor this market.
              • these evolving networks and mobile technologies require test and measurement equipment to ensure quality and reliability. Therefore is the driving factor this market.
              • due to the growing availability of inexpensive smartphones is the driving factor this market.
              • the number of people with access to the Internet is increasing. This will is the driving factor this market.
              • in turn is the driving factor this market.
              • propel the demand for VXI test equipment.The US is one of the major consumers of electronic products globally is the driving factor this market.
              • with significant technological innovations being brought into the electronics industry in the US. People in the country are highly adaptable to new and upgraded technologies. Therefore is the driving factor this market.
              • the sales of electronic goods are expected to be significant in the US is the driving factor this market.
              • which will boost the VXI test market during the forecast period. As evident is the driving factor this market.
              • the sales of electronic goods are growing across the world is the driving factor this market.
              • primarily fueled by the introduction of new technologies is the driving factor this market.
              • an increase in market penetration by various OEMs is the driving factor this market.
              • and the availability of products with the latest features at reduced prices. Hence is the driving factor this market.
              • there will be an increase in demand for VXI test equipment in the electronics and semiconductor sectors. is the driving factor this market.

              The VXI Test Equipment market vendors should focus on grabbing business opportunities from the Oscilloscopes segment as it accounted for the largest market share in the base year.
              RIA - Research AI Assistant
              Ask RIA