Wagyu Beef Market Size 2025-2029
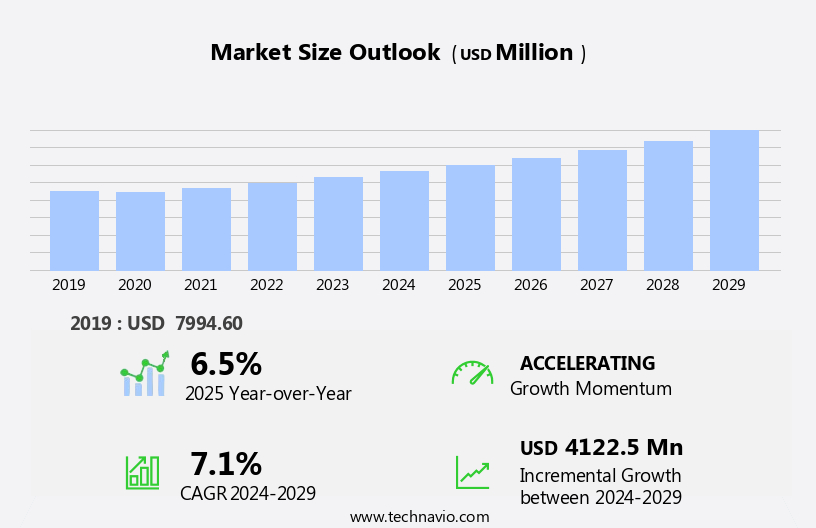
The wagyu beef market size is forecast to increase by USD 4.12 billion at a CAGR of 7.1% between 2024 and 2029.
- The market is experiencing significant growth due to increasing production and trade, driven by the rising demand for this premium beef type. The preference for clean-labeled Wagyu beef is on the rise, indicating a growing consumer trend towards transparency and quality in their food choices. This trend is further fueled by the unique taste and texture attributes of Wagyu beef, which command a premium price in the market. However, the high production costs and strict breeding requirements pose a challenge to market expansion. Additionally, regulatory compliance and certification processes add to the complexity and cost of producing Wagyu beef, which may limit the market's growth potential for some producers.
- To capitalize on the market opportunities and navigate these challenges effectively, companies should focus on optimizing production processes, building strong relationships with suppliers and retailers, and investing in research and development to improve breeding techniques and reduce production costs. By staying informed of consumer trends and regulatory requirements, Wagyu beef producers can differentiate themselves in the market and maintain their premium positioning.
What will be the Size of the Wagyu Beef Market during the forecast period?

Request Free Sample
- The market continues to evolve, shaped by dynamic market forces and evolving consumer preferences. Wagyu cattle, renowned for their intramuscular fat content and distinctive flavor profile, undergo various processes to optimize meat quality. Embryo transfer and genetic selection are utilized to enhance herd genetics, while feed management and marbling score ensure optimal carcass yield and desirable meat characteristics. Brand loyalty is a significant factor, with consumers seeking out gourmet food and luxury food experiences. Wagyu beef's high price premium is justified by its superior sensory evaluation and health benefits, such as oleic acid and stearic acid content.
- Food labeling and regulations play a crucial role in maintaining transparency and ethical sourcing. Wagyu beef finds applications across various sectors, from high-end restaurants and fine dining establishments to grocery stores and online retailers. Meat processing and meat retailers cater to diverse consumer needs, offering a range of beef cuts, including rib eye, strip steak, ground beef, flank steak, and short rib. Food safety and animal welfare are paramount, with consumers increasingly conscious of dietary trends and health concerns. Sustainable farming practices and breed improvement contribute to the ongoing evolution of the market. The market's continuous dynamism is reflected in the ongoing research and development in areas such as meat processing, artificial insemination, and sensory evaluation.
How is this Wagyu Beef Industry segmented?
The wagyu beef industry research report provides comprehensive data (region-wise segment analysis), with forecasts and estimates in "USD million" for the period 2025-2029, as well as historical data from 2019-2023 for the following segments.
- Distribution Channel
- Product
- Japanese breed
- Australian breed
- Others
- Grade Type
- A5 grade
- A4 grade
- A3 grade
- A2 grade
- A1 grade
- Application
- Food service industry
- Household
- Processed products
- Price
- Premium
- Mid-range
- Economy
- Type
- Fullblood
- Purebred
- Crossbred
- Geography
- North America
- Europe
- APAC
- Australia
- China
- India
- Japan
- South Korea
- Rest of World (ROW)
By Distribution Channel Insights
The offline segment is estimated to witness significant growth during the forecast period.
Wagyu cattle, known for their intramuscular fat and unique flavor profile, are highly sought after in the global food market. The demand for this premium beef is driven by its superior meat quality, which is evaluated through marbling score and sensory assessment. Wagyu beef's high price premium is a result of its ethical sourcing, genetic selection, and sustainable farming practices. Retailers, including supermarkets, hypermarkets, and specialty stores, play a significant role in the distribution of wagyu beef. Tesco Plc, Walmart Inc., and Target Corp., among others, have dedicated sections for this luxury food item in their stores.
Companies employ various marketing strategies, such as branding and promotional discounts, to attract consumers. Feed management is crucial in producing high-quality wagyu beef, with a focus on the right balance of nutrients and dietary trends. Meat processing techniques, such as artificial insemination and embryo transfer, ensure the continuity of the breed. Online/ E-commerce retailers have also emerged as a popular sales channel for wagyu beef, offering convenience and ease of access to consumers. Food labeling and regulations are essential in maintaining the authenticity and safety of wagyu beef. Consumers increasingly prioritize health consciousness and animal welfare, which adds to the demand for this specialty food.
High-end restaurants and fine dining establishments also feature wagyu beef on their menus, further increasing its popularity. In the production process, companies prioritize breed improvement and sustainable farming practices. Wagyu cattle yield a lower carcass weight compared to traditional cattle, but their meat is rich in oleic acid, monounsaturated fat, and has a lower saturated fat content compared to other beef types. The unique taste and texture of wagyu beef, along with its health benefits, make it a gourmet food choice for consumers.

Request Free Sample
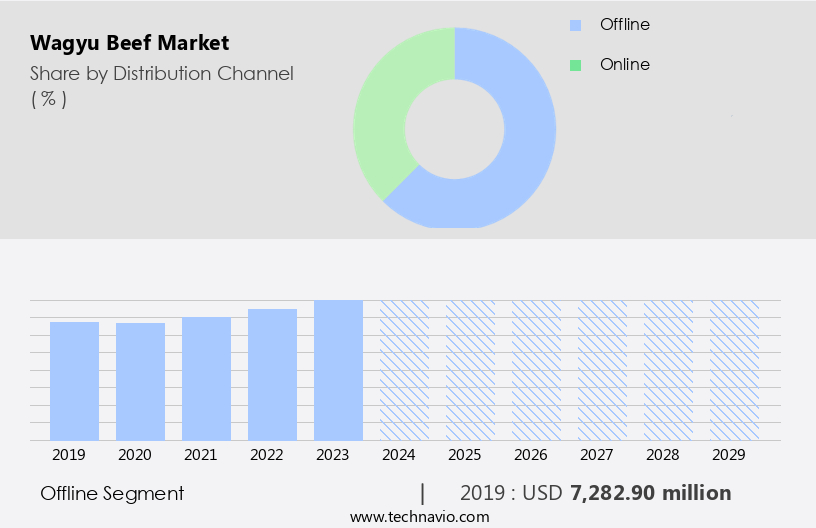
The Offline segment was valued at USD 7.28 billion in 2019 and showed a gradual increase during the forecast period.
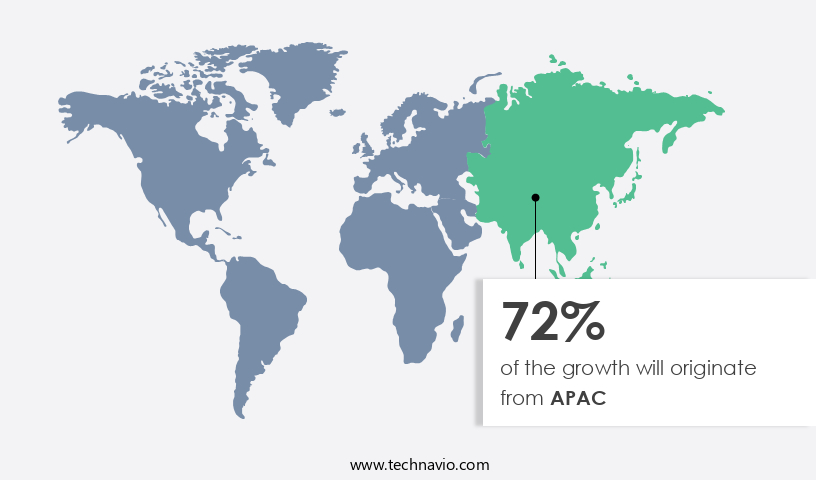
Regional Analysis
APAC is estimated to contribute 72% to the growth of the global market during the forecast period.Technavio's analysts have elaborately explained the regional trends and drivers that shape the market during the forecast period.

Request Free Sample
The market in Asia Pacific (APAC) is experiencing significant growth, fueled by the high demand for this premium beef in countries like Japan. Wagyu cattle are renowned for their intramuscular fat, which contributes to the beef's exceptional marbling score, flavor profile, and tenderness. Feed management plays a crucial role in enhancing meat quality, with a focus on natural diets and ethical sourcing. In Japan and Australia, Wagyu cattle are raised using traditional methods, including artificial insemination and breed improvement through genetic selection. The meat is then processed under stringent food safety regulations to ensure the highest standards.
The APAC market faces challenges, such as food labeling requirements and regulations, which can impact pricing and brand loyalty. High-end restaurants and fine dining establishments, as well as gourmet and luxury food retailers, are significant buyers of Wagyu beef. Consumers' increasing health consciousness and dietary trends have led to a growing demand for Wagyu beef's nutritional benefits, such as its high levels of oleic acid and lower saturated fat content compared to other beef types. Online retailers and grocery stores are also significant players in the market, offering convenience and accessibility to consumers. The market's evolution is influenced by factors such as sustainable farming practices, animal welfare, and yield grade, which are becoming increasingly important to consumers.
Despite these opportunities, the market faces challenges, including the ban on Japanese beef imports to China due to bovine spongiform encephalopathy (BSE) concerns. This ban has affected the market's growth and requires ongoing attention from industry stakeholders. In conclusion, the market in APAC is characterized by its high-quality products, stringent regulations, and evolving consumer preferences. Producers, processors, and retailers must adapt to these trends and challenges to remain competitive in this dynamic market.
Market Dynamics
Our researchers analyzed the data with 2024 as the base year, along with the key drivers, trends, and challenges. A holistic analysis of drivers will help companies refine their marketing strategies to gain a competitive advantage.
What are the key market drivers leading to the rise in the adoption of Wagyu Beef Industry?
- Wagyu beef production and trade growth are primary factors fueling the market's expansion.
- Wagyu beef, renowned for its unique flavor profile and high oleic acid content, is a prized delicacy in global markets. In 2024, Japan was the primary exporter, shipping out significant quantities to key importers such as Hong Kong, Cambodia, the US, Singapore, and Taiwan. The US market holds considerable potential due to the growing preference for high-quality beef, particularly in the form of strip steaks and ground beef. In June 2018, the resumption of beef imports from Australia, following a 17-year hiatus due to bovine spongiform encephalopathy, injected new energy into the market. However, exports from Cambodia have seen a decline, dropping from 578 tons in 2023 to 458 tons in the first eight months of 2022.
- Meat processing techniques, including artificial insemination, marbling score evaluation, and yield grade determination, are crucial factors influencing the market dynamics. Online retailers and nutritional supplements catering to the wagyu market further broaden its reach.
What are the market trends shaping the Wagyu Beef Industry?
- The trend in the market is leaning towards an increased demand for clean-label Wagyu beef. This preference reflects a growing awareness and concern for transparency and purity in food production.
- The market experiences growth due to increasing consumer preference for sustainable farming and breed improvement, resulting in high-quality, flavorful, and health-conscious meat options. Wagyu beef, known for its marbling and saturated fat content, aligns with dietary trends and consumer health consciousness. The country of origin significantly influences consumer purchasing decisions, with products from regions like the US and Canada perceived as safer and of superior taste and freshness. However, the implementation of country-of-origin labeling (COOL) adds costs for producers. Consumers prioritize animal welfare and food safety, making it essential for retailers to ensure the highest standards are met.
- Short ribs and Kobe beef, premium cuts from the Wagyu breed, continue to be popular choices among consumers. Sustainable farming practices and breed improvement efforts contribute to the market's growth, making it an attractive investment opportunity.
What challenges does the Wagyu Beef Industry face during its growth?
- The high-priced premium Wagyu beef poses a significant challenge to the growth of the industry. Wagyu beef, renowned for its exceptional quality and distinctive marbling, commands a substantial price tag. This pricing issue, coupled with increasing production costs and intense competition, presents a formidable hurdle for industry expansion.
- Wagyu beef, renowned for its unique taste profile and high-quality meat, commands a premium price in the global market. With an estimated cost three times higher than other types of beef, affordability remains a significant challenge for some consumers. The scarcity of 100% full blood Wagyu cattle, particularly in countries like the US, further adds to the exclusivity and desirability of this beef type. Despite the high price point, Wagyu beef continues to gain popularity due to its exceptional meat quality. Sensory evaluation and BMS (Beef Marbling Standard) scores highlight the high levels of intramuscular fat, which contributes to the tender, juicy, and richly flavored meat.
- The use of Wagyu beef in gourmet food and luxury food items, such as Kobe beef, further underscores its value in the culinary world. For instance, the world's most expensive taco at the Grand Velas Los Cabos, Mexico, priced at around USD25,000, features langoustine, Kobe beef, Almas Beluga caviar, and black truffle brie cheese. This demonstrates the demand for Wagyu beef in high-end dining experiences. The market's growth may be influenced by brand loyalty and the increasing awareness of the health benefits of the beef's high stearic acid content.
Exclusive Customer Landscape
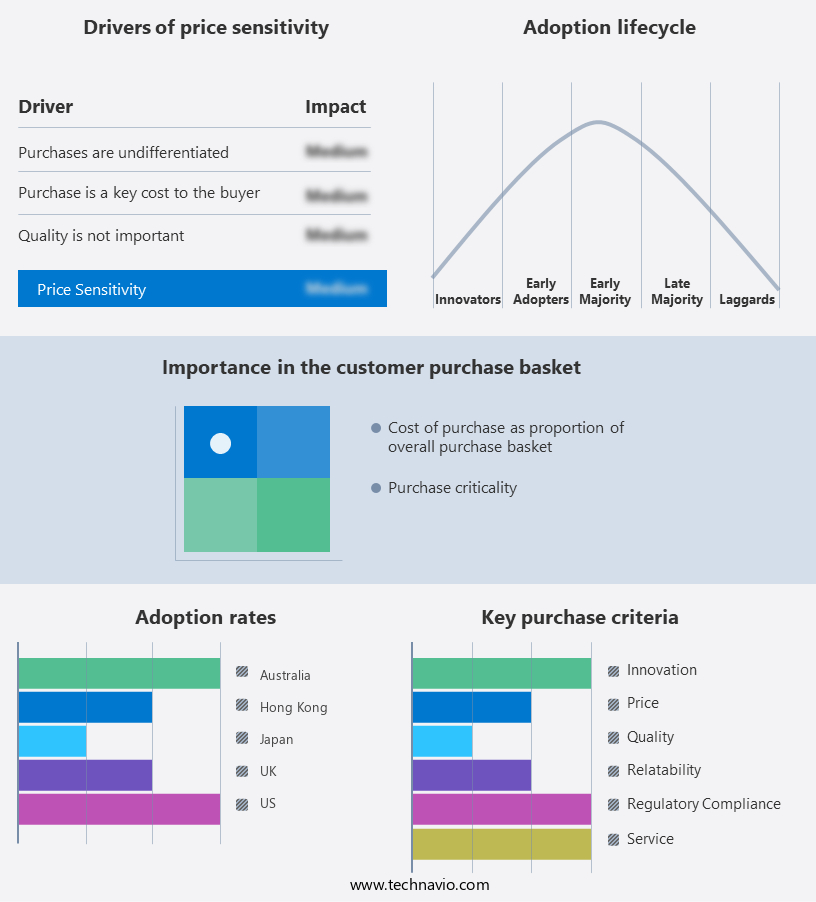
The wagyu beef market forecasting report includes the adoption lifecycle of the market, covering from the innovator's stage to the laggard's stage. It focuses on adoption rates in different regions based on penetration. Furthermore, the wagyu beef market report also includes key purchase criteria and drivers of price sensitivity to help companies evaluate and develop their market growth analysis strategies.

Customer Landscape
Key Companies & Market Insights
Companies are implementing various strategies, such as strategic alliances, wagyu beef market forecast, partnerships, mergers and acquisitions, geographical expansion, and product/service launches, to enhance their presence in the industry.
Australian Agricultural Co Ltd - The company specializes in providing premium wagyu beef under the brands Westholme and Darling Downs. Our offerings showcase the superior quality and distinctive marbling that characterizes this renowned Japanese breed. By implementing rigorous breeding and farming practices, we ensure the authenticity and consistency of our wagyu beef, delivering an unparalleled dining experience. Our commitment to excellence is reflected in every succulent, tender bite, making US a trusted source for discerning consumers seeking the finest culinary indulgences.
The industry research and growth report includes detailed analyses of the competitive landscape of the market and information about key companies, including:
- Australian Agricultural Co Ltd
- Black Hawk Farms
- Blackmore Wagyu
- Chicago Steak Co.
- DEBRAGGA Inc.
- Dolan Foods Inc.
- GRAND Western
- Havel Wagyu GbR
- Holy Grail Steak Co.
- Japan PREMIUM BEEF Inc.
- JBS SA
- Lone Mountain Wagyu LLC
- Masami Cattle Ranch Inc.
- Morgan Ranch Inc.
- Snake River Farms
- Starzen Co. Ltd.
- Stockyard Pty Ltd
- Sugar Mountain
- WAGYU MASTER Europe GmbH
- Wagyu World
Qualitative and quantitative analysis of companies has been conducted to help clients understand the wider business environment as well as the strengths and weaknesses of key industry players. Data is qualitatively analyzed to categorize companies as pure play, category-focused, industry-focused, and diversified; it is quantitatively analyzed to categorize companies as dominant, leading, strong, tentative, and weak.
Recent Development and News in Wagyu Beef Market
- In February 2023, J.D. Allen Ranch, a leading Wagyu beef producer in the United States, announced a strategic partnership with Nippon Foods Co. Ltd., a major Japanese food company. This collaboration aimed to expand the distribution of high-quality Wagyu beef in Japan, the largest consumer market for this premium product (BusinessWire).
- In May 2024, Cargill, a global food company, invested USD50 million in Australian Wagyu beef producer, SNF Group. This significant investment was to expand SNF's production capacity and improve its genetic program, aiming to increase the supply of high-quality Wagyu beef to global markets (Reuters).
- In October 2024, the Australian government approved the export of Wagyu cattle to the United States for the first time. This decision marked a significant breakthrough for the industry, as the US market is the largest consumer of beef globally (ABC News).
- In January 2025, Meat and Livestock Australia, the industry body for the Australian red meat sector, reported a 15% increase in Wagyu beef exports in the previous year. The growth was attributed to the increasing demand for high-value Wagyu beef in markets like the US, China, and the Middle East (MLA).
Research Analyst Overview
In the dynamic the market, authenticity verification plays a crucial role in maintaining consumer trust. Meat science and sensory analysis are essential in ensuring the authenticity of wagyu beef, as consumers seek the unique tenderness and flavor this breed is known for. However, the emergence of cell-cultured meat and meat alternatives challenges the traditional wagyu industry. Sustainability initiatives, including carbon footprint reduction and animal welfare certifications, are becoming essential for luxury food trends. Cold chain logistics and food distribution are key components of effective supply chain management, ensuring the preservation of meat quality. Brand building and marketing strategies are vital for wagyu producers in a global beef trade market.
Premium pricing and ethical sourcing practices are essential for maintaining a strong brand image. Food safety standards and consumer preferences for high-quality beef continue to drive the industry. Meat tenderness evaluation and flavor analysis are crucial for beef grading systems. Consumer insights reveal a growing interest in wagyu genetics and international regulations. Food technology and feed conversion ratio are also topics of interest in the wagyu breeding programs. Food fraud and food safety standards are significant concerns for the wagyu industry. Ethical sourcing practices and sensory analysis are essential for maintaining consumer trust and combating food fraud.
The Japanese beef industry continues to innovate, integrating technology and sustainability initiatives to meet evolving consumer demands.
Dive into Technavio's robust research methodology, blending expert interviews, extensive data synthesis, and validated models for unparalleled Wagyu Beef Market insights. See full methodology.
|
Market Scope
|
|
Report Coverage
|
Details
|
|
Page number
|
277
|
|
Base year
|
2024
|
|
Historic period
|
2019-2023 |
|
Forecast period
|
2025-2029
|
|
Growth momentum & CAGR
|
Accelerate at a CAGR of 7.1%
|
|
Market growth 2025-2029
|
USD 4122.5 million
|
|
Market structure
|
Fragmented
|
|
YoY growth 2024-2025(%)
|
6.5
|
|
Key countries
|
China, Japan, India, US, South Korea, Australia, Canada, Germany, France, and UK
|
|
Competitive landscape
|
Leading Companies, Market Positioning of Companies, Competitive Strategies, and Industry Risks
|
Request Free Sample
What are the Key Data Covered in this Wagyu Beef Market Research and Growth Report?
- CAGR of the Wagyu Beef industry during the forecast period
- Detailed information on factors that will drive the growth and forecasting between 2025 and 2029
- Precise estimation of the size of the market and its contribution of the industry in focus to the parent market
- Accurate predictions about upcoming growth and trends and changes in consumer behaviour
- Growth of the market across APAC, North America, Europe, Middle East and Africa, and South America
- Thorough analysis of the market's competitive landscape and detailed information about companies
- Comprehensive analysis of factors that will challenge the wagyu beef market growth of industry companies
We can help! Our analysts can customize this wagyu beef market research report to meet your requirements.
Get in touch
1 Executive Summary
- 1.1 Market overview
- Executive Summary - Chart on Market Overview
- Executive Summary - Data Table on Market Overview
- Executive Summary - Chart on Global Market Characteristics
- Executive Summary - Chart on Market by Geography
- Executive Summary - Chart on Market Segmentation by Distribution Channel
- Executive Summary - Chart on Market Segmentation by Product
- Executive Summary - Chart on Market Segmentation by Grade Type
- Executive Summary - Chart on Market Segmentation by Application
- Executive Summary - Chart on Market Segmentation by Price
- Executive Summary - Chart on Market Segmentation by Type
- Executive Summary - Chart on Incremental Growth
- Executive Summary - Data Table on Incremental Growth
- Executive Summary - Chart on Company Market Positioning
2 Technavio Analysis
- 2.1 Analysis of price sensitivity, lifecycle, customer purchase basket, adoption rates, and purchase criteria
- Analysis of price sensitivity, lifecycle, customer purchase basket, adoption rates, and purchase criteria
- 2.2 Criticality of inputs and Factors of differentiation
- Overview on criticality of inputs and factors of differentiation
- 2.3 Factors of disruption
- Overview on factors of disruption
- 2.4 Impact of drivers and challenges
- Impact of drivers and challenges in 2024 and 2029
3 Market Landscape
- 3.1 Market ecosystem
- Parent Market
- Data Table on - Parent Market
- 3.2 Market characteristics
- Market characteristics analysis
4 Market Sizing
- 4.1 Market definition
- Offerings of companies included in the market definition
- 4.2 Market segment analysis
- 4.4 Market outlook: Forecast for 2024-2029
- Chart on Global - Market size and forecast 2024-2029 ($ million)
- Data Table on Global - Market size and forecast 2024-2029 ($ million)
- Chart on Global Market: Year-over-year growth 2024-2029 (%)
- Data Table on Global Market: Year-over-year growth 2024-2029 (%)
5 Historic Market Size
- 5.1 Global Wagyu Beef Market 2019 - 2023
- Historic Market Size - Data Table on Global Wagyu Beef Market 2019 - 2023 ($ million)
- 5.2 Distribution Channel segment analysis 2019 - 2023
- Historic Market Size - Distribution Channel Segment 2019 - 2023 ($ million)
- 5.3 Product segment analysis 2019 - 2023
- Historic Market Size - Product Segment 2019 - 2023 ($ million)
- 5.4 Grade Type segment analysis 2019 - 2023
- Historic Market Size - Grade Type Segment 2019 - 2023 ($ million)
- 5.5 Application segment analysis 2019 - 2023
- Historic Market Size - Application Segment 2019 - 2023 ($ million)
- 5.6 Price segment analysis 2019 - 2023
- Historic Market Size - Price Segment 2019 - 2023 ($ million)
- 5.7 Type segment analysis 2019 - 2023
- Historic Market Size - Type Segment 2019 - 2023 ($ million)
- 5.8 Geography segment analysis 2019 - 2023
- Historic Market Size - Geography Segment 2019 - 2023 ($ million)
- 5.9 Country segment analysis 2019 - 2023
- Historic Market Size - Country Segment 2019 - 2023 ($ million)
6 Qualitative Analysis
- 6.1 Impact of AI on Global Wagyu Beef Market
7 Five Forces Analysis
- 7.1 Five forces summary
- Five forces analysis - Comparison between 2024 and 2029
- 7.2 Bargaining power of buyers
- Bargaining power of buyers - Impact of key factors 2024 and 2029
- 7.3 Bargaining power of suppliers
- Bargaining power of suppliers - Impact of key factors in 2024 and 2029
- 7.4 Threat of new entrants
- Threat of new entrants - Impact of key factors in 2024 and 2029
- 7.5 Threat of substitutes
- Threat of substitutes - Impact of key factors in 2024 and 2029
- 7.6 Threat of rivalry
- Threat of rivalry - Impact of key factors in 2024 and 2029
- 7.7 Market condition
- Chart on Market condition - Five forces 2024 and 2029
8 Market Segmentation by Distribution Channel
- 8.1 Market segments
- Chart on Distribution Channel - Market share (2024-2029) (%)
- Data Table on Distribution Channel - Market share (2024-2029) (%)
- 8.2 Comparison by Distribution Channel
- Chart on Comparison by Distribution Channel
- Data Table on Comparison by Distribution Channel
- 8.3 Offline - Market size and forecast (2024-2029)
- Chart on Offline - Market size and forecast (2024-2029) ($ million)
- Data Table on Offline - Market size and forecast (2024-2029) ($ million)
- Chart on Offline - Year-over-year growth (2024-2029) (%)
- Data Table on Offline - Year-over-year growth (2024-2029) (%)
- 8.4 Online - Market size and forecast (2024-2029)
- Chart on Online - Market size and forecast (2024-2029) ($ million)
- Data Table on Online - Market size and forecast (2024-2029) ($ million)
- Chart on Online - Year-over-year growth (2024-2029) (%)
- Data Table on Online - Year-over-year growth (2024-2029) (%)
- 8.5 Market opportunity by Distribution Channel
- Market opportunity by Distribution Channel ($ million)
- Data Table on Market opportunity by Distribution Channel ($ million)
9 Market Segmentation by Product
- 9.1 Market segments
- Chart on Product - Market share (2024-2029) (%)
- Data Table on Product - Market share (2024-2029) (%)
- 9.2 Comparison by Product
- Chart on Comparison by Product
- Data Table on Comparison by Product
- 9.3 Japanese breed - Market size and forecast (2024-2029)
- Chart on Japanese breed - Market size and forecast (2024-2029) ($ million)
- Data Table on Japanese breed - Market size and forecast (2024-2029) ($ million)
- Chart on Japanese breed - Year-over-year growth (2024-2029) (%)
- Data Table on Japanese breed - Year-over-year growth (2024-2029) (%)
- 9.4 Australian breed - Market size and forecast (2024-2029)
- Chart on Australian breed - Market size and forecast (2024-2029) ($ million)
- Data Table on Australian breed - Market size and forecast (2024-2029) ($ million)
- Chart on Australian breed - Year-over-year growth (2024-2029) (%)
- Data Table on Australian breed - Year-over-year growth (2024-2029) (%)
- 9.5 Others - Market size and forecast (2024-2029)
- Chart on Others - Market size and forecast (2024-2029) ($ million)
- Data Table on Others - Market size and forecast (2024-2029) ($ million)
- Chart on Others - Year-over-year growth (2024-2029) (%)
- Data Table on Others - Year-over-year growth (2024-2029) (%)
- 9.6 Market opportunity by Product
- Market opportunity by Product ($ million)
- Data Table on Market opportunity by Product ($ million)
10 Market Segmentation by Grade Type
- 10.1 Market segments
- Chart on Grade Type - Market share (2024-2029) (%)
- Data Table on Grade Type - Market share (2024-2029) (%)
- 10.2 Comparison by Grade Type
- Chart on Comparison by Grade Type
- Data Table on Comparison by Grade Type
- 10.3 A5 grade - Market size and forecast (2024-2029)
- Chart on A5 grade - Market size and forecast (2024-2029) ($ million)
- Data Table on A5 grade - Market size and forecast (2024-2029) ($ million)
- Chart on A5 grade - Year-over-year growth (2024-2029) (%)
- Data Table on A5 grade - Year-over-year growth (2024-2029) (%)
- 10.4 A4 grade - Market size and forecast (2024-2029)
- Chart on A4 grade - Market size and forecast (2024-2029) ($ million)
- Data Table on A4 grade - Market size and forecast (2024-2029) ($ million)
- Chart on A4 grade - Year-over-year growth (2024-2029) (%)
- Data Table on A4 grade - Year-over-year growth (2024-2029) (%)
- 10.5 A3 grade - Market size and forecast (2024-2029)
- Chart on A3 grade - Market size and forecast (2024-2029) ($ million)
- Data Table on A3 grade - Market size and forecast (2024-2029) ($ million)
- Chart on A3 grade - Year-over-year growth (2024-2029) (%)
- Data Table on A3 grade - Year-over-year growth (2024-2029) (%)
- 10.6 A2 grade - Market size and forecast (2024-2029)
- Chart on A2 grade - Market size and forecast (2024-2029) ($ million)
- Data Table on A2 grade - Market size and forecast (2024-2029) ($ million)
- Chart on A2 grade - Year-over-year growth (2024-2029) (%)
- Data Table on A2 grade - Year-over-year growth (2024-2029) (%)
- 10.7 A1 grade - Market size and forecast (2024-2029)
- Chart on A1 grade - Market size and forecast (2024-2029) ($ million)
- Data Table on A1 grade - Market size and forecast (2024-2029) ($ million)
- Chart on A1 grade - Year-over-year growth (2024-2029) (%)
- Data Table on A1 grade - Year-over-year growth (2024-2029) (%)
- 10.8 Market opportunity by Grade Type
- Market opportunity by Grade Type ($ million)
- Data Table on Market opportunity by Grade Type ($ million)
11 Market Segmentation by Application
- 11.1 Market segments
- Chart on Application - Market share (2024-2029) (%)
- Data Table on Application - Market share (2024-2029) (%)
- 11.2 Comparison by Application
- Chart on Comparison by Application
- Data Table on Comparison by Application
- 11.3 Food service industry - Market size and forecast (2024-2029)
- Chart on Food service industry - Market size and forecast (2024-2029) ($ million)
- Data Table on Food service industry - Market size and forecast (2024-2029) ($ million)
- Chart on Food service industry - Year-over-year growth (2024-2029) (%)
- Data Table on Food service industry - Year-over-year growth (2024-2029) (%)
- 11.4 Household - Market size and forecast (2024-2029)
- Chart on Household - Market size and forecast (2024-2029) ($ million)
- Data Table on Household - Market size and forecast (2024-2029) ($ million)
- Chart on Household - Year-over-year growth (2024-2029) (%)
- Data Table on Household - Year-over-year growth (2024-2029) (%)
- 11.5 Processed products - Market size and forecast (2024-2029)
- Chart on Processed products - Market size and forecast (2024-2029) ($ million)
- Data Table on Processed products - Market size and forecast (2024-2029) ($ million)
- Chart on Processed products - Year-over-year growth (2024-2029) (%)
- Data Table on Processed products - Year-over-year growth (2024-2029) (%)
- 11.6 Market opportunity by Application
- Market opportunity by Application ($ million)
- Data Table on Market opportunity by Application ($ million)
12 Market Segmentation by Price
- 12.1 Market segments
- Chart on Price - Market share (2024-2029) (%)
- Data Table on Price - Market share (2024-2029) (%)
- 12.2 Comparison by Price
- Chart on Comparison by Price
- Data Table on Comparison by Price
- 12.3 Premium - Market size and forecast (2024-2029)
- Chart on Premium - Market size and forecast (2024-2029) ($ million)
- Data Table on Premium - Market size and forecast (2024-2029) ($ million)
- Chart on Premium - Year-over-year growth (2024-2029) (%)
- Data Table on Premium - Year-over-year growth (2024-2029) (%)
- 12.4 Mid-range - Market size and forecast (2024-2029)
- Chart on Mid-range - Market size and forecast (2024-2029) ($ million)
- Data Table on Mid-range - Market size and forecast (2024-2029) ($ million)
- Chart on Mid-range - Year-over-year growth (2024-2029) (%)
- Data Table on Mid-range - Year-over-year growth (2024-2029) (%)
- 12.5 Economy - Market size and forecast (2024-2029)
- Chart on Economy - Market size and forecast (2024-2029) ($ million)
- Data Table on Economy - Market size and forecast (2024-2029) ($ million)
- Chart on Economy - Year-over-year growth (2024-2029) (%)
- Data Table on Economy - Year-over-year growth (2024-2029) (%)
- 12.6 Market opportunity by Price
- Market opportunity by Price ($ million)
- Data Table on Market opportunity by Price ($ million)
13 Market Segmentation by Type
- 13.1 Market segments
- Chart on Type - Market share (2024-2029) (%)
- Data Table on Type - Market share (2024-2029) (%)
- 13.2 Comparison by Type
- Chart on Comparison by Type
- Data Table on Comparison by Type
- 13.3 Fullblood - Market size and forecast (2024-2029)
- Chart on Fullblood - Market size and forecast (2024-2029) ($ million)
- Data Table on Fullblood - Market size and forecast (2024-2029) ($ million)
- Chart on Fullblood - Year-over-year growth (2024-2029) (%)
- Data Table on Fullblood - Year-over-year growth (2024-2029) (%)
- 13.4 Purebred - Market size and forecast (2024-2029)
- Chart on Purebred - Market size and forecast (2024-2029) ($ million)
- Data Table on Purebred - Market size and forecast (2024-2029) ($ million)
- Chart on Purebred - Year-over-year growth (2024-2029) (%)
- Data Table on Purebred - Year-over-year growth (2024-2029) (%)
- 13.5 Crossbred - Market size and forecast (2024-2029)
- Chart on Crossbred - Market size and forecast (2024-2029) ($ million)
- Data Table on Crossbred - Market size and forecast (2024-2029) ($ million)
- Chart on Crossbred - Year-over-year growth (2024-2029) (%)
- Data Table on Crossbred - Year-over-year growth (2024-2029) (%)
- 13.6 Market opportunity by Type
- Market opportunity by Type ($ million)
- Data Table on Market opportunity by Type ($ million)
14 Customer Landscape
- 14.1 Customer landscape overview
- Analysis of price sensitivity, lifecycle, customer purchase basket, adoption rates, and purchase criteria
15 Geographic Landscape
- 15.1 Geographic segmentation
- Chart on Market share by geography 2024-2029 (%)
- Data Table on Market share by geography 2024-2029 (%)
- 15.2 Geographic comparison
- Chart on Geographic comparison
- Data Table on Geographic comparison
- 15.3 APAC - Market size and forecast 2024-2029
- Chart on APAC - Market size and forecast 2024-2029 ($ million)
- Data Table on APAC - Market size and forecast 2024-2029 ($ million)
- Chart on APAC - Year-over-year growth 2024-2029 (%)
- Data Table on APAC - Year-over-year growth 2024-2029 (%)
- 15.4 North America - Market size and forecast 2024-2029
- Chart on North America - Market size and forecast 2024-2029 ($ million)
- Data Table on North America - Market size and forecast 2024-2029 ($ million)
- Chart on North America - Year-over-year growth 2024-2029 (%)
- Data Table on North America - Year-over-year growth 2024-2029 (%)
- 15.5 Europe - Market size and forecast 2024-2029
- Chart on Europe - Market size and forecast 2024-2029 ($ million)
- Data Table on Europe - Market size and forecast 2024-2029 ($ million)
- Chart on Europe - Year-over-year growth 2024-2029 (%)
- Data Table on Europe - Year-over-year growth 2024-2029 (%)
- 15.6 Middle East and Africa - Market size and forecast 2024-2029
- Chart on Middle East and Africa - Market size and forecast 2024-2029 ($ million)
- Data Table on Middle East and Africa - Market size and forecast 2024-2029 ($ million)
- Chart on Middle East and Africa - Year-over-year growth 2024-2029 (%)
- Data Table on Middle East and Africa - Year-over-year growth 2024-2029 (%)
- 15.7 South America - Market size and forecast 2024-2029
- Chart on South America - Market size and forecast 2024-2029 ($ million)
- Data Table on South America - Market size and forecast 2024-2029 ($ million)
- Chart on South America - Year-over-year growth 2024-2029 (%)
- Data Table on South America - Year-over-year growth 2024-2029 (%)
- 15.8 China - Market size and forecast 2024-2029
- Chart on China - Market size and forecast 2024-2029 ($ million)
- Data Table on China - Market size and forecast 2024-2029 ($ million)
- Chart on China - Year-over-year growth 2024-2029 (%)
- Data Table on China - Year-over-year growth 2024-2029 (%)
- 15.9 Japan - Market size and forecast 2024-2029
- Chart on Japan - Market size and forecast 2024-2029 ($ million)
- Data Table on Japan - Market size and forecast 2024-2029 ($ million)
- Chart on Japan - Year-over-year growth 2024-2029 (%)
- Data Table on Japan - Year-over-year growth 2024-2029 (%)
- 15.10 India - Market size and forecast 2024-2029
- Chart on India - Market size and forecast 2024-2029 ($ million)
- Data Table on India - Market size and forecast 2024-2029 ($ million)
- Chart on India - Year-over-year growth 2024-2029 (%)
- Data Table on India - Year-over-year growth 2024-2029 (%)
- 15.11 South Korea - Market size and forecast 2024-2029
- Chart on South Korea - Market size and forecast 2024-2029 ($ million)
- Data Table on South Korea - Market size and forecast 2024-2029 ($ million)
- Chart on South Korea - Year-over-year growth 2024-2029 (%)
- Data Table on South Korea - Year-over-year growth 2024-2029 (%)
- 15.12 US - Market size and forecast 2024-2029
- Chart on US - Market size and forecast 2024-2029 ($ million)
- Data Table on US - Market size and forecast 2024-2029 ($ million)
- Chart on US - Year-over-year growth 2024-2029 (%)
- Data Table on US - Year-over-year growth 2024-2029 (%)
- 15.13 Australia - Market size and forecast 2024-2029
- Chart on Australia - Market size and forecast 2024-2029 ($ million)
- Data Table on Australia - Market size and forecast 2024-2029 ($ million)
- Chart on Australia - Year-over-year growth 2024-2029 (%)
- Data Table on Australia - Year-over-year growth 2024-2029 (%)
- 15.14 Canada - Market size and forecast 2024-2029
- Chart on Canada - Market size and forecast 2024-2029 ($ million)
- Data Table on Canada - Market size and forecast 2024-2029 ($ million)
- Chart on Canada - Year-over-year growth 2024-2029 (%)
- Data Table on Canada - Year-over-year growth 2024-2029 (%)
- 15.15 Germany - Market size and forecast 2024-2029
- Chart on Germany - Market size and forecast 2024-2029 ($ million)
- Data Table on Germany - Market size and forecast 2024-2029 ($ million)
- Chart on Germany - Year-over-year growth 2024-2029 (%)
- Data Table on Germany - Year-over-year growth 2024-2029 (%)
- 15.16 UK - Market size and forecast 2024-2029
- Chart on UK - Market size and forecast 2024-2029 ($ million)
- Data Table on UK - Market size and forecast 2024-2029 ($ million)
- Chart on UK - Year-over-year growth 2024-2029 (%)
- Data Table on UK - Year-over-year growth 2024-2029 (%)
- 15.17 France - Market size and forecast 2024-2029
- Chart on France - Market size and forecast 2024-2029 ($ million)
- Data Table on France - Market size and forecast 2024-2029 ($ million)
- Chart on France - Year-over-year growth 2024-2029 (%)
- Data Table on France - Year-over-year growth 2024-2029 (%)
- 15.18 Market opportunity by geography
- Market opportunity by geography ($ million)
- Data Tables on Market opportunity by geography ($ million)
- 15.19 Rest of World (ROW) - Market size and forecast (2024-2029)
- Chart on Rest of World (ROW) - Market size and forecast (2024-2029) ($ million)
- Data Table on Rest of World (ROW) - Market size and forecast (2024-2029) ($ million)
- Chart on Rest of World (ROW) - Year-over-year growth (2024-2029) (%)
- Data Table on Rest of World (ROW) - Year-over-year growth (2024-2029) (%)
16 Drivers, Challenges, and Opportunity/Restraints
- 16.3 Impact of drivers and challenges
- Impact of drivers and challenges in 2024 and 2029
- 16.4 Market opportunities/restraints
17 Competitive Landscape
- 17.2 Competitive Landscape
- Overview on criticality of inputs and factors of differentiation
- 17.3 Landscape disruption
- Overview on factors of disruption
- 17.4 Industry risks
- Impact of key risks on business
18 Competitive Analysis
- 18.2 Market positioning of companies
- Matrix on companies position and classification
- 18.3 Mishima Reserve
- Mishima Reserve - Overview
- Mishima Reserve - Product / Service
- Mishima Reserve - Key offerings
- 18.4 Snake River Farms
- Snake River Farms - Overview
- Snake River Farms - Product / Service
- Snake River Farms - Key offerings
- 18.5 Japan Meat Co. Ltd.
- Japan Meat Co. Ltd. - Overview
- Japan Meat Co. Ltd. - Product / Service
- Japan Meat Co. Ltd. - Key offerings
- 18.6 Kobe Beef Marketing & Distribution Promotion Association
- Kobe Beef Marketing & Distribution Promotion Association - Overview
- Kobe Beef Marketing & Distribution Promotion Association - Product / Service
- Kobe Beef Marketing & Distribution Promotion Association - Key offerings
- 18.7 Wagyu International
- Wagyu International - Overview
- Wagyu International - Product / Service
- Wagyu International - Key offerings
- 18.8 Blackmore Wagyu
- Blackmore Wagyu - Overview
- Blackmore Wagyu - Product / Service
- Blackmore Wagyu - Key offerings
- 18.9 Starzen Co. Ltd.
- Starzen Co. Ltd. - Overview
- Starzen Co. Ltd. - Product / Service
- Starzen Co. Ltd. - Key offerings
- 18.10 Itoham Foods Inc.
- Itoham Foods Inc. - Overview
- Itoham Foods Inc. - Product / Service
- Itoham Foods Inc. - Key offerings
- 18.11 Australian Agricultural Company Limited
- Australian Agricultural Company Limited - Overview
- Australian Agricultural Company Limited - Product / Service
- Australian Agricultural Company Limited - Key offerings
- 18.12 Lone Mountain Wagyu
- Lone Mountain Wagyu - Overview
- Lone Mountain Wagyu - Product / Service
- Lone Mountain Wagyu - Key offerings
- 18.13 Morgan Ranch Inc.
- Morgan Ranch Inc. - Overview
- Morgan Ranch Inc. - Product / Service
- Morgan Ranch Inc. - Key offerings
- 18.14 Jack’s Creek
- Jack’s Creek - Overview
- Jack’s Creek - Product / Service
- Jack’s Creek - Key offerings
- 18.15 Mayura Station
- Mayura Station - Overview
- Mayura Station - Product / Service
- Mayura Station - Key offerings
- 18.16 Sher Wagyu
- Sher Wagyu - Overview
- Sher Wagyu - Product / Service
- Sher Wagyu - Key offerings
- 18.17 Stone Axe Pastoral Company
- Stone Axe Pastoral Company - Overview
- Stone Axe Pastoral Company - Product / Service
- Stone Axe Pastoral Company - Key offerings
- 18.18 Oakey Premium Wagyu
- Oakey Premium Wagyu - Overview
- Oakey Premium Wagyu - Product / Service
- Oakey Premium Wagyu - Key offerings
- 18.19 Westholme Wagyu
- Westholme Wagyu - Overview
- Westholme Wagyu - Product / Service
- Westholme Wagyu - Key offerings
- 18.20 Stockyard Beef
- Stockyard Beef - Overview
- Stockyard Beef - Product / Service
- Stockyard Beef - Key offerings
- 18.21 First Light Farms
- First Light Farms - Overview
- First Light Farms - Product / Service
- First Light Farms - Key offerings
- 18.22 Imperial Wagyu Beef
- Imperial Wagyu Beef - Overview
- Imperial Wagyu Beef - Product / Service
- Imperial Wagyu Beef - Key offerings
- 18.23 Australian Agricultural Co Ltd
- Australian Agricultural Co Ltd - Overview
- Australian Agricultural Co Ltd - Product / Service
- Australian Agricultural Co Ltd - Key offerings
- 18.24 Black Hawk Farms
- Black Hawk Farms - Overview
- Black Hawk Farms - Product / Service
- Black Hawk Farms - Key offerings
- 18.25 Blackmore Wagyu
- Blackmore Wagyu - Overview
- Blackmore Wagyu - Product / Service
- Blackmore Wagyu - Key offerings
- 18.26 Chicago Steak Co.
- Chicago Steak Co. - Overview
- Chicago Steak Co. - Product / Service
- Chicago Steak Co. - Key offerings
- 18.27 DEBRAGGA Inc.
- DEBRAGGA Inc. - Overview
- DEBRAGGA Inc. - Product / Service
- DEBRAGGA Inc. - Key offerings
- 18.28 Dolan Foods Inc.
- Dolan Foods Inc. - Overview
- Dolan Foods Inc. - Product / Service
- Dolan Foods Inc. - Key offerings
- 18.29 GRAND WESTERN
- GRAND WESTERN - Overview
- GRAND WESTERN - Product / Service
- GRAND WESTERN - Key offerings
- 18.30 Havel Wagyu GbR
- Havel Wagyu GbR - Overview
- Havel Wagyu GbR - Product / Service
- Havel Wagyu GbR - Key offerings
- 18.31 Holy Grail Steak Co.
- Holy Grail Steak Co. - Overview
- Holy Grail Steak Co. - Product / Service
- Holy Grail Steak Co. - Key offerings
- 18.32 JAPAN PREMIUM BEEF Inc.
- JAPAN PREMIUM BEEF Inc. - Overview
- JAPAN PREMIUM BEEF Inc. - Product / Service
- JAPAN PREMIUM BEEF Inc. - Key offerings
- 18.33 JBS SA
- JBS SA - Overview
- JBS SA - Product / Service
- JBS SA - Key offerings
- 18.34 Lone Mountain Wagyu LLC
- Lone Mountain Wagyu LLC - Overview
- Lone Mountain Wagyu LLC - Product / Service
- Lone Mountain Wagyu LLC - Key offerings
- 18.35 Masami Cattle Ranch Inc.
- Masami Cattle Ranch Inc. - Overview
- Masami Cattle Ranch Inc. - Product / Service
- Masami Cattle Ranch Inc. - Key offerings
- 18.36 Morgan Ranch Inc.
- Morgan Ranch Inc. - Overview
- Morgan Ranch Inc. - Product / Service
- Morgan Ranch Inc. - Key offerings
- 18.37 Snake River Farms
- Snake River Farms - Overview
- Snake River Farms - Product / Service
- Snake River Farms - Key offerings
- 18.38 Starzen Co. Ltd.
- Starzen Co. Ltd. - Overview
- Starzen Co. Ltd. - Product / Service
- Starzen Co. Ltd. - Key offerings
- 18.39 Stockyard Pty Ltd
- Stockyard Pty Ltd - Overview
- Stockyard Pty Ltd - Product / Service
- Stockyard Pty Ltd - Key offerings
- 18.40 Sugar Mountain
- Sugar Mountain - Overview
- Sugar Mountain - Product / Service
- Sugar Mountain - Key offerings
- 18.41 WAGYU MASTER Europe GmbH
- WAGYU MASTER Europe GmbH - Overview
- WAGYU MASTER Europe GmbH - Product / Service
- WAGYU MASTER Europe GmbH - Key offerings
- 18.42 Wagyu World
- Wagyu World - Overview
- Wagyu World - Product / Service
- Wagyu World - Key offerings
19 Appendix
- 19.2 Inclusions and exclusions checklist
- Inclusions checklist
- Exclusions checklist
- 19.3 Currency conversion rates for US$
- Currency conversion rates for US$
- 19.4 Research methodology
- 19.7 Validation techniques employed for market sizing
- Validation techniques employed for market sizing
- 19.9 360 degree market analysis
- 360 degree market analysis
- 19.10 List of abbreviations